Randomized Controlled Trial
. 2025 Nov 1;26(11):773-782.
doi: 10.1093/pm/pnaf058.

Early outcomes with a flexible ECAP based closed loop using multiplexed spinal cord stimulation waveforms-single-arm study with in-clinic randomized crossover testing

Affiliations
Randomized Controlled Trial

Early outcomes with a flexible ECAP based closed loop using multiplexed spinal cord stimulation waveforms-single-arm study with in-clinic randomized crossover testing

Vahid Mohabbati et al. Pain Med. .

Abstract

Background: Spinal cord stimulation (SCS) systems that deliver fixed amplitudes expose target tissue to varying electrical fields due to the changing lead-to-cord distance accompanying postural shifts and other body movements. Inconsistent stimulation results in periods of overstimulation or under-stimulation perceived by patients as discomfort or potentially inadequate pain relief. CL-SCS may be applied to provide a comfortable level of perception down to imperceptible stimulation, commonly preferred in higher frequency and multiplexed programming. Here we report outcomes from a study evaluating a closed-loop (CL) SCS system that uses spinal evoked compound action potentials to adjust stimulation.

Methods: This ongoing study combines the evaluation of pain-related outcomes (for ≤24 months) with in-clinic randomized, crossover testing of CL performance.

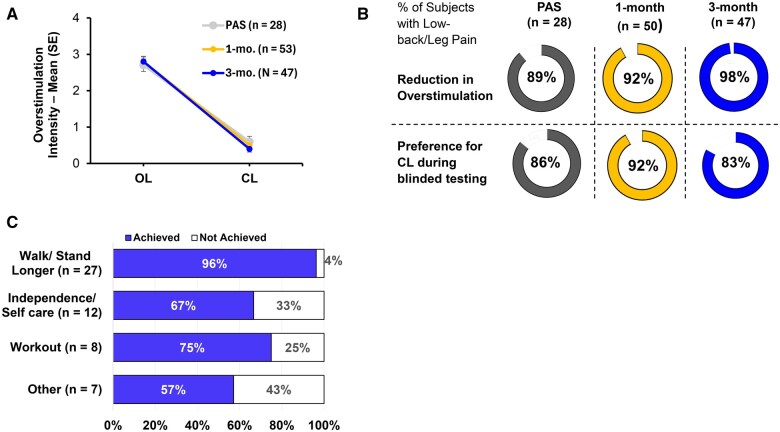
Results: Sixty subjects have been implanted with the CL-SCS system, and 54 subjects have completed the 3-month visit. Sixty percent preferred below-perception waveforms for therapy during at-home use. The study successfully met its primary endpoint with 89.3% of subjects in the Primary Analysis Set (n = 28) reporting reduction in overstimulation with CL-SCS relative to OL-SCS at 1 month (P < .001; binomial exact test); at 3 months, 86% of subjects with low-back/leg pain (n = 51); and all 3 with upper limb pain reported ≥50% reduction in pain, relative to baseline.

Conclusions: The data presented here support the performance of a flexible CL-SCS system that can deliver a variety of waveforms, with amplitude programmed to patient comfort and automatically adjusted up to 50 times per second, to improve the consistency of therapy experience.

Registration: This study is registered on ClinicalTrials.gov number NCT05177354 https://clinicaltrials.gov/search? term=NCT05177354.


Figures

Figure 1.
Figure 1.
Study flow diagram. The study has 2 parts including a long-term follow-up phase out to 24 months from Device Activation and a randomized, crossover, in-clinic testing of CL performance. Subjects were blinded to the sequence of CL and OL periods for the duration of the in-clinic testing. At the end of the crossover testing, subjects were asked to state a preference for period 1 or 2. The randomization is only for the duration of the in-clinic testing and determines the sequence of CL and OL testing. At the end of the visit subjects left with their most used therapy setting active.
Figure 2.
Figure 2.
Subject disposition up to the 3-month visit and for the Primary Endpoint assessment. Counts at each visit indicate the number of subjects who completed the visit. The Primary Analysis Set (PAS) includes the first 28 subjects with Low back/leg pain and usable ECAPs to complete the 3-month visit. The 60 subjects implanted with the study device include 57 with low-back/leg pain and 3 with upper limb pain.
Figure 3.
Figure 3.
(A) Summary of the most used therapy for each patient over the 30 days preceding the 3-month visit. *DTM includes 1 low-rate (<200 Hz) and 1 high-rate (≥200–1200 Hz) program applied at 2 different targets. Of the 7 subjects with an OL waveform as their most used therapy group, 1 had a pacemaker that interfered with the CL feature, 4 others did not have consistent ECAPs at comfortable stimulation amplitudes, and 2 used a mix of OL-SCS and CL-SCS. (B) Perception threshold (PT) and Program1 amplitude for the most used therapy settings with the subject seated in a comfortable posture (ie, “rest” state). PT is defined as the amplitude at which the sensation of stimulation disappears when decreasing stepwise. PT is specific to the posture assumed by the person during programming. Stimulation amplitude was programmed to comfort near PT (ie, below, at or above perception). Program1 elicits the ECAP signal and provides therapy. When programmed to less than PT (below dashed line), ECAPs present during movement that cause the lead-to-cord distance to decrease. When stimulation amplitude is above perception, ECAPs are present at “rest.”
Figure 4.
Figure 4.
Examples of the CL feature adjusting stimulation with ECAPs present at rest or only during movement. ECAPs were measured in-clinic, at rest and during movement, with OL- and CL-SCS. The large variation in ECAP in the OL setting is due to the difference in the “dose” reaching the spinal cord and volume of neural tissue activated with changes in lead-to-cord distance as the subject performs a movement. With CL-SCS, amplitude was adjusted to provide a consistent dose, which is reflected in the significantly reduced ECAP variability relative to the OL period. Both examples are with DTM therapy with rates of 50 and 900 Hz for the 2 programs. (A) Example for CL engagement during movement when ECAPs present. Program1 and Program2 amplitudes were at 94% and 64% of perception threshold (PT), respectively. Program1 amplitude was below PT, there are no ECAPs at rest (eg, at t2 and t4). However, when the subject engages in movements that reduce the lead-to-cord distance, the VTA of in spinal cord increases, seen as a large change in ECAP amplitude (eg, at t1 and t3). (B) Example for CL engagement with ECAPs present at rest. Program1 and Program2 amplitudes were at 105% and 80% of PT, respectively. Program1 is above PT, ECAPs are present at rest (eg, at t1 and t2) and during movement (eg, at t3). The increase in ECAP size during movement can be seen in the example shown in the inset at t3.
Figure 5.
Figure 5.
(A) Outcome of the randomized, crossover, in-clinic testing of CL feature performance at 1- and 3-months for subjects with low back/leg pain. Average intensity of overstimulation during protocol-specified activities with CL-SCS and OL-SCS; error bars show standard error from the mean. PAS—primary analysis set. All 3 subjects with upper limb pain also reported reduction in overstimulation at both time points. (B) Percent of subjects that experienced reduction in overstimulation with CL vs. OL and the proportion expressing a preference for the CL setting during blinded testing. For figures A and B, data from low-back/leg pain subjects that completed the 1- and 3-month visits are shown, to be consistent with the primary analysis set; 4 subjects did not have consistent ECAPs at comfortable stimulation amplitudes and did not complete the in-clinic testing at 1- and 3-month visits. (C) Proportion of subjects that were able to achieve the activity goal they identified at the Baseline visit by the time of the 3-month follow-up. Data for all 54 subjects, including 3 with upper limb pain that completed the 3-month visit are shown in the plot; those with upper limb pain had chosen self-care (n = 2) and return to work (n = 1) as their goal, and all 3 were successful.
Figure 6.
Figure 6.
(A) Reduction in overall low-back/leg pain visual analogue score at 3 months post device activation relative to Baseline. All three subjects with upper limb pain had ≥50% reduction in pain. (B) Improvement in physical function as measured by the Oswestry disability index for subjects with low-back/leg pain. Per the ODI instrument, individuals are categorized as having minimal, moderate, or severe disability when scores are between 0–20%, 21–40%, and 41–60%.

References

    1. Duarte RV, Bentley A, Soliday N, et al. Cost-utility analysis of evoke closed-loop spinal cord stimulation for chronic back and leg pain. Clin J Pain. 2023;39(10):551-559. 10.1097/AJP.0000000000001146 - DOI - PMC - PubMed
    1. Kapural L, Calodney A. Retrospective Efficacy and Cost-Containment Assessment of 10 kHz Spinal Cord Stimulation (SCS) in Non-Surgical Refractory Back Pain Patients. J Pain Res. 2022;15:3589-3595. 10.2147/JPR.S373873 - DOI - PMC - PubMed
    1. North RB, Kidd D, Shipley J, Taylor RS. Spinal cord stimulation versus reoperation for failed back surgery syndrome: a cost effectiveness and cost utility analysis based on a randomized, controlled trial. Neurosurgery. 2007;61(2):361-368. discussion 368-9. 10.1227/01.NEU.0000255522.42579.EA - DOI - PubMed
    1. Levy RM. Anatomic considerations for spinal cord stimulation. Neuromodulation. 2014;17Suppl1:2-11. 10.1111/ner.12175 - DOI - PubMed
    1. He J, Barolat G, Holsheimer J, Struijk JJ. Perception threshold and electrode position for spinal cord stimulation. Pain. 1994;59(1):55-63. 10.1016/0304-3959(94)90047-7 - DOI - PubMed

Publication types

Associated data

Grants and funding