

Disparities, trends, and projections of cancer mortality burden related to high body mass index in China from 2005 to 2030
- PMID: 40378844
- PMCID: PMC12208322
- DOI: 10.1016/j.xcrm.2025.102137
Disparities, trends, and projections of cancer mortality burden related to high body mass index in China from 2005 to 2030
Abstract
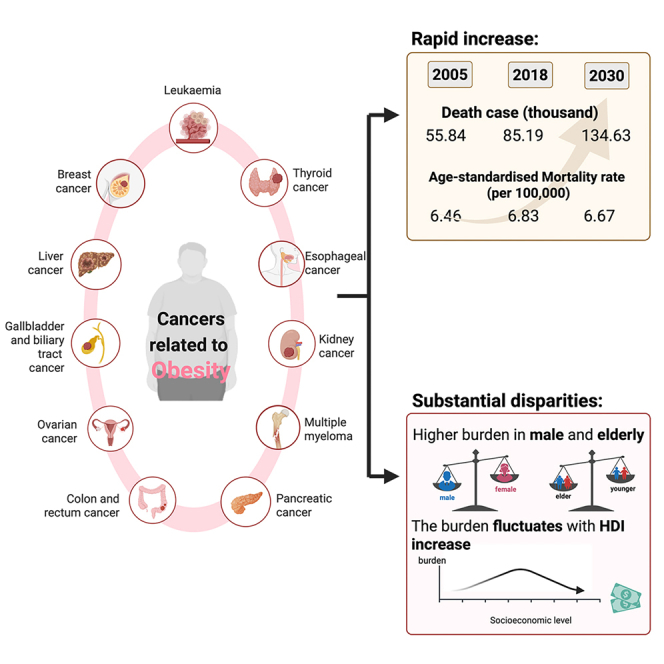
High body mass index (BMI), defined as a BMI greater than or equal to 20-25 kg/m2, is considered a rapid-increased risk factor for cancer. Based on comparative risk assessment framework, we elaborate the mortality burden of cancers attributable to high BMI in China. In 2018, we estimated that there were 85.19 thousand cancer-related deaths and 2,220.01 thousand cancer-related years of life lost (YLLs) attributable to high BMI in China. Of these, 62.14 thousand deaths and 1,698.81 thousand YLLs were from males. With higher socioeconomic levels, the burden generally increases initially and then decreases. By 2030, the projected age-standardized mortality rate attributable to high BMI in China will be 6.67 per 100,000 people, increased by 3.25% from that in 2005. In summary, the swift increase and substantial disparities in the cancer burden attributable to high BMI underscore the urgent need for evidence-based policies and interventions in China.
Keywords: age-standardized mortality rate; cancer; death; disease burden; obesity; prediction; year of life lost.
Copyright © 2025 The Authors. Published by Elsevier Inc. All rights reserved.
Conflict of interest statement
Declaration of interests The authors declare no competing interests.
Figures
Similar articles
-
Diet, physical activity and behavioural interventions for the treatment of overweight or obese children from the age of 6 to 11 years.Cochrane Database Syst Rev. 2017 Jun 22;6(6):CD012651. doi: 10.1002/14651858.CD012651. Cochrane Database Syst Rev. 2017. PMID: 28639319 Free PMC article.
-
High-BMI-related low back pain in China: a GBD-based observational study on sex-age trends and projections (1990-2021).Eur J Med Res. 2025 Jun 19;30(1):496. doi: 10.1186/s40001-025-02765-3. Eur J Med Res. 2025. PMID: 40537882 Free PMC article.
-
Causal impact of obesity class stratification and endometrial cancer subtypes: an integrated mendelian randomization and global burden of disease study 2021 analysis.Int J Surg. 2025 Jun 27. doi: 10.1097/JS9.0000000000002883. Online ahead of print. Int J Surg. 2025. PMID: 40576175
-
What is the clinical effectiveness and cost-effectiveness of using drugs in treating obese patients in primary care? A systematic review.Health Technol Assess. 2012;16(5):iii-xiv, 1-195. doi: 10.3310/hta16050. Health Technol Assess. 2012. PMID: 22340890 Free PMC article.
-
[Disease burden and future trend predictions of age-related hearing loss in China and worldwide from 1990 to 2021].Beijing Da Xue Xue Bao Yi Xue Ban. 2025 Jun 18;57(3):545-553. doi: 10.19723/j.issn.1671-167X.2025.03.019. Beijing Da Xue Xue Bao Yi Xue Ban. 2025. PMID: 40509833 Free PMC article. Chinese.
References
-
- Kocarnik J.M., Compton K., Dean F.E., Fu W., Gaw B.L., Harvey J.D., Henrikson H.J., Lu D., Pennini A., et al. Global Burden of Disease 2019 Cancer Collaboration Cancer Incidence, Mortality, Years of Life Lost, Years Lived With Disability, and Disability-Adjusted Life Years for 29 Cancer Groups From 2010 to 2019: A Systematic Analysis for the Global Burden of Disease Study 2019. JAMA Oncol. 2022;8:420–444. doi: 10.1001/jamaoncol.2021.6987. - DOI - PMC - PubMed
MeSH terms
LinkOut - more resources
Full Text Sources
Medical
