. 2025 Jul 9;5(7):100878.
doi: 10.1016/j.xgen.2025.100878. Epub 2025 May 15.

Integrative characterization of MYC RNA-binding function

Affiliations

Integrative characterization of MYC RNA-binding function

Sihan Li et al. Cell Genom. .

Abstract

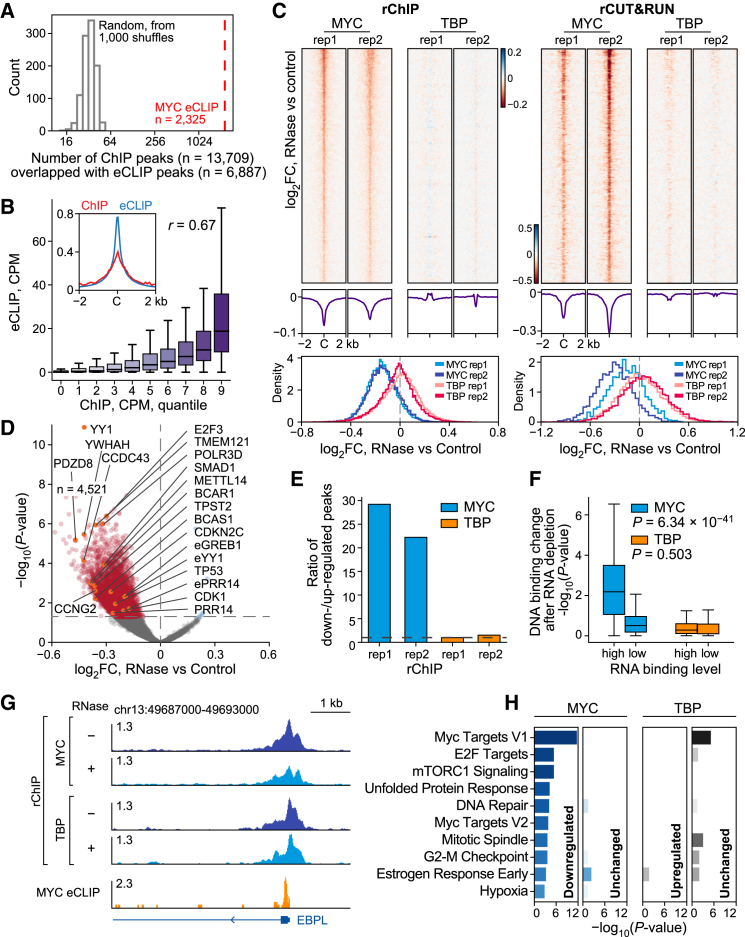
Emerging evidence suggests that MYC interacts with RNAs. Here, we performed an integrative characterization of MYC as an RNA-binding protein in six cell lines. We found that MYC binds to a myriad of RNAs with high affinity for guanosine-rich RNAs. Global and specific depletion of RNAs reduces MYC chromatin occupancy. Mechanistically, two highly conserved sequences, amino acids 355-357 KRR and 364-367 RQRR, within the basic region of MYC are necessary for its RNA binding. Notably, alanine substitution of KRR abolishes MYC's RNA-binding ability both in vitro and in vivo, without affecting its ability to bind E-box DNA as part of the MYC:MAX dimer in vitro. The loss of RNA-binding function decreases MYC chromatin binding in vivo and attenuates its ability to promote gene expression, cell-cycle progression, and proliferation. Our study lays a foundation for future investigation into the role of RNAs in MYC-mediated transcriptional activation and oncogenic functions.

Keywords: CRISPR-Display; MYC; RNA-binding protein (RBP); TF RNA binding; arginine-rich motif; eCLIP; enhancer RNA; gene regulation; guanosine-rich RNA; rChIP.


Conflict of interest statement

Declaration of interests The authors declare no competing interests.

Figures

None
Graphical abstract
Figure 1
Figure 1
Transcriptome-wide eCLIP-seq analysis comprehensively characterizes the RNA-binding spectrum of MYC across multiple cell lines (A) Visualization of RNAs associated with MYC protein. MCF-7 cells that underwent UV crosslinking were treated with low (+) or high (++) doses of RNase. RNA fractions from MYC-RNA adducts enriched by immunoprecipitation (IP) were biotinylated with pCp-biotin and visualized using streptavidin-horseradish peroxidase by chemiluminescence (left). Western blot of MYC was performed for both IP and input samples (right). The red box indicates the cut region (55–130 kDa) used for RNA extraction and eCLIP-seq. Normal IgG served as a control. (B–D) Heatmaps showing the read density from eCLIP-seq of endogenous MYC (endo. MYC) and input (B), HITS-CLIP of endogenous MYC (C), and eCLIP-seq of FLAG-MYC (D) in MCF-7/shMYC cells. Each row represents a 4-kb genomic region centered at the summits of peaks identified in the endogenous MYC eCLIP-seq. Peaks are sorted by the intensity of the eCLIP-seq signals from the endogenous MYC. (E) Principal-component analysis (PCA) of eCLIP-seq for two biological replicates from each cell line. (F) Genomic distribution of eCLIP-seq peaks across six cell lines. (G) Genomic tracks illustrating a shared eCLIP-seq peak at the GNB1 promoter, an MCF-7 specific peak at the BCAS4 promoter, and a K562-specific peak at the BCR promoter. (H) Pathway analysis of genes associated with shared eCLIP-seq peaks. See also Figure S1 and Table S1.
Figure 2
Figure 2
RNA depletion decreases MYC chromatin occupancy (A) Distribution of the number of MYC ChIP-seq peaks (n = 13,709) that is adjacent (at least 1 bp overlap) to MYC eCLIP-seq peaks (n = 6,887) compared to a randomly shuffled background (shuffled MYC eCLIP-seq peaks 1,000 times) in MCF-7 cells. (B) Correlation between MYC RNA binding (eCLIP-seq) and chromatin binding (ChIP-seq) signals among MYC ChIP-seq peaks. ChIP-seq peaks were grouped into deciles based on ChIP-seq signal strength. The 10th decile represents the highest ChIP-seq read enrichment. The inset line plot shows the average binding intensity across a 4-kb region centered at the summits of MYC ChIP-seq peaks. The correlation coefficient and p value were determined by Spearman’s rank correlation analysis. (C) Chromatin binding changes after RNase treatment as assessed by rChIP-seq (left) and rCUT&RUN (right) in MCF-7 cells. Heatmaps show the read density changes after RNase treatment (top). Each row represents a 4-kb genomic region centered at the summits of peaks identified from non-RNase-treated samples of the corresponding method. Peaks are sorted by peak significance. Average read density changes spanning the 4-kb genomic region (center) and fold change (FC) distributions of peaks (bottom) were shown. Peak counts for each dataset are as follows: rChIP-seq MYC (n = 13,709), TBP (n = 24,441); rCUT&RUN, MYC (n = 3,024); and TBP (n = 7,628). (D) Volcano plot of changes in MYC chromatin binding from rChIP-seq. Red dots represent the significantly downregulated rChIP-seq peaks (log2FC < 0, p < 0.05, n = 4,521). (E) Bar plot showing the ratio of downregulated peaks (log2FC < −0.1) to upregulated peaks (log2FC > 0.1) after RNase treatment in rChIP-seq. (F) Boxplot comparing changes in chromatin-binding levels after RNase treatment between peaks with high vs. low RNA-binding levels. Only the top 250 peaks from each group were used for comparison. The p value was determined by the Wilcoxon rank-sum test. (G) Genomic tracks of MYC eCLIP-seq, MYC rChIP-seq, and TBP rChIP-seq at the promoter of MYC target gene EBPL. (H) Pathway analysis of genes with downregulated (log2FC < 0, p < 0.05), upregulated (log2FC > 0, p < 0.05), or unchanged (p ≥ 0.05) MYC DNA binding (rChIP-seq) at promoters. See also Figure S2 and Tables S2 and S3.
Figure 3
Figure 3
MYC exhibits high binding affinity for G-rich RNA sequences (A) Heatmap showing the Z score-transformed PEKA scores of 5-mers for each cell line based on PEKA (positionally enriched k-mer analysis). (B) Consensus RNA motif identified by MEME (multiple em for motif elicitation) analysis in each cell line. The MEME-reported p value is shown above each motif. (C and D) Representative EMSA demonstrating MYC binding to various RNA probes as indicated (C) and binding curves showing the fraction of bound RNAs at a series of concentrations of recombinant MYC protein (D). MYC protein was titrated 2-fold, starting at 2,500 nM, and incubated with 200 nM DyLight 800-labeled RNA probes. The experiments were performed in triplicate (n = 3). Dots represent the means and error bars represent the standard deviation (SD). The apparent dissociation constant (KD) and SD are shown in each plot. (E) EMSA of MYC-RNA complexes by a supershift assay. Recombinant MYC protein (150 nM) was incubated with 200 nM DyLight-labeled RNA probes, followed by the addition of 0.5 μg of anti-MYC antibody or normal IgG. (F) EMSA demonstrating MYC binding to various RNA probes derived from eGREB1, eYY1, and ePRR14. MYC protein was titrated 2-fold, starting at 2,500 nM, and incubated with 200 nM DyLight-labeled RNA probes. (G) Predicted secondary structure of eGREB1 and G-to-C substituted probes (35 nt) by RNAfold. Sites of G-to-C substitution are colored in red. (H) Binding curves showing the fraction of bound RNAs in (G) at a series of concentrations of MYC protein. The experiments were performed in triplicate (n = 3). Dots represent the means and error bars represent the SDs. See also Figure S3 and Table S4.
Figure 4
Figure 4
MYC interacts with RNAs through its basic region (A) Structure domains (top) and sequence alignment of MYC protein across multiple species (bottom). Amino acids with a predicted RNA-binding potential score >0.6 by RNABindRPlus are highlighted in blue. BR, basic region; HLH, helix-loop-helix; LZ, leucine zipper; MB, MYC box. MYC protein variants with mutation or deletion in amino acids 355–367 were constructed. (B) EMSA analysis showing the binding between various RNA probes and recombinant wild-type (WT) MYC or MYC mutants. MYC protein (150 nM) was incubated with 200 nM DyLight-labeled RNA probes. (C) Binding curves showing the fraction of bound RNAs by EMSA at a series of concentrations of recombinant WT MYC or MYC mutants. MYC proteins were titrated 2-fold, starting at 2,500 nM, and incubated with 200 nM DyLight-labeled eGREB1 or AAG-mer probes. The experiments were performed in triplicate (n = 3). Dots represent the means and error bars represent the SDs. (D) Table showing the KD and SD of MYC variants binding to eGREB1, AAG-mer, and GGAA-mer RNA probes. (E) Western blot showing FLAG-MYC levels in U2OS-MYCKO-Tet-On-MYC cells after induction with 1 μg/mL doxycycline (Dox) for 24 h. FLAG-tagged MYCWT, MYCKRR3A, and MYC7A were analyzed. (F) Number and genomic distribution of FLAG-MYC eCLIP-seq peaks identified in Dox-treated samples (+Dox vs. −Dox). (G) RNA-binding levels (+Dox vs. −Dox) of FLAG-tagged MYCWT, MYCKRR3A, and MYC7A by eCLIP. Heatmaps show the read density. Each row represents a 4-kb genomic region centered at the summits of peaks identified in MYCWT. The lower line plot shows the average read density. (H) Genomic tracks showing eCLIP-seq of FLAG-tagged MYCWT, MYCKRR3A, and MYC7A at EXOSC4 and CHCHD4 gene loci. See also Figure S4 and Table S5.
Figure 5
Figure 5
RNA-binding-deficient MYC mutant exhibits reduced chromatin interaction (A) DNA EMSA analysis of recombinant MYC:MAX heterodimer. MAX protein (170 nM), in the absence or presence of 500 nM of WT MYC or MYC mutants, was incubated with 20 nM of the fluorescence-labeled IRD700-CACGTG probe (E-box DNA motif) and separated on a native PAGE gel. (B) Competitive DNA EMSA of MYCWT:MAX and MYCKRR3A:MAX dimers binding to the IRD700-labeled E-box motif (CACGTG, hot probe) with a series of 2-fold dilutions of unlabeled E-box motif (CACGTG, cold probe) or mutant probe (ATCTAG, cold probe). MYC (250 nM) and MAX (85 nM) proteins were used. (C) Dose-response curves showing the inhibition of binding between the hot probe and MYC:MAX dimers by cold probes, as indicated in (B). The experiments were performed in triplicate (n = 3). Dots represent the means and error bars represent the SDs. (D) Summary of RNA- and DNA-binding capacity of MYC proteins, as indicated. The DNA-binding capacity denotes the MYC:MAX dimers. (E) Western blot of MYC and co-immunoprecipitated HCFC1, FBXW7, and MAX levels in FLAG-tagged MYCWT, MYCKRR3A, or MYC7A expressing U2OS-MYCKO-Tet-On-MYC cells induced with 1 μg/mL Dox for 24 h. (F) Number and genomic distribution of MYC and MAX co-bound regions (ChIP-Rx peaks) identified in MYC-expressing U2OS-MYCKO-Tet-On-MYC cells, as indicated. (G) The overlap among the MYC:MAX co-bound regions identified in (F). (H) Chromatin binding levels of MYC and MAX by ChIP-Rx from FLAG-tagged MYCWT, MYCKRR3A, or MYC7A expressing U2OS-MYCKO-Tet-On-MYC cells. Heatmaps (top) show the read density, measured as reference-adjusted reads per million. Each row represents a 4-kb genomic region centered at the summits of peaks identified in MYCWT. Peaks are sorted by peak significance. The line plot (bottom) shows the average read density spanning the 4-kb genomic region. (I) Genomic tracks of MYC and MAX chromatin binding levels by ChIP-Rx and MYC RNA binding levels by eCLIP at the CDK6 promoter. See also Figure S5 and Table S6.
Figure 6
Figure 6
RNA-binding function is important for MYC transcriptional regulation and oncogenic functions (A) Illustration of CRISPR-Display mediated by dCas9. gRNA targeting eGREB1 cognate enhancer was fused to GFP RNA sequences, the full-length eGREB1 sequences, or two copies of the eGREB1 RNA probe used in EMSA. gRNA only served as a control. (B and C) ChIP-qPCR analysis for MYC occupancy at the eGREB1 cognate enhancer and GREB1 promoter sites (B) and quantitative real-time PCR analysis for GREB1 expression (C) in MCF-7 cells with fusion RNAs tethered by dCas9. The bar plot shows the mean and SD (n = 3 technical replicates). (D) Volcano plot of MYC:MAX target gene expression changes (+Dox vs. −Dox, RNA-seq) induced by MYCWT, MYCKRR3A, or MYC7A in U2OS-MYCKO-Tet-On-MYC cells. Blue and orange dots represent the significantly downregulated and upregulated genes, respectively (|log2FC| > 1, p < 0.05). (E and F) Cell-cycle phase distribution by flow cytometry (E) and cell growth rate by 3-(4,5-dimethylthiazol-2-yl)-2,5-diphenyltetrazolium bromide (MTT) assay assay (F) in U2OS-MYCKO-Tet-On-MYC cells induced with 1 μg/mL Dox for 24 h. The line plot shows the means and SDs of biological replicates (n = 4). p values were calculated using an unpaired two-sided t test. (G and H) Cell growth rate by MTT assay (G) and anchorage-independent colony formation assay (H) in MCF-7/shMYC cells stably expressing shRNA-resistant MYCWT, MYCKRR3A, or MYC7A. The line plot shows the means and SDs of biological replicates (n = 6). The boxplot with dots shows the relative number of the colonies of biological replicates (n = 4). A scrambled RNA served as a control (shCtrl). p values were calculated with an unpaired two-sided t test. (I and J) Cell growth rate by MTT assay (I) and anchorage-independent colony formation assay (J) in MCF10A cells stably expressing MYCWT, MYCKRR3A, or MYC7A. The line plot shows the means and SDs of biological replicates (n = 6). The boxplot with dots shows the relative number of the colonies of biological replicates (n = 4). An empty vector served as a control (Ctrl). p values were calculated with an unpaired two-sided t test. ∗p < 0.05; ∗∗p < 0.01; ∗∗∗p < 0.001; ∗∗∗∗p < 0.0001. (K) A model illustrating how MYC-RNA interactions enhance MYC enrichment at active enhancers and promoters, which further recruit MAX and promote transcription, whereas this process is significantly compromised in RNA-binding-deficient MYCKRR3A. See also Figure S6 and Table S7.

Similar articles

Cited by

References

    1. Vita M., Henriksson M. The Myc oncoprotein as a therapeutic target for human cancer. Semin. Cancer Biol. 2006;16:318–330. doi: 10.1016/j.semcancer.2006.07.015. - DOI - PubMed
    1. Beroukhim R., Mermel C.H., Porter D., Wei G., Raychaudhuri S., Donovan J., Barretina J., Boehm J.S., Dobson J., Urashima M., et al. The landscape of somatic copy-number alteration across human cancers. Nature. 2010;463:899–905. doi: 10.1038/nature08822. - DOI - PMC - PubMed
    1. Nesbit C.E., Tersak J.M., Prochownik E.V. MYC oncogenes and human neoplastic disease. Oncogene. 1999;18:3004–3016. doi: 10.1038/sj.onc.1202746. - DOI - PubMed
    1. Dang C.V. MYC on the path to cancer. Cell. 2012;149:22–35. doi: 10.1016/j.cell.2012.03.003. - DOI - PMC - PubMed
    1. Amati B., Dalton S., Brooks M.W., Littlewood T.D., Evan G.I., Land H. Transcriptional activation by the human c-Myc oncoprotein in yeast requires interaction with Max. Nature. 1992;359:423–426. doi: 10.1038/359423a0. - DOI - PubMed

LinkOut - more resources