. 2025 Jul;301(7):110233.
doi: 10.1016/j.jbc.2025.110233. Epub 2025 May 14.

Modulation of cyanobacterial Photosystem I protein environment and spectral capacity in response to changes in electron flow pathways and photon flux

Affiliations

Modulation of cyanobacterial Photosystem I protein environment and spectral capacity in response to changes in electron flow pathways and photon flux

Sharon L Smolinski et al. J Biol Chem. 2025 Jul.

Abstract

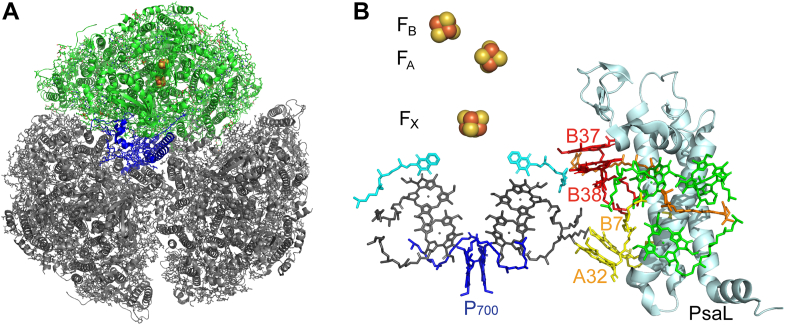
Cyanobacterial photosystem I (PSI) can undergo modifications that adjust photosynthetic electron transport in response to fluctuations in environmental and cellular conditions. We recently reported that PSI isolated from Synechocystis sp. PCC 6803 (S. 6803) strains lacking a peripheral oxygen reduction reaction (ORR1) pathway demonstrated altered P700 photooxidation capacity, changes in spectral properties, and a higher proportion of monomers. These changes in PSI were augmented when cells were grown under higher photon flux, which creates a greater energy imbalance at PSI. We have shown that the modified PSI is functional in photochemical charge separation and ferredoxin reduction reactions. Thus, we hypothesized that monomerization of PSI was caused by changes in the environment of PsaL, which is known to be essential for stabilizing trimers. To test our hypothesis, we isolated PSI monomers and trimers from ORR1 and wild-type (WT) strains. The electron paramagnetic resonance (EPR) spectra of reduced PSI demonstrated the presence of intact FA and FB [4Fe-4S] clusters, consistent with measurements of functional charge separation and electron transport. Limited proteolysis followed by mass spectrometric analysis showed altered accessibility of PsaL in the ORRI PSI monomers compared to WT monomers, and included regions associated with chlorophyll and carotenoid binding, and in functional interactions with adjacent subunits. In addition, ORR1 PSI monomers had spectral changes compared to WT PSI due to differences in carotenoid compositions. Collectively, these findings reveal new insights into how microbes adjust PSI structure and photochemistry to mitigate photodamage in response to changes in electron utilization by downstream chemical reactions.

Keywords: carotenoid; chlorophyll; cyanobacteria; oligomeric composition; photosynthesis; photosystem I.


Conflict of interest statement

Conflict of interest The authors declare that they have no conflicts of interest with the contents of this article.

Figures

Figure 1
Figure 1
Location of PsaL within the PSI complex. A, PsaL (in blue) in relation to PSI trimeric structure as viewed from the stromal surface (one monomeric unit in green, two monomeric units in grey), based on PDB 5OY0, the structure of WT Synechocystis sp. PCC 6803 trimer (11). B, PsaL (light cyan) in relation to nearby chls (green), red chl pairs B37/B38 (red) and A32/B7 (yellow), and β-carotenes (orange). PsaL is also shown in relation to the electron transfer chain, P700 (blue), chlorophylls (gray), phylloquinones (light blue), and iron-sulfur clusters (yellow and orange spheres). Stromal side is at the top. Based on PDB 5OY0, the structure of WT Synechocystis sp. PCC 6803 trimer (11), and red chls identified in (13, 22). Features depicted in B are specified in Table S1.
Figure 2
Figure 2
CW EPR spectra of PSI monomers and trimers. EPR analysis of PSI monomers (teal) or trimers (pink) isolated from the ORR1 strain grown under FL conditions. Samples were frozen under room light conditions after chemical reduction using 5 mM sodium dithionite. The characteristic interaction spectrum of reduced FA/FB in PSI complexes is observed with features at g = 2.05, 1.94, 1.92, and 1.88. An asterisk denotes the P700 radical. Wing features at g ∼1.85 and 2.07 indicate a small (5–10%) contribution to the signal from either reduced FA or FB alone. Data collected at 15 K and 1 mW of power. Sample chlorophyll concentration at 1.1 mg/ml (trimers) or 2.02 mg/ml (monomers).
Figure 3
Figure 3
Regions of PsaL detected by mass spectrometric analysis following limited proteolysis. Observed peptides are mapped onto the structure of S. 6803 WT PsaL from PDB 5OY0 (11). A, potential pepsin cleavage sites shown in green (see list in Table S2). PsaL regions detected following proteolysis are in magenta (panels B and C). B, WT PSI trimers (ALA28–VAL53), (C) WT PSI monomers (ILE62–LEU90), and (D) ORR1 PSI monomers (TYR40–LEU90 and ALA92–LEU155) from corresponding strains grown in FL. PsaL is oriented with the stromal side on top, as viewed from PsaA and PsaB.
Figure 4
Figure 4
Regions of PsaL detected following limited proteolysis of PSI monomers and trimers. Data are mapped onto the trimeric structure of S. 6803 WT PSI from PDB 5OY0 (11). for data collected from PSI trimers and PSI monomer samples. Accessible residues observed for PsaL from (A) WT PSI trimer, (B) WT PSI monomer, and (C) ORR1 PSI monomer cultured under FL. PsaL is in cyan and detected peptides in magenta. For clarity a monomeric unit is shown in green. The figures are rendered to depict the physical relation of the monomer with respect to the trimer (gray). Magnified PsaL subunits; (D) WT PSI trimer, (E) WT PSI monomer, and (F) ORR1 PSI monomer. A single PsaL subunit representing the PSI monomeric structure is color-coded in cyan with the detected peptides in magenta. The two additional PsaL in gray correspond to neighboring monomeric units in trimeric form.
Figure 5
Figure 5
Maps of the PsaL accessibility regions to the chlorophyll and β-carotene binding regions of PsaL in the Synechocystis PSI trimer structure. PSI pigments from the S. 6803 PSI trimer structure PDB 5OY0 (11) are shown overlaying the accessibility regions of PsaL (magenta) in ORR1 PSI trimers. A, stromal side on top and (B) stromal side looking toward the lumenal side. PsaL in light cyan with detected regions of PsaL in magenta, three chls (green), two β-carotenes (orange), red chl pairs B37/B38 (red), and A32/B7 (yellow).
Figure 6
Figure 6
The detection of residues within 5 Å of PsaL in ORR1 PSI monomer compared to WT monomer. Residues that were not detected in ORR1 PSI monomer but are detected in WT monomer are shown in magenta. Residues detected in ORR1 PSI monomer but not detected in WT monomer are shown in green. Data are based on mass spectrometric analysis following proteolytic digestion and mapped onto a monomeric unit based on the structure of S. 6803 WT PsaL from PDB 5OY0 (11). PsaL is shown in blue and iron-sulfur clusters in orange. PSI is shown with the stromal side on top.
Figure 7
Figure 7
The detection of residues within 5 Å of PsaL in ORR1 PSI trimer compared to WT trimer. Residues within the PsaL interaction sphere that were not detected in ORR1 PSI trimer compared to WT trimer are shown in magenta, located on the lumenal side. Data are based on mass spectrometric analysis following proteolytic digestion, and mapped onto the trimeric structure of S. 6803 WT PsaL from PDB 5OY0 (11). PsaL in blue and iron-sulfur clusters in yellow. PSI is shown with the stromal side on top.
Figure 8
Figure 8
The percentage of undetected residues in the PsaL interaction sphere shown as grouped comparisons by A) strains and PSI oligomeric form, and B) PSI subunit. WT and ORR1 PSI trimers and monomers were isolated from cells grown under FL conditions, and the PsaL interaction sphere was mapped based on mass spectrometric analysis following proteolytic digestion and compared to the structure of S. 6803 WT PsaL from PDB 5OY0 (11).
Figure 9
Figure 9
UV-VIS absorption spectra of PSI isolated from WT and ORR1 cells grown under GL and FL. PSI trimers over (A) 400 to 450 nm, and (B) 450 to 500 nm. PSI monomers (also containing PSII) over (C) 400 to 450 nm, and (D) 450 to 500 nm. ORR1 PSI trimers, and ORR1 PSI monomers (with PSII) show increased absorbance from 400 to 440 nm and 460 nm to 500 nm. Data were normalized to the peak for chl a, at 676 nm to 678 nm. Data are the average of biological triplicates.
Figure 10
Figure 10
Analytical measurements of carotenoid levels in PSI samples. The abundance of (A) echinenone and (B) zeaxanthin in pigments extracted from samples of isolated PSI trimers and monomers from WT (black) and ORR1 (red) cells grown under GL (solid) and FL (pattern). Data are based on absorbance at 460 nm for echinenone and 450 nm for zeaxanthin and quantified as the number of molecules per 100 chla molecules. Data are the average of biological triplicates, with the exception of ORR1 FL trimer for echinenone and zeaxanthin which have two biological replicates to exclude outlier values, with error bars showing standard deviation.

Similar articles

References

    1. Ducat D.C., Avelar-Rivas J.A., Way J.C., Silver P.A. Rerouting carbon flux to enhance photosynthetic productivity. Appl. Environ. Microbiol. 2012;78:2660–2668. - PMC - PubMed
    1. Lindblad P., Fuente D., Borbe F., Cicchi B., Conejero J.A., Couto N., et al. CyanoFactory, a European consortium to develop technologies needed to advance cyanobacteria as chassis for production of chemicals and fuels. Algal Res. 2019;41
    1. Lupacchini S., Appel J., Stauder R., Bolay P., Klähn S., Lettau E., et al. Rewiring cyanobacterial photosynthesis by the implementation of an oxygen-tolerant hydrogenase. Metab. Eng. 2021;68:199–209. - PubMed
    1. Song X., Diao J., Yao J., Cui J., Sun T., Chen L., et al. Engineering a central carbon metabolism pathway to increase the intracellular acetyl-CoA pool in Synechocystis sp. PCC 6803 grown under photomixotrophic conditions. ACS Synth. Biol. 2021;10:836–846. - PubMed
    1. Stephens S., Mahadevan R., Allen D.G. Engineering photosynthetic bioprocesses for sustainable chemical production: a review. Front. Bioeng. Biotechnol. 2021;8:610723. - PMC - PubMed

MeSH terms

Substances

LinkOut - more resources