Randomized Controlled Trial
. 2025 May 15;10(5):e017672.
doi: 10.1136/bmjgh-2024-017672.

Development of personal air pollution exposure report-back materials to Household Air Pollution Intervention Network (HAPIN) trial participants in Guatemala and Rwanda: a qualitative study

Collaborators, Affiliations
Randomized Controlled Trial

Development of personal air pollution exposure report-back materials to Household Air Pollution Intervention Network (HAPIN) trial participants in Guatemala and Rwanda: a qualitative study

Ashlinn Quinn et al. BMJ Glob Health. .

Abstract

Background: Report-back of individual exposure information to research participants is recognised in high-income countries as an important, yet often overlooked, component of environmental research, with many potential benefits to study communities. Nonetheless, the optimal means of communicating findings to participants in low-income countries with limited health and scientific literacy is unknown.

Methods: Between March 2021 and May 2022, we conducted a qualitative study with 61 women and 20 of their household members (n=81) participating in the Household Air Pollution Intervention Network trial in Guatemala and Rwanda. Using participant observations and individual interviews (n=61), group interviews (n=21), dynamic working groups (n=78) and focus groups (n=45), we collaborated with study participants to iteratively develop contextually appropriate and comprehensible materials that conveyed individual air pollution exposures.

Results: Posters were generated to display graphical representations of participants' personal air pollution exposures, along with the known health effects of air pollution exposure and actions that could be taken to reduce their exposures to household air pollution.

Discussion: This is the first study to report back personal household air pollution exposure results to study participants in two low-income countries where people rely on biomass fuel (eg, wood, crop waste, dung) for cooking. We used community-engaged methods to co-produce locally and contextually specific materials.

Trial registration number: NCT02944682.

Keywords: Global Health; Pneumonia; Qualitative study.


Conflict of interest statement

Competing interests: None declared.

Figures
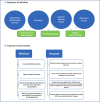
Figure 1
Figure 1. Overview of qualitative methods.
Figure 2
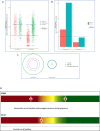
Figure 2. Examples of graphical displays of PM2.5 exposure data presented to dynamic working groups. Script read to participants, “These are displays of results from the Household Air Pollution Intervention Network study. The displays show the amount, or level, of particulate matter you were exposed to during the study. Particulate matter is a component of smoke and it is measured in terms of its mass, or weight, per certain amount of air. In this case, we measure it in terms of micrograms of PM per thousand litres of air. A grain of sand weighs about 10 µg. (a) The solid blue line represents measurements made on you during the study. You can compare your levels to other people in the study. Each square/dot on the chart represents a measurement made on another participant in Guatemala/Rwanda. Red dots are households that used a gas stove as part of the study. Green dots are households that used traditional stoves as part of the study. During the pre-intervention period, all households used traditional stoves. The solid black line is the recommended guideline exposure level established by the WHO during the study. The blue bars represent the study-wide average value for households like yours. (b) The red bars represent findings from measurements made on you. The solid black line is the recommended guideline exposure level established by the WHO. (c) The red circle represents the exposure level of your household. The green circle represents the study-wide average among households in your group (control vs intervention). The blue circle is the recommended guideline exposure level established by the WHO. The size of the red circle is your relative exposure on measurement days during this study.” (d) The final ‘thermometer’ graphical display used to depict PM2.5 exposure. Red colour at the left of the scale indicates less desirable exposure levels, while the green colour at the right indicates a cleaner or more desirable exposure level. Individual exposure is shown via the ‘open fire’ marker (for exposure before liquefied petroleum gas (LPG) intervention in the case of intervention households and for baseline exposure in the case of control households), and via the ‘gas cylinder’ marker (for exposure after LPG intervention in the case of intervention households).
Figure 3
Figure 3. Artistic adaptations of household observations in Guatemala (a) and Rwanda (b). The left side of each panel is a photograph taken during household observation, while the right side is an early iteration of an artistic adaptation based on the photograph and desired messages. The person depicted in the photo is not a patient. She is a research participant, and she signed an informed consent to allow for the photograph to be taken.
Figure 4
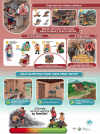
Figure 4. Report-back poster, Guatemala. Messages about the health effects of air pollution exposure and actions that can reduce exposure are shown. The participant-specific thermometer visual to depict individual PM2.5 exposure results would be included at the bottom.

References

    1. Ramirez-Andreotta MD, Brody JG, Lothrop N, et al. Improving Environmental Health Literacy and Justice through Environmental Exposure Results Communication. Int J Environ Res Public Health. 2016;13:690. doi: 10.3390/ijerph13070690. - DOI - PMC - PubMed
    1. Brody JG, Dunagan SC, Morello-Frosch R, et al. Reporting individual results for biomonitoring and environmental exposures: lessons learned from environmental communication case studies. Environ Health. 2014;13:40. doi: 10.1186/1476-069X-13-40. - DOI - PMC - PubMed
    1. National Academies of Sciences, Engineering, and Medicine, Board on Health Sciences Policy, Health and Medicine Division . Returning individual research results to participants: Guidance for a new research paradigm. Washington, D.C: National Academies Press; 2018. - PubMed
    1. Wolf SM, Green RC. Return of Results in Genomic Research Using Large-Scale or Whole Genome Sequencing: Toward a New Normal. Annu Rev Genomics Hum Genet. 2023;24:393–414. doi: 10.1146/annurev-genom-101122-103209. - DOI - PMC - PubMed
    1. Mash C, McAllister KA, Wonnum S, et al. Principles and practices of returning individual research results to participants in large studies of pregnancy and childhood. Am J Epidemiol. 2025;194:830–6. doi: 10.1093/aje/kwae228. - DOI - PubMed

Publication types

Associated data