. 2025 Jun 3;12(6):ENEURO.0233-24.2025.
doi: 10.1523/ENEURO.0233-24.2025. Print 2025 Jun.

AxoDen: An Algorithm for the Automated Quantification of Axonal Density in Defined Brain Regions

Affiliations

AxoDen: An Algorithm for the Automated Quantification of Axonal Density in Defined Brain Regions

Raquel Adaia Sandoval Ortega et al. eNeuro. .

Abstract

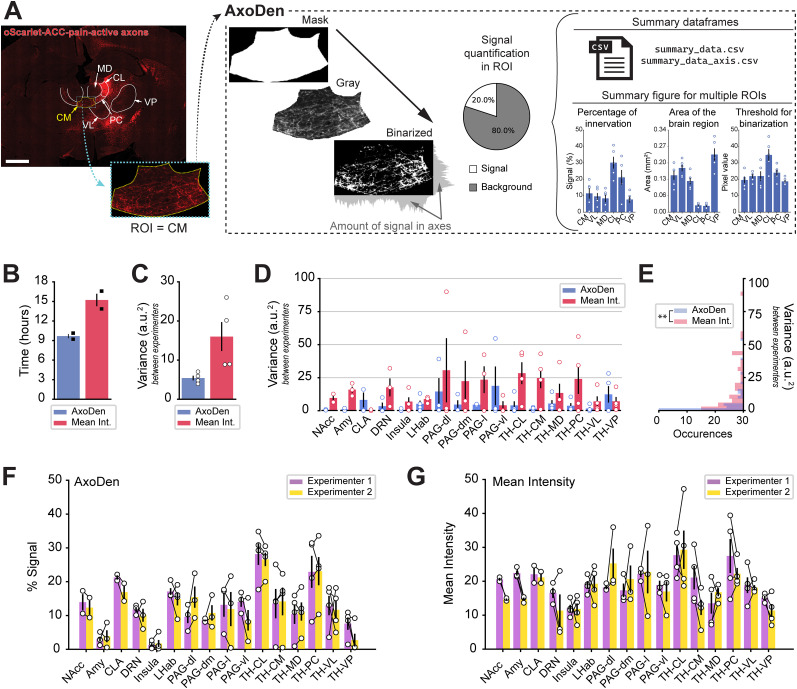
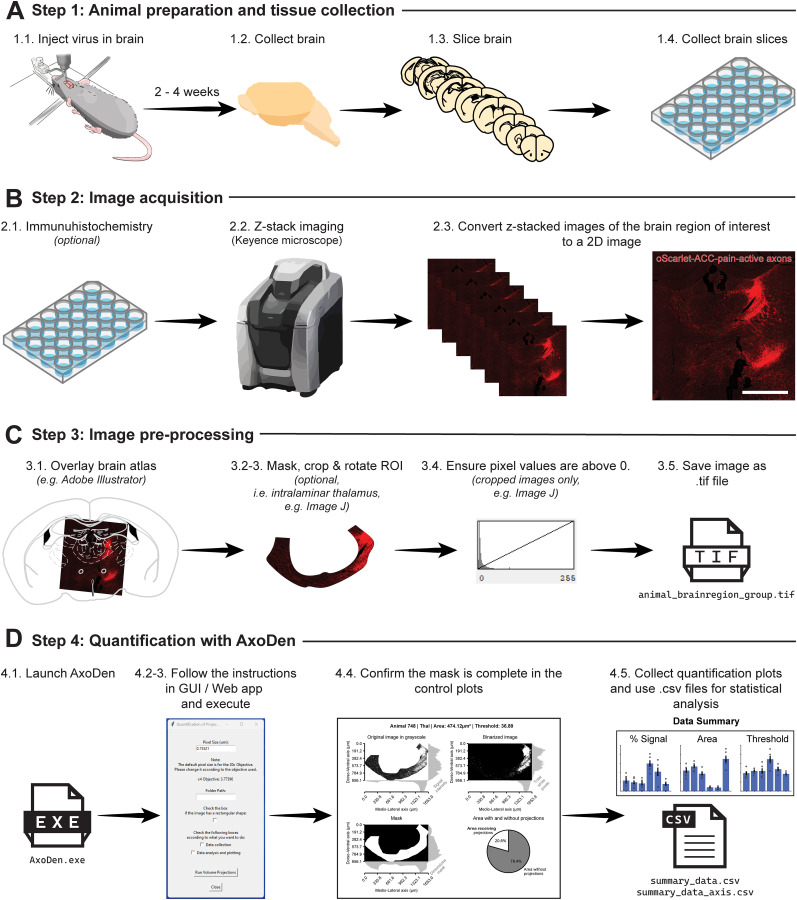
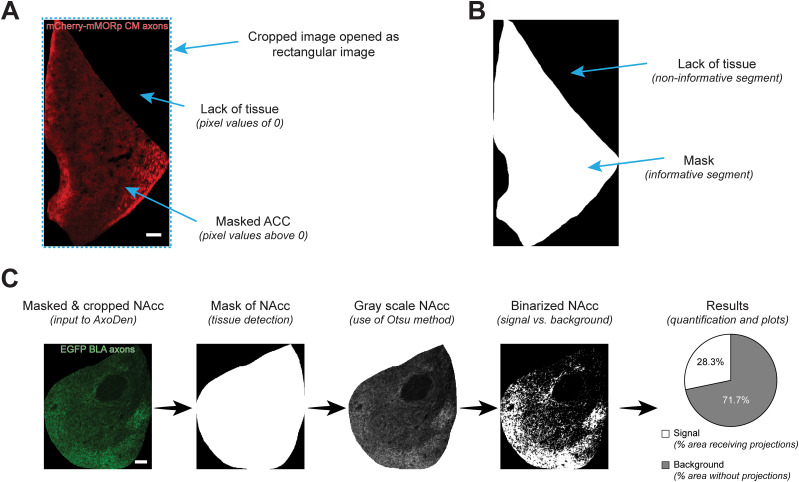
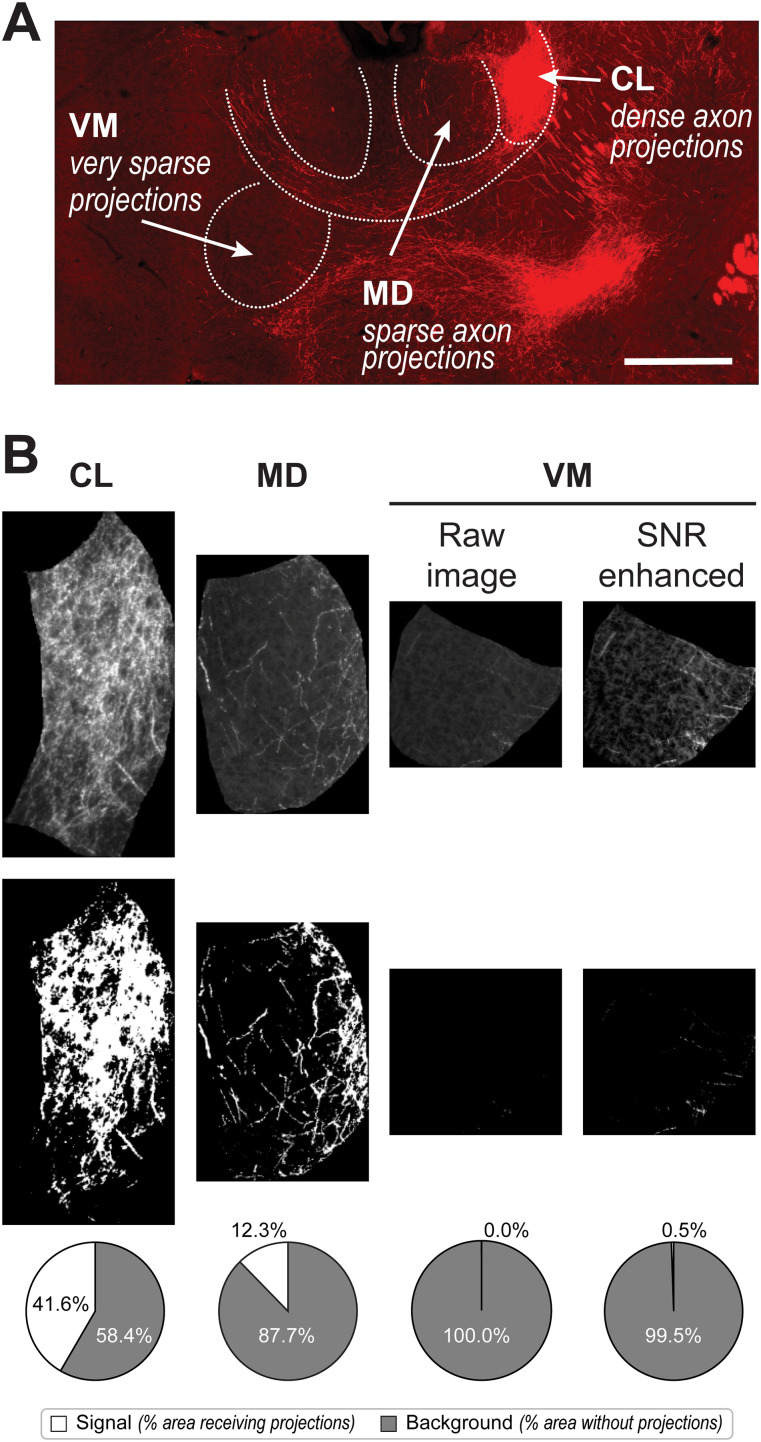
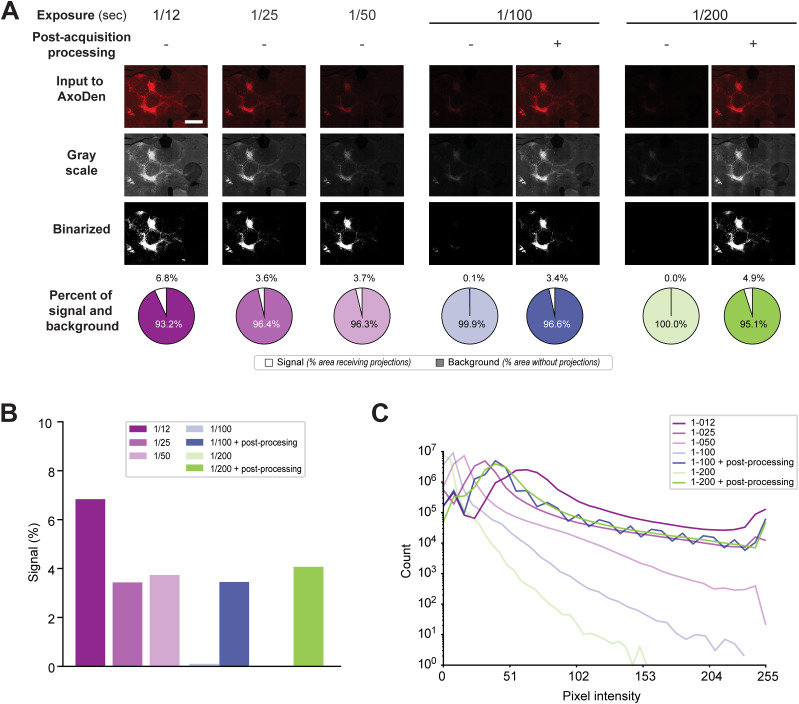
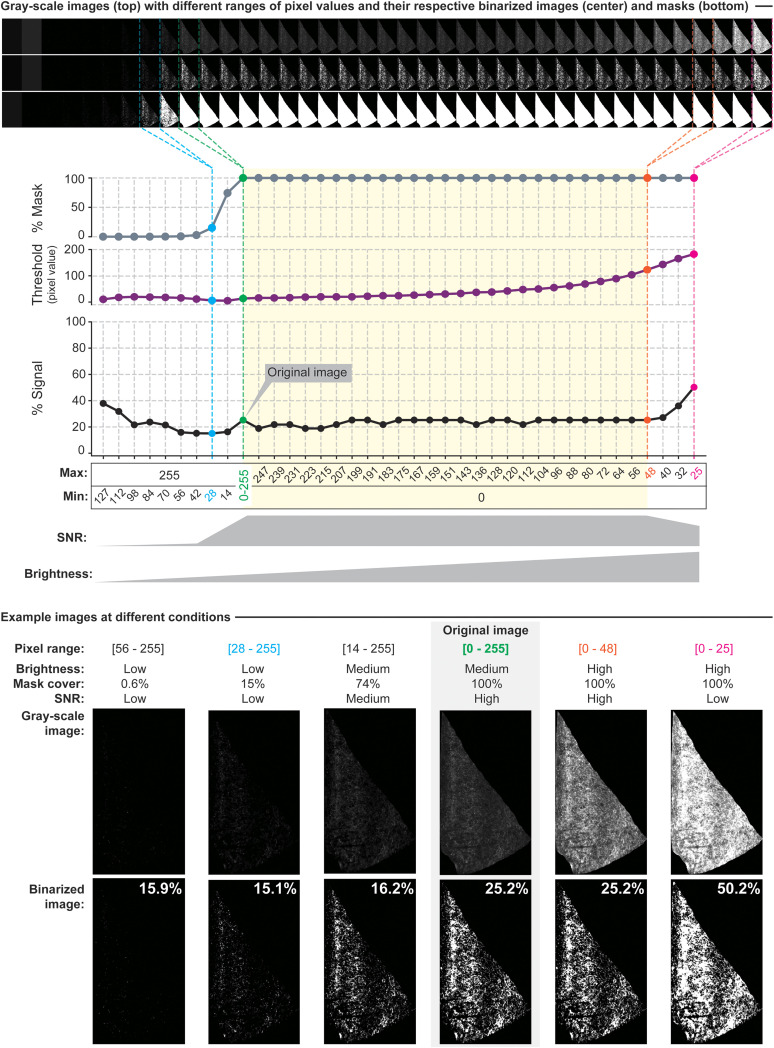
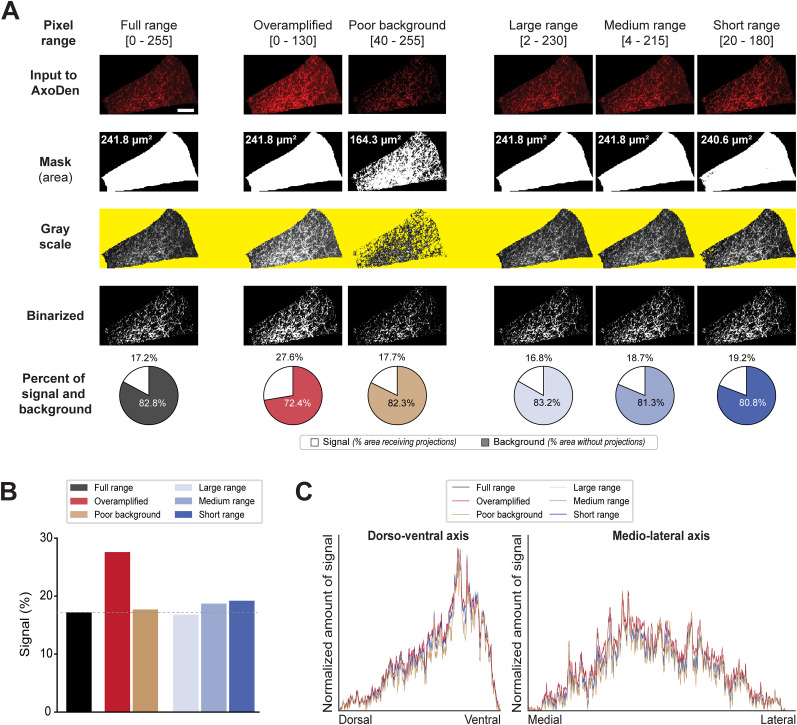
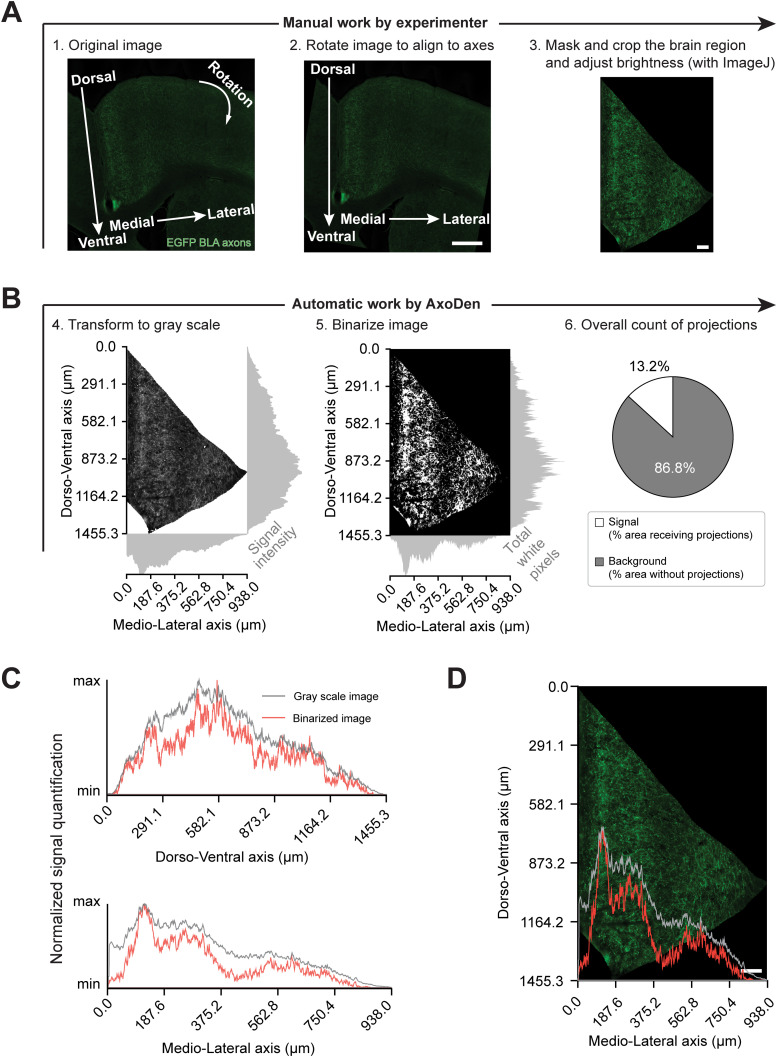
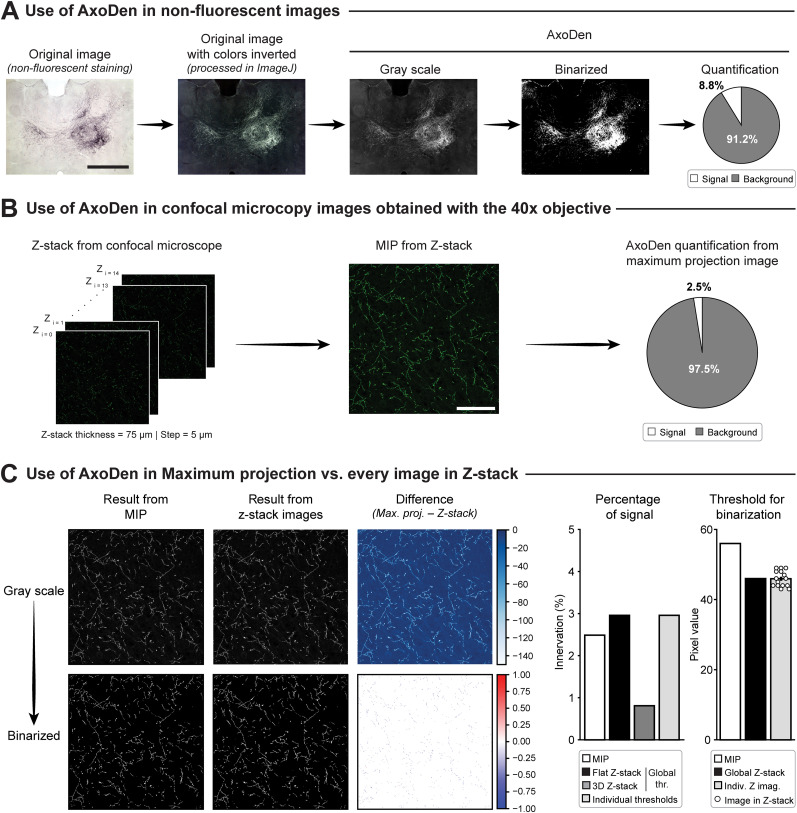
The rodent brain contains 70,000,000+ neurons interconnected via complex axonal circuits with varying architectures. Neural pathologies are often associated with anatomical changes in these axonal projections and synaptic connections. Notably, axonal density variations of local and long-range projections increase or decrease as a function of the strengthening or weakening, respectively, of the information flow between brain regions. Traditionally, histological quantification of axonal inputs relied on assessing the fluorescence intensity in the brain region of interest. Despite yielding valuable insights, this conventional method is notably susceptible to background fluorescence, postacquisition adjustments, and inter-researcher variability. Additionally, it fails to account for nonuniform innervation across brain regions, thus overlooking critical data such as innervation percentages and axonal distribution patterns. In response to these challenges, we introduce AxoDen, an open-source semiautomated platform designed to increase the speed and rigor of axon quantifications for basic neuroscience discovery. AxoDen processes user-defined brain regions of interests incorporating dynamic thresholding of grayscale-transformed images to facilitate binarized pixel measurements. Here, in mice, we show that AxoDen segregates the image content into signal and nonsignal categories, effectively eliminating background interference and enabling the exclusive measurement of fluorescence from axonal projections. AxoDen provides detailed and accurate representations of axonal density and spatial distribution. AxoDen's advanced yet user-friendly platform enhances the reliability and efficiency of axonal density analysis and facilitates access to unbiased high-quality data analysis with no technical background or coding experience required. AxoDen is ad libitum available to everyone as a valuable neuroscience tool for dissecting axonal innervation patterns in precisely defined brain regions.

Keywords: axon; imaging; microscopy; neuron; open-source; toolbox.


Conflict of interest statement

The authors declare no competing financial interests.

Figures

Figure 1.
Figure 1.
AxoDen overview and comparison to mean intensity method. A, Overview of AxoDen steps and outcome using example oScarlet-ACC-pain-active axons projecting to midline thalamic nuclei. Scale bar, 1 mm. B, Time needed to collect the data for AxoDen and mean intensity. Each black square represents one experimenter. C, Overall variance between researchers for AxoDen and mean intensity. D, Variance between experimenters when using AxoDen and mean intensity for multiple brain regions. E, Distribution of the variance between researchers for each method. Mann–Whitney U test revealed AxoDen has an overall lower variance than mean intensity. **p < 0.001. F, Percentage of signal in different ROIs indicating the percentage of the ROI receiving axonal projections for each experimenter using AxoDen. G, Mean fluorescence intensity values collected for each brain area by different experimenters. A, CG Each dot represents one animal. All values are mean ± SEM. ACC, anterior cingulate cortex; Amy, amygdala; CL, centrolateral nucleus; CLA, claustrum; CM, centromedial nucleus; dl, dorsolateral; dm, dorsomedial; DRN, dorsal raphe nucleus; l, lateral; LHab, lateral habenula; MD, mediodorsal nucleus; NAcc, nucleus accumbens; PAG, periaqueductal gray; PC, paracentral nucleus; PV, paraventricular nucleus; ROI, region of interest; TH, thalamus; vl, ventrolateral; VL, ventrolateral nucleus; VP, ventroposterior nucleus.
Figure 2.
Figure 2.
Experimental workflow for anatomical analysis of axonal projections in the intralaminar thalamus. A, Steps for animal preparation and tissue collection. B, Steps for image acquisition. Scale bar, 1 mm. C, Steps for image preprocessing. D, Steps for axonal quantification with AxoDen and its outputs.
Figure 3.
Figure 3.
AxoDen workflow with masked and cropped images. A, Components of a masked and cropped image of the ACC receiving CM axons positive for mu opioid receptors labeled with mCherry. B, Illustration of the detected mask by AxoDen from the masked and cropped ACC image. C, AxoDen workflow for an image of the masked and cropped nucleus accumbens (NAcc) with projections labeled with GFP. All scale bars, 100 µm.
Figure 4.
Figure 4.
Adjustment of pixel range. A, Example image of oScarlet-labeled projections from the ACC to the thalamus. Three thalamic nuclei receiving strong, weak, and very weak projections are identified. The intensity of the image has been increased for visualization purposes. Scale bar, 1 mm. B, Cropped brain regions in gray scale (top row), after binarization (middle row) and the quantification of signal versus background by AxoDen (bottom row).
Figure 5.
Figure 5.
The effect of exposure time during acquisition. A, Series of images of oScarlet-labeled projections from the ACC to the thalamus acquired at different exposure times, with (+) or without (−) postacquisition image processing, and their transformations and quantification of signal by the AxoDen algorithm. Scale bar, 1 mm. B, Comparison of the percentage of innervation measured for each acquisition time. C, Histograms of the pixel intensity values for each acquired image.
Figure 6.
Figure 6.
Evaluation of the robustness of AxoDen on equally spaced brightness settings. Using an example image of BLA axons projecting to ACC, the pixel range was clipped either on the low values on 10 equally spaced steps from 127–255 to 0–255 or on the high values on 20 equally spaced steps from 0–25 to 0–255. After clipping the pixel range, this was normalized to 0–255 before feeding the images to AxoDen. Clipping of low pixel values disrupted the detection of the area with tissue, generating incomplete masks that resulted in spurious quantification of signal. Once the mask covered 100% of the tissue sample, increases in brightness did not significantly alter the quantification of signal thanks to the dynamic threshold, which increased with increasing brightness. Extreme increases of brightness disrupted SNR generating unreliable results.
Figure 7.
Figure 7.
Effect of pixel ranges on the signal detection capabilities of AxoDen. A, Series of images of oScarlet-labeled projections from ACC to PAG-vl with different pixel ranges and their transformations by the AxoDen algorithm. The yellow band on the grayscale row is used to visualize the transparency of the grayscale images caused by an incomplete mask. Scale bar, 100 µm. B, The overall percentage of signal for each condition. The dotted line is used as a reference for the signal percentage computed for the full range image. C, Normalized intensity to the maximum value of the distribution for dorsoventral and mediolateral axes.
Figure 8.
Figure 8.
Spatial distribution of projections along the x and y axes in the ACC. A, Manual steps users need to follow to first rotate (A1-2) an image to align the dorsoventral and the mediolateral axes to the y and x axis and then mask and crop the region of interest (A3). Scale bar (Step 2), 500 µm. Scale bar (Step 3), 100 µm. B, Automatic AxoDen steps where the signal intensity is measured along the axes in grayscale images (B4), and the total of white pixels in the binarized images (B5). Lastly, the percentage of white pixels, referred to as “% area receiving projections” is computed independently of the axis (B6). C, Amount of signal normalized to the maximum value of the distribution along the dorsoventral and the mediolateral axes comparing the values obtained from grayscale and binarized images. D, Overlay of the signal intensity on the mediolateral axis with the cropped image to visually show that the quantification along the axis of binary images better follows the axonal distribution compared with the quantification of signal intensity from grayscale images. Scale bar, 100 µm.
Figure 9.
Figure 9.
Use of AxoDen in nonfluorescent images and confocal micrographs. A, Example of the processing and AxoDen quantification of a nonfluorescent image. Scale bar, 1 mm. B, Example of the use of AxoDen in a confocal image acquired with the 40× objective. Scale bar, 100 µm. C, Comparison of the results provided by AxoDen when processing the MIP image or each single image of the Z-stack. Left, Images in gray scale and binarized resulting from the maximum projection obtained by the microscope software, the Z-stack images, and the difference between MIP and the Z-stack in 2D. Right, Bar plots showing the percentage of innervation of the area and the threshold obtained to apply the binarization step.

Similar articles

Cited by

References

    1. Beyeler A, Namburi P, Glober GF, Simonnet C, Calhoon GG, Conyers GF, Luck R, Wildes CP, Tye KM (2016) Divergent routing of positive and negative information from the amygdala during memory retrieval. Neuron 90:348–361. 10.1016/J.NEURON.2016.03.004 - DOI - PMC - PubMed
    1. Cardullo RA, Hinchcliffe EH (2013) Post-processing for statistical image analysis in light microscopy. Methods Cell Biol 114:285–315. 10.1016/B978-0-12-407761-4.00012-9 - DOI - PubMed
    1. Cromey DW (2010) Avoiding twisted pixels: ethical guidelines for the appropriate use and manipulation of scientific digital images. Sci Eng Ethics 16:639. 10.1007/S11948-010-9201-Y - DOI - PMC - PubMed
    1. Fillinger C, Yalcin I, Barrot M, Veinante P (2018) Efferents of anterior cingulate areas 24a and 24b and midcingulate areas 24a’ and 24b’ in the mouse. Brain Struct Funct 223:1747–1778. 10.1007/S00429-017-1585-X - DOI - PubMed
    1. Friedmann D, Pun A, Lui JH, Kebschull JM, Grutzner SM, Castagnola C, Tessier-Lavigne M, Luo L (2019) Mapping mesoscale axonal projections in the mouse brain using a 3D convolutional network. Proc Natl Acad Sci U S A 117:11068–11075. 10.1073/pnas.1918465117 - DOI - PMC - PubMed

LinkOut - more resources