. 2025 May 16;16(1):392.
doi: 10.1038/s41419-025-07717-7.

Application of imaging mass cytometry for spatially profiling the microenvironment of salivary glands in primary Sjögren's syndrome

Affiliations

Application of imaging mass cytometry for spatially profiling the microenvironment of salivary glands in primary Sjögren's syndrome

Guolin Wu et al. Cell Death Dis. .

Abstract

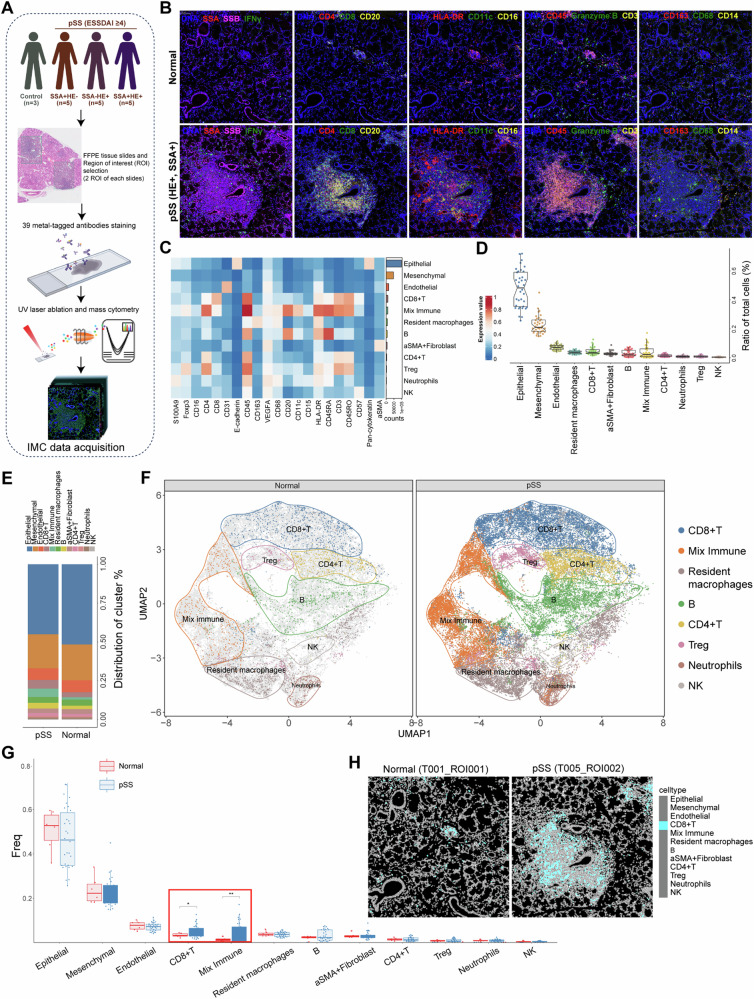
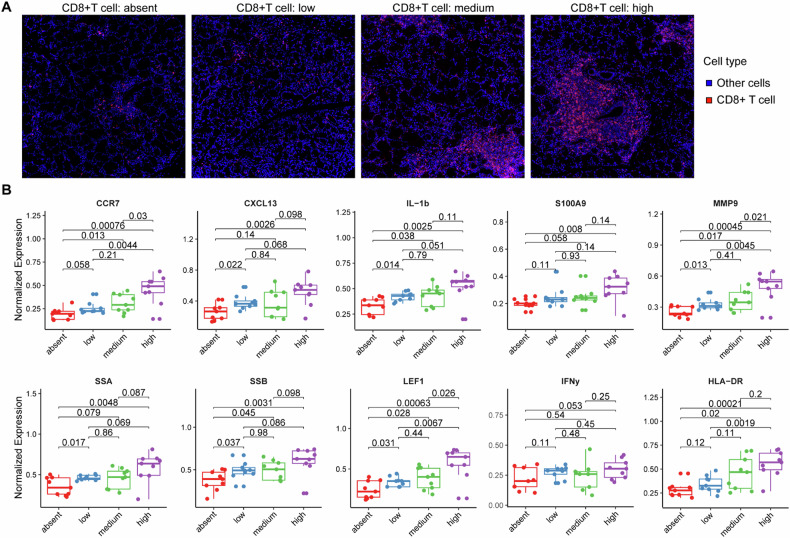
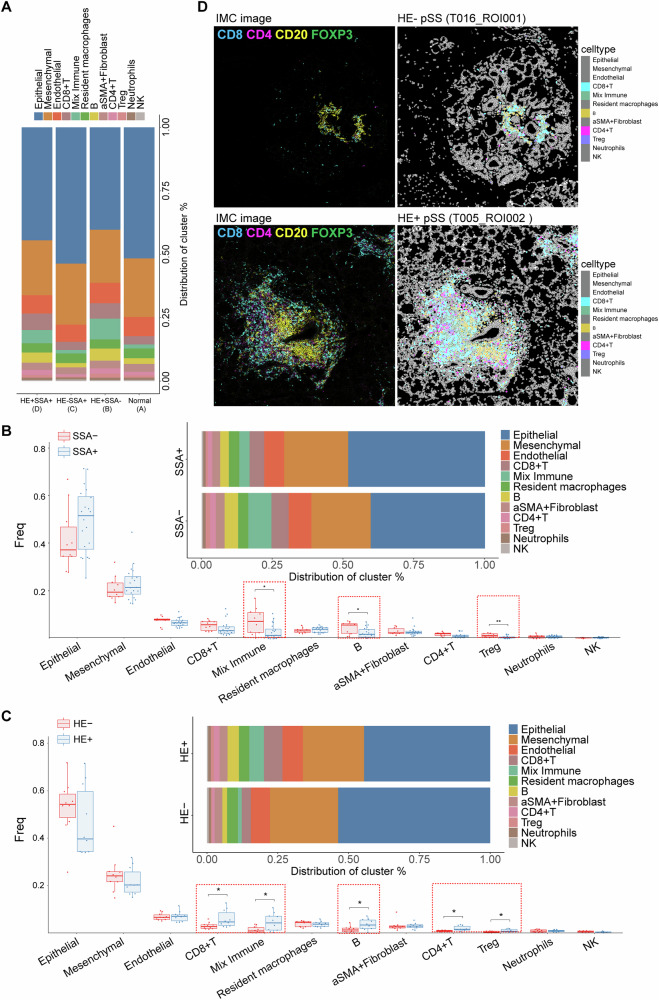
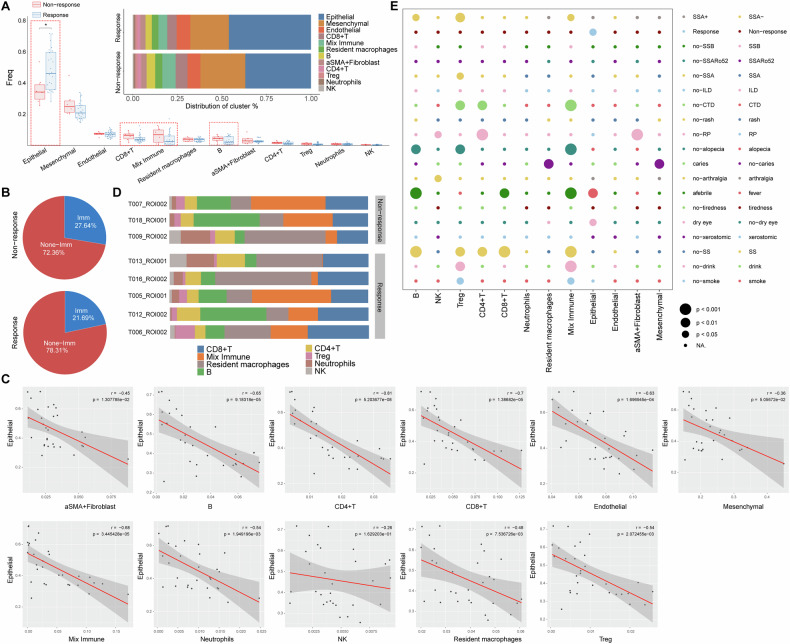
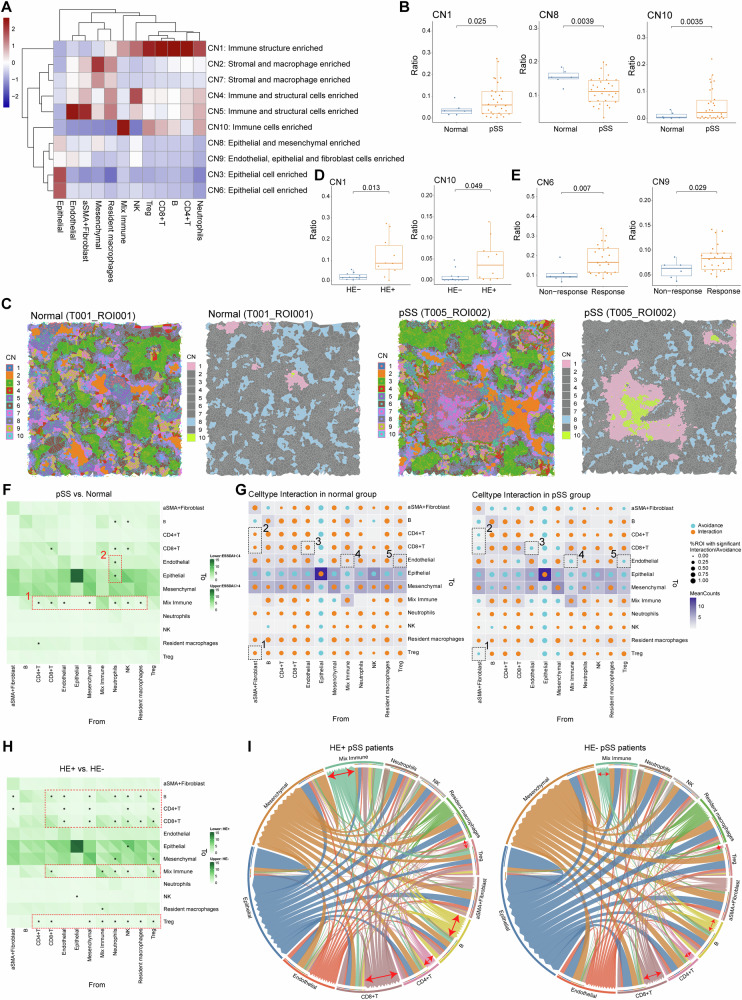
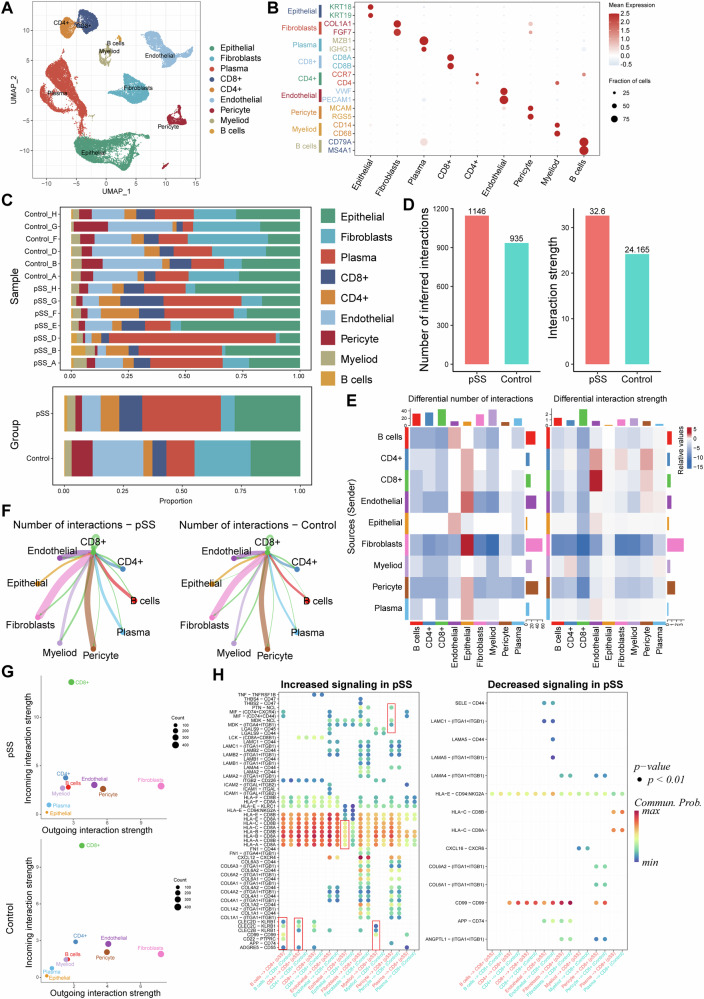
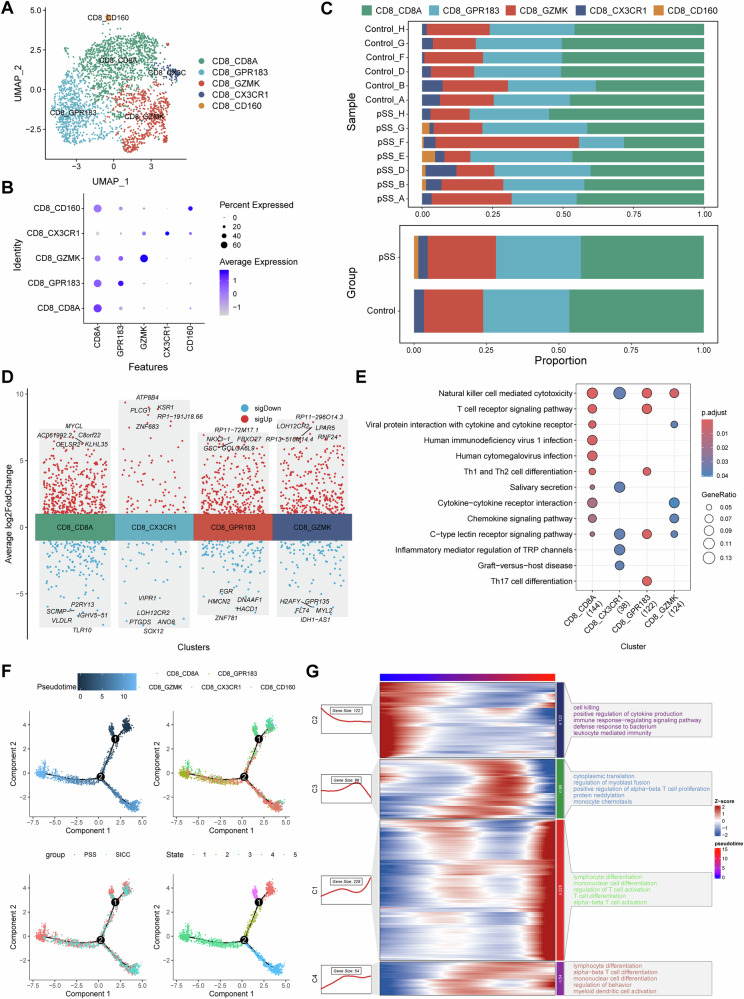
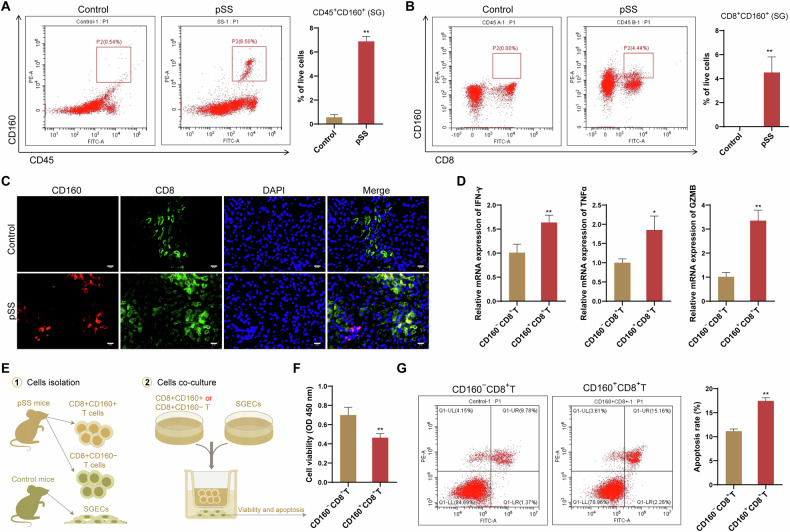
Primary Sjogren's syndrome (pSS) is a slowly progressive, systemic autoimmune disorder characterized by gradual lymphocytic infiltration of exocrine glands. However, the spatially profiling the immune microenvironment in pSS is largely unclear, limiting the understanding of the complex interplay among cells within the microenvironment. Based on imaging mass cytometry (IMC) analysis of clinical pSS samples, we first revealed that labial salivary gland (LSG) comprised of epithelial, immune cells and stromal cells, and epithelial was the main cell type in LSG. Eight immune cells populations were identified, including CD8+ T, CD4+ T, Treg, B, NK cells, neutrophils, resident macrophages and a mixed immune cell cluster. We found that CD8+ T cells, but not CD4+ T cells, were the most prominent T cells in immune infiltrates of pSS LSG. With the increase of pSS disease activity and severity, the infiltration abundance of CD8+ T cells gradually increased and was accompanied by the activation of inflammatory response. sc-RNA-seq analysis based on the GSE272409 dataset confirmed that CD8+ T cells were the main immune cells, and dominated the most intercellular ligand-receptor interactions. CD8+ T cells were further clustered into five cell subsets, of which CD160+CD8+ T cells subset appeared to present only in pSS patients. Further experiments demonstrated that CD160 expression on CD8+ T cells was associated with an enhanced expression of proinflammatory and cytotoxic cytokines IFN-γ, GZMB and TNF-α, and the injury of salivary gland epithelial cells. Besides, proportion of GZMK+CD8+ T cells subset was increased in pSS patients. Trajectory analysis confirmed an enhanced frequency of CD8+ T cell differentiation and activation during the progression of pSS. This study provided single cell profile with spatial information for analyzing the LSG immune microenvironment in pSS, which could not be achieved by conventional immunofluorescence and immunohistochemistry assays.


Conflict of interest statement

Competing interests: The authors declare no competing interests. Ethical approval: For all the patients, written informed consents were obtained, and the protocol was approved by the Ethics Committee of the first affiliated hospital of Zhejiang University School of Medicine (IIT20240145B). Besides, whole animal experiments were supported by the Animal Experimental Ethics Committee of Yangzhou University (Ethics No. 202504019), which were conducted in accordance with ARRIVE guidelines.

Figures

Fig. 1
Fig. 1. Characterization of the pSS microenvironment.
A The study design of this imaging mass cytometry study. We performed imaging mass cytometry (IMC) analysis using a 39-antibody panel on 36 regions of interest of labial salivary gland biopsy samples across 15 pSS patients and 3 controls. After preprocessing and cell segmentation, IMC data was acquired for downstream analyses; B Multiplexed images showing the staining of cellular markers (pSS pathological markers and major lymphocyte markers) in labial salivary gland samples from normal control and pSS patients; C Heatmap demonstrating the expression of cellular markers in each cell population; D Boxplots showing the ratio of each cell type of the total cells in all samples; E Histogram demonstrating the differences on cell proportion in normal control and pSS patients; F the UMAP clustering of immune cells in normal control and pSS patients; G Comparisons on the cells frequency between normal control and pSS patients, *P < 0.05 and **P < 0.01; H the representative cell Voronoi map showing the distribution of CD8+ T cells in ROI of normal control and pSS patient.
Fig. 2
Fig. 2. Associations of CD8+ T cells with disease progression and inflammatory.
A the representative images showing different density of CD8+ T cells infiltration. To investigate the associations of CD8+ T cells with disease progression and inflammatory, we formed four equally sized groups (absent, low, medium and high) of images ranging from CD8+ T cell absence to high infiltration; B box plots showing the expression of functional factors (pSS pathological markers and inflammatory cytokines) in four groups divided by the CD8+ T cell infiltration: absent, low, medium and high CD8+ T cell infiltration in their LSG.
Fig. 3
Fig. 3. Cell type content analysis in different pSS subgroups.
A Histogram demonstrating the differences on cell proportion in normal control and three pSS subgroups, including HE+SSA, HESSA+ and HE+SSA+ pSS patients; B boxplots and histogram showing the differences on cell frequency and proportion of each cell type between SSA+ and SSA patients; C boxplots and histogram showing the differences on cell frequency and proportion of each cell type between HE+ and HE patients, *P < 0.05; D the IMC image and corresponding cell Voronoi map showing the distribution of differential immune cells types in representative HE+ and HE patients.
Fig. 4
Fig. 4. Correlations between immune cell composition and clinical features.
A boxplots and histogram showing the differences on cell frequency and proportion of each cell type between response and non-response patients, *P < 0.05; B pie chart showing the percentage of immune and non-immune cells in response and non-response pSS patients; C Pearson’s correlations between the proportions of epithelial cells and other cells types across 30 ROIs of the 15 pSS patients. Each dot in the graphs represent one ROI; D histogram demonstrating the immune infiltration heterogeneity within lesions of response (five representative samples) and non-response; E bubble diagram showing the differences on the cell type content between subgroups divided by different clinical factors. This bubble plot shows the relationship between cell populations and clinical or pathological variables by interrogating the frequency of individual cell types as a percentage of total cells within each image. Circle size represents the level of significance. CTD connective tissue diseases; ILD interstitial lung disease; RP Raynaud’s phenomenon.
Fig. 5
Fig. 5. Changes in cellular neighborhood and cell–cell spatial interactions in pSS microenvironment.
A Heatmap showing the ten distinct cellular neighborhoods (CN) identified based on the original cell types (the 12 identified cells in cell clustering) and their respective abundances within each CN. CN was defined by its center cell and the 20 nearest neighbor cells; B three CNs (CN1, CN8 and CN10) showed significant differences on their abundance between normal and pSS patients; C Representative Voronoi diagrams of CNs of normal and pSS patients. The distribution of all identified CNs (left) and the dysregulated CNs (right) were mapped onto the corresponding IMC images; D the abundance of the two dysregulated CNs (CN1 and CN10) between HE+ and HE pSS patients; E the abundance of the two dysregulated CNs (CN6 and CN9) between response and non-response pSS patients; F heatmap showing the differences on cell-cell communications counts between pSS and normal controls. The cell-cell spatial communications (interactions/avoidances) counting was defined as the number of each cell type within a CN of a certain cell, and the differences on communications between each cell type within each CN were compared by permutation test, *P < 0.05; G patterns of cell-cell interactions/avoidance for cell type interaction in normal and pSS groups. Orange and blue circles representing interactions pattern and avoidance pattern, respectively. The dotted boxes depict associations referenced in the text; H heatmap showing the differences on cell-cell communications counts between HE+ and HE pSS patients, *P < 0.05 in permutation test; I circle diagrams showing the specific cell-cell communications among different cell types. The red arrows depict the cell types with obvious differences between groups, as referenced in the text.
Fig. 6
Fig. 6. Intercellular ligand–receptor interactions in pSS.
A The UMAP cell clustering based on the GSE272409 dataset, in which the captured cells were clustered into 9 cell populations; B expression of specific cell markers in each cell type; C Histogram demonstrating the differences on cell proportion in each normal control and pSS patient (upper, shown by samples) as well as in two groups (bottom, shown by groups); (D), E The total interactions numbers and strength in pSS and control samples; E the intercellular interactions numbers and strength in pSS and control samples; F interaction numbers of CD8+ T cells with other cell types, with a thick line representing more interaction numbers; G bubble diagram showing of incoming and outgoing signaling strength of each cell type for pSS (upper) and control samples (bottom). The Y-axis and X-axis presents the incoming and outgoing interaction strength, respectively; H bubble diagrams showing the increased and decreased interactions from receptors of other cell types to the ligands of CD8+ T cell. The red boxes depict associations referenced in the text.
Fig. 7
Fig. 7. CD8+ T cell subset identification and pseudotime trajectory analysis.
A The UMAP cell clustering of CD8+ T cells in GSE272409 dataset, in which the CD8+ T cells were clustered into five cell subsets; B expression of cell markers in each CD8+ T cell subset; C Histogram demonstrating the differences on cell proportion in each normal control and pSS patient (upper, shown by samples) as well as in two groups (bottom, shown by groups); D the top 5 upregulated and downregulated genes in each CD8+ T cell subset (in exception to CD160+CD8+ T cells because that this cell subset appeared to present only in pSS patients); E functional enrichment of the genes in each CD8+ T cell subset; F pseudotime trajectory analysis of CD8+ T cell subsets, and the results were shown as per Pseudotime, cell clusters, groups and state in turn; G heatmaps showing the changes on functions of CD8+ T cell subsets along with the pseudotime trajectory.
Fig. 8
Fig. 8. CD8+CD160+ T cells contributed injury of SGECs.
A Representative data showing CD45+CD160+ cells in the SG of NOD/Ltj mice (pSS model) and control mice by flow cytometry; B Representative data showing CD8+CD160+ cells in the SG of NOD/Ltj mice (pSS model) and control mice by flow cytometry; C Representative immunofluorescence images of CD8 (green) and CD160 (red) staining in the SG of NOD/Ltj mice (pSS model) and control mice; D The mRNA expression of IFN-γ, GZMB and TNF-α in CD8+CD160+ T cells relative to CD8+CD160 T cells; E Experimental scheme for the co-culture of stimulated CD8+CD160+ T or CD8+CD160 T cells with the SGECs; F cell viability of SGECs determined by CCK-8 assay; G apoptosis of SGECs determined by flow cytometry. *P < 0.05, **P < 0.01.

Similar articles

References

    1. Brito-Zerón P, Retamozo S, Ramos-Casals M. Sjögren syndrome. Med Clin. 2023;160:163–71. - PubMed
    1. Zeng W, Zhou X, Yu S, Liu R, Quek CWN, Yu H, et al. The future of targeted treatment of primary Sjögren’s syndrome: a focus on extra-glandular pathology. Int J Mol Sci. 2022;23:14135. - PMC - PubMed
    1. Gran JT. Diagnosis and definition of primary Sjögren’s syndrome. Scand J Rheumatol. 2002;31:57–59. - PubMed
    1. Franceschini F, Cavazzana I, Andreoli L, Tincani A. The 2016 classification criteria for primary Sjogren’s syndrome: what’s new?. BMC Med. 2017;15:69. - PMC - PubMed
    1. Seror R, Nocturne G, Mariette X. Current and future therapies for primary Sjögren syndrome. Nat Rev Rheumatol. 2021;17:475–86. - PubMed