

Basic stimulus processing alterations from top-down cognitive control in depression drive independent temporal components of multi-echo naturalistic fMRI data
- PMID: 40379640
- PMCID: PMC12084317
- DOI: 10.1038/s41398-025-03386-4
Basic stimulus processing alterations from top-down cognitive control in depression drive independent temporal components of multi-echo naturalistic fMRI data
Abstract
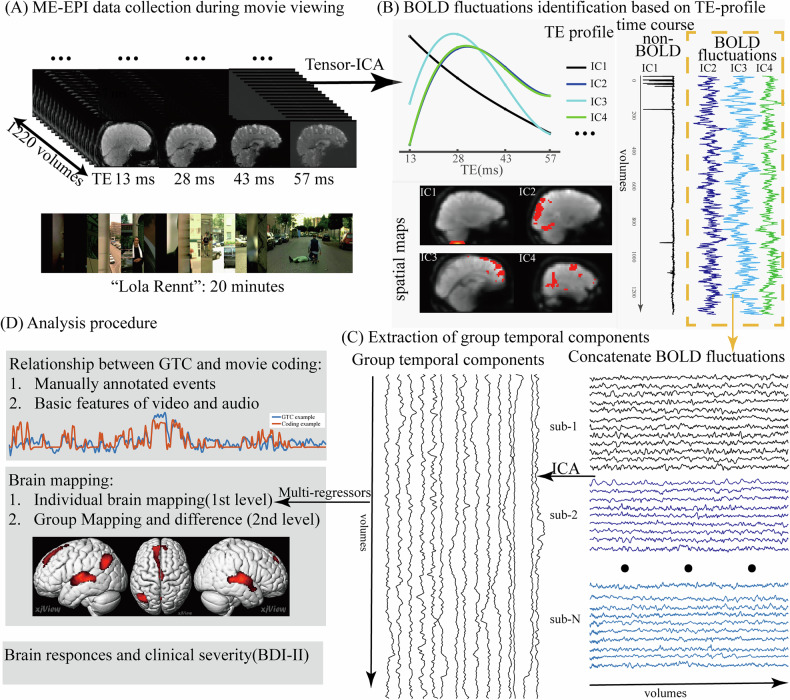
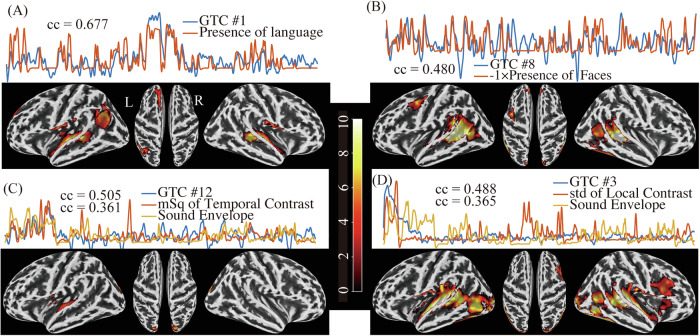
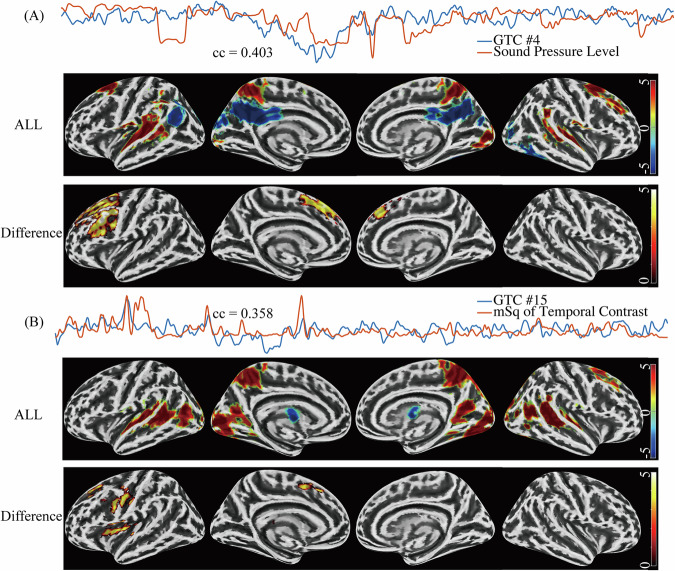
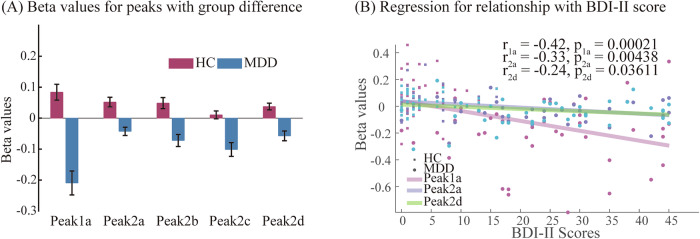
Perceptual changes in major depressive disorder (MDD) may extend beyond emotional content and include the processing of basic stimulus features. These alterations may ultimately contribute to perceptual bias and anhedonia. To characterize blood oxygen level-dependent (BOLD) signal of perceptual processing, we investigated temporally independent fMRI signal components related to naturalistic stimulus processing in 39 patients with MDD and 36 healthy subjects. Leveraging the capability of multi-echo data to detect BOLD activity changes, we extracted physiologically meaningful group temporal components. For each component that exhibited a significant correlation with the movie content, we localized its underlying brain network and assessed MDD-associated alterations. Two components exhibited significant group differences; one was associated with auditory features (sound pressure level) and one with visual features (temporal contrast of intensity). Notably, these deficits in MDD localized primarily to higher-order processing areas, such as the dorsal prefrontal cortex and insula, rather than primary sensory cortices. For the visual feature component, additional group differences emerged in non-visual primary sensory cortices (auditory and somatosensory) as well as major hubs of the motor system. Our findings support the hypothesis that basic sensory processing deficits represent an inherent feature of MDD which may contribute to anhedonia and negative perceptual bias. These deficits are primarily confined to higher-order processing units, as well as cross-modal primary sensory cortices indicating predominant dysfunction of top-down control and multisensory integration. Therapeutic effects of interventions targeting the prefrontal cortex may be partially mediated by restoring prefrontal control not only over emotional but also sensory processing hubs.
© 2025. The Author(s).
Conflict of interest statement
Competing interests: The authors declare no competing interests.
Figures
References
-
- McIntosh CN, Fischer DG. Beck’s cognitive triad: one versus three factors. Can J Behavioural Sci / Rev Canadienne des Sci du Comport. 2000;32:153–7.
-
- Sterzer P, Hilgenfeldt T, Freudenberg P, Bermpohl F, Adli M. Access of emotional information to visual awareness in patients with major depressive disorder. Psychological Med. 2011;41:1615–24. - PubMed
-
- Bubl E, Kern E, Ebert D, Bach M, Tebartz van Elst L. Seeing gray when feeling blue? depression can be measured in the eye of the diseased. Biol Psychiatry. 2010;68:205–8. - PubMed
MeSH terms
Grants and funding
LinkOut - more resources
Full Text Sources
