. 2025 May 16;16(1):391.
doi: 10.1038/s41419-025-07707-9.

MARCH8 suppresses hepatocellular carcinoma by promoting SREBP1 degradation and modulating fatty acid de novo synthesis

Affiliations

MARCH8 suppresses hepatocellular carcinoma by promoting SREBP1 degradation and modulating fatty acid de novo synthesis

Dao-Yuan Tu et al. Cell Death Dis. .

Abstract

Hepatocellular carcinoma (HCC) is one of the most prevalent malignant tumors of the digestive system, and its prevalence is currently increasing. The current study aims to elucidate the mechanism by which membrane-associated RING-CH8 (MARCH8) impedes the progression of HCC. MARCH8 was identified as a distinct prognostic marker for recurrence-free survival (RFS) and overall survival (OS) in patients with HCC. This study shows that MARCH8 hinders lipid deposition by suppressing the expression of key enzymes for the de novo synthesis of fatty acids (FAs) via RNA sequencing, untargeted metabolomics, and a series of in vivo and in vitro experiments. Further experimental validation demonstrated that MARCH8 was a novel E3 ligase of sterol regulatory element binding protein 1 (SREBP1). And, it primarily promoted the degradation of SREBP1, thereby suppressing the expression of key enzymes involved in the de novo synthesis of FAs. In conclusion, this study has identified MARCH8 as a key "switch" that can be targeted to prevent de novo FA synthesis in HCC cells. This finding may have substantial implications for discovering innovative therapeutic strategies for HCC.


Conflict of interest statement

Competing interests: The authors declare no competing interests.

Figures

Fig. 1
Fig. 1. MARCH8 is significantly downregulated in HCC cancer tissues and is associated with theprognosis of HCC patients.
A The heatmap analysis of the folding changes (CA/NT) in MARCH family protein expression in the HCC cancer tissues and matched non-tumor tissues. CA: HCC cancer tissues, NT: non-tumor tissues. WB quantification was performed using ImageJ. B, C WB was performed on 8 pairs of matched NT and CA tissues. D TMAs were used to analyze and score MARCH8 expression in 140 patients with HCC. E H-score revealed the expression level of MARCH8 protein in HCC cancer tissues and matched non-tumor tissues. F, G Kaplan–Meier analysis examined the OS and RFS in HCC patients with high and low expression of MARCH8. H, I Univariate and multivariate Cox regression analyses evaluated the independent prognostic risk of OS in HCC patients. *: p < 0.05, **: p < 0.01, ***: p < 0.001.
Fig. 2
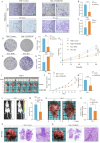
Fig. 2. MARCH8 can markedly suppress the invasion and metastasis of HCC cells.
AC Effect of MARCH8 on cell migration via transwell assays. Cell proliferation was detected by Colony formation (DG) and CCK-8 assays (H). Huh7-vector or Huh7-MARCH8 cells were injected into the dorsal subcutis or liver parenchyma of nude mice. Subcutaneous tumor volumes were measured every 3 days. Tumor images (I), growth curves (J), and weights (K) were obtained on day 21 after dissection. L, M A live imaging system assessed tumor growth in vivo by measuring fluorescence signals. N, O The ratio of orthotopic tumor to body weight of mice in the orthotopic model. P, Q Huh7-vector and Huh7-MARCH8 cells were injected into mice via the tail vein. After 21 days, all mice were euthanized, and their lungs were dissected and collected. These lung sections were stained with H&E and scanned. ***: p < 0.001.
Fig. 3
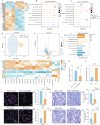
Fig. 3. MARCH8 is closely related to lipid metabolism in HCC cells.
A RNA sequencing of Huh7-vector and Huh7-MARCH8 groups identifies 586 differentially expressed genes (DEGs). B, C GO, and KEGG enrichment analyses reveal MARCH8’s close association with lipid metabolism based on DEGs. D Principal Component Analysis (PCA) of non-targeted metabolomics in Huh7-vector and Huh7-MARCH8 samples. E The volcano plot shows significant downregulation of metabolites in the MARCH8 overexpression group compared to the control group. F KEGG enrichment analysis for differential metabolites. G Heatmap of top 20 metabolites with the most significant differences. H Relative TG levels in Huh7-vector and Huh7-MARCH8 cells. I Relative TG levels in PLC-shNC and PLC-sh3 cells. J, K Nile Red and DAPI staining show lipid droplets (red) and nuclei (blue) in Huh7-vector or Huh7-MARCH8 cells. L, M Nile Red and DAPI staining show lipid droplets (red) and nuclei (blue) in PLC-shNC and PLC-sh3 cells. NQ Oil Red O staining highlights lipid droplets in tumors. ***: p < 0.001.
Fig. 4
Fig. 4. MARCH8 inhibits lipid accumulation and HCC progression by downregulating key enzymes for FA synthesis.
A qRT-PCR and B Western blot analyses of ACC1, ACLY, FASN, and SCD1 in Huh7-vector and Huh7-MARCH8. C Representative IHC staining of MARCH8, ACC1, and FASN in HCC TMAs. D, E Correlation of MARCH8 with ACC1 and FASN protein and mRNA expression in HCC TMAs based on H-score. F, G The fluorescence intensity of the Nile Red staining was determined by flow cytometry. H, I Nile Red and DAPI staining show lipid droplets and nuclei in Huh7-vector and Huh7-MARCH8 cells. J, K Nile Red, and DAPI staining show lipid droplets and nuclei in PLC-shNC and PLC-sh3 cells. LO Colony formation assay for cell proliferation. P Image of dissected subcutaneous tumors from different groups. Q Nude mouse tumor growth curve and R weight analysis. ns: non-significant, ***: p < 0.001.
Fig. 5
Fig. 5. MARCH8 specifically interacted with SREBP1 protein.
A Silver staining confirms the MARCH8 complex after IP assay. B GO enrichment analysis based on proteins in mass spectra and listing of pathways associated with lipid metabolism. C Top 10 potential interacting proteins associated with lipid metabolism identified by mass spectrometry. WB analysis of SREBP1 levels in D Huh7-MARCH8 and E PLC-sh3 cells treated with MG132 (10 µM for 6 h). F, G qRT-PCR assessment of SREBP1 mRNA expression after MARCH8 overexpression or knockdown. H, I Immunofluorescence shows co-localization of MARCH8 and SREBP1 in Huh7 and PLC cells, with fluorescence intensity profiles plotted using ImageJ. J, K Interaction between MARCH8 and SREBP1 was determined by GST precipitation, and purified GST was used as a control. L, M Co-IP assay in Huh7 and PLC cells confirms MARCH8-SREBP1 interaction. N, O Structural domains of MARCH8 and SREBP1 deletion mutants were analyzed for binding specificity using UniProt and SMART databases. P, Q Co-IP assays clarify specific binding domains of MARCH8 and SREBP1 in Huh7 cells. ns: non-significant.
Fig. 6
Fig. 6. MARCH8 enhances SREBP1 ubiquitination levels.
Ubiquitination assays of SREBP1 in A Huh7-MARCH8 and B PLC-sh3 cells. C, D Ubiquitination assays in HEK293T cells transfected with Flag-MARCH8 (C) or HA-SREBP1 (D). E Co-transfection of 7 mutant ubiquitin Myc plasmids with Flag-MARCH8 and HA-SREBP1 for 48 h in HEK293T cells, followed by co-IP assays with anti-HA microbeads. F Co-transfection of HA-SREBP1 plasmids with mutated lysine sites and Flag-MARCH8 in HEK293T cells for 48 h, followed by co-IP assays. All ubiquitination experiments were treated with MG132 (10 µM for 6 h). G, H WB analysis shows reduced SREBP1 protein levels at specified time points after cycloheximide (20 µg/mL) treatment in Huh7 cells. ns: non-significant, *: p < 0.05, **: p < 0.01, ***: p < 0.001.
Fig. 7
Fig. 7. MARCH8 inhibits the expression of ACC1 and FASN by regulating SREBP1.
A WB of SREBP1/nSREBP1 in cytoplasmic and nuclear fractions of Huh7-MARCH8 and PLC-sh3 cells. B, CSREBP1 DNA binding activity in Huh7-MARCH8 and PLC-sh3 cells. D, ESREBP1 binding sites in ACC1 and FASN promoters. F, G ChIP analysis of SREBP1 binding to the ACC1 and FASN promoters in Huh7-MARCH8 cells and PLC-sh3 cells, and qPCR was conducted using primers specific to the SREBP1 binding motifs. HK qRT-PCR and WB of SREBP1, ACC1, and FASN expression in Huh7 and PLC cells with MARCH8 and SREBP1 co-overexpression or knockdown. ns: non-significant, ***: p < 0.001.
Fig. 8
Fig. 8. MARCH8 is negatively associated with SREBP1-induced promotion of lipid accumulation and facilitation of HCC progression.
AD Nile Red and DAPI staining show lipid droplets (red) and nuclei (blue). EH Oil Red O staining of lipid droplets in tumors. IL Colony formation assay for cell proliferation. M, N In vivo, tumor growth was assessed by fluorescence imaging. O, P Tumor-to-body weight ratio in an orthotopic mouse model. Q Dissected subcutaneous tumors. R, S Tumor growth curve and weight analyses in nude mice. T H&E staining of lung sections. ns: non-significant, ***: p < 0.001.
Fig. 9
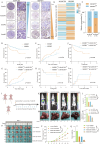
Fig. 9. The MARCH8-SREBP1 axis has potential clinical significance in the diagnosis and treatment of HCC.
Representative IHC staining of MARCH8 and SREBP1 in HCC TMAs (A) and summarization into heat maps (B) and bar chart (C) according to H-score. DI Kaplan–Meier analysis of the OS and RFS of SREBP1-positive vs. SREBP1-negative, MARCH8-positive & SREBP1-negative vs. MARCH8-negative & SREBP1-positive, and MARCH8-positive & SREBP1-positive vs. MARCH8-negative & SREBP1-negative patients based on HCC TMAs prognosis data. J Schematic showing the schedule of the mouse orthotopic liver tumor model, subcutaneous tumor models, and Fatostatin treatment. K, L A live imaging system assessed tumor growth in vivo by measuring fluorescence signals. M, N The ratio of orthotopic tumor to body weight of mice in the orthotopic model. Tumor images (O), growth curves (P), and weights (Q) were obtained on day 21 after dissection. **: p < 0.01, ***: p < 0.001.

References

    1. Villanueva A. Hepatocellular carcinoma. N Engl J Med. 2019;380:1450–62. - PubMed
    1. Llovet JM, Kelley RK, Villanueva A, Singal AG, Pikarsky E, Roayaie S, et al. Hepatocellular carcinoma. Nat Rev Dis Prim. 2021;7:6. - PubMed
    1. Jun BG, Kim M, Shin HS, Yi JJ, Yi SW. Impact of overweight and obesity on the risk of hepatocellular carcinoma: a prospective cohort study in 14.3 million Koreans. Br J Cancer. 2022;127:109–15. - PMC - PubMed
    1. El-Serag HB. Hepatocellular carcinoma. N Engl J Med. 2011;365:1118–27. - PubMed
    1. Fujiwara N, Nakagawa H, Kudo Y, Tateishi R, Taguri M, Watadani T, et al. Sarcopenia, intramuscular fat deposition, and visceral adiposity independently predict the outcomes of hepatocellular carcinoma. J Hepatol. 2015;63:131–40. - PubMed

MeSH terms

Substances