Clinical Trial
. 2025 May 16;16(1):4558.
doi: 10.1038/s41467-025-59739-6.

Tacrolimus dosing in liver transplant recipients using phenotypic personalized medicine: A phase 2 randomized clinical trial

Affiliations
Clinical Trial

Tacrolimus dosing in liver transplant recipients using phenotypic personalized medicine: A phase 2 randomized clinical trial

Jeffrey Khong et al. Nat Commun. .

Abstract

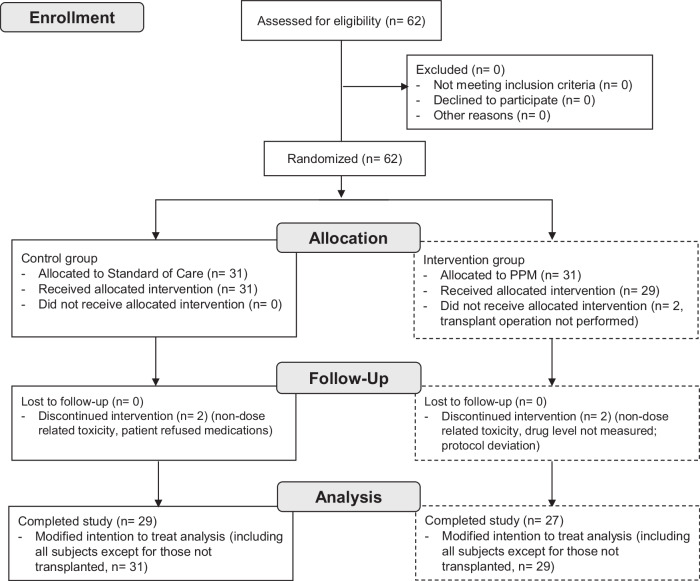
Tacrolimus is the most commonly used immunosuppression drug after solid organ transplantation; however, its dosing is challenging due to substantial inter-individual variability, often resulting in blood levels that deviate from the target therapeutic range. We explored whether a dynamically customized, phenotypic-outcome-guided drug dosing method could improve maintenance of drug trough levels within pre-determined target ranges, focusing on tacrolimus immediately after liver transplantation. This single-center, partially blinded, completed clinical trial involved 62 adults undergoing liver transplantation, block randomized into parallel groups: standard-of-care (SOC) clinician-determined or Phenotypic Personalized Medicine (PPM)-guided tacrolimus dosing. The primary outcome was percentage of post-transplant days with large (>2 ng/mL) deviations from the target range. At trial completion, analysis found statistically significant improvement in the PPM group (n = 27): 24.2% of days showing large deviations compared to 38.4% in the SOC group (n = 29) (difference -14.2%, 95% CI: -26.7 to -1.5 %, P = 0.029) with no increase in adverse events. These results demonstrate that PPM-guided tacrolimus dosing more effectively maintains drug levels within the target range compared to SOC, suggesting a promising approach to improving drug dosing. The trial was registered at ClinicalTrials.gov with the identifier NCT03527238.


Conflict of interest statement

Competing interests: C.M.H. is an inventor on pending and issued patents (International Patent Application Serial No. PCT/US2014/012111 and PCT/US2015/058892). CMH is a co-inventor of the pending patent WO2015017449. CMH and AZ are co-inventors of the issued patent US2019/0121935A1. C.M.H., A.Z., J.K., and M.L. are co-inventors of the pending patent (63/234,124). The remaining authors declare no competing interests.

Figures

Fig. 1
Fig. 1. CONSORT Flow Diagram Summarizing Participant Enrollment and Analysis.
The diagram shows the number of subjects assessed for eligibility, randomization, follow-up, and analysis stages, detailing exclusions, withdrawals, and final participant numbers analyzed. PPM: Phenotypic Personalized Medicine.
Fig. 2
Fig. 2. Comparison of percent of dosed days with large deviations (> 2 ng/ml) from target range during the post-transplant hospitalization between standard-of-care (SOC, n = 29) and Phenotypic Personalized Medicine (PPM, n = 27) dosing groups.
PPM dosing resulted in a lower percent post-transplant days with large deviations from the target range compared to SOC dosing (P = 0.029). Data are presented as a box-and-whiskers plot, where the center line represents the median, the bounds of the box indicate the interquartile range (IQR, 25th to 75th percentile), and the whiskers extend to the minimum and maximum values within 1.5 times the IQR. A two-tailed Wilcoxon Rank Sum test was used to compare the groups.
Fig. 3
Fig. 3. Differences in Length of Hospitalization after Liver Transplantation.
Patients in the SOC group (n = 29) had a longer median length of stay (LOS) after transplantation of 15 (10.5–20.5) days; the PPM group (n = 27) had a median LOS of 10 (8–12) days (P = 0.0026). A two-tailed Wilcoxon Rank Sum test was used to compare the groups.
Fig. 4
Fig. 4. Differences in TTL level after Liver Transplantation.
The mean tacrolimus trough level averaged over the length of the study for each patient in the SOC group (n = 29) was 7.6 (1.6) ng/mL; in the PPM group (n = 27) it was 8.4 (1.5) ng/mL (P = 0.034). Data are presented as a box-and-whiskers plot, where the center line represents the median, the bounds of the box indicate the interquartile range (IQR, 25th to 75th percentile), and the whiskers extend to the minimum and maximum values within 1.5 times the IQR. A two-tailed Wilcoxon Rank Sum test was used to compare the groups.
Fig. 5
Fig. 5. Differences in Over- or Underdosing after Liver Transplantation.
A Limiting the analysis only to underdosing after transplantation, the ADD below target range in the SOC group was 1.4 (1.0) ng/mL/day; in the PPM group, it was 0.76 (0.51) ng/mL/day (P = 0.0096). B Limiting the analysis only to overdosing after transplantation, the ADD above target range in the SOC group (n = 29) was 0.42 (0.47) ng/mL/day; in the PPM group (n = 27) it was 0.64 (0.58) ng/mL/day (P = 0.13). C Overall, the ADD in the SOC group was 1.81 (0.88) ng/mL/day; in the PPM group, it was 1.40 (0.79) ng/mL/day (P = 0.087). Data are presented as a box-and-whiskers plot, where the center line represents the median, the bounds of the box indicate the interquartile range (IQR, 25th to 75th percentile), and the whiskers extend to the minimum and maximum values within 1.5 times the IQR. A two-tailed Wilcoxon Rank Sum test was used to compare the groups.
Fig. 6
Fig. 6. Post-transplant Liver Enzyme Levels and Length of Stay.
A Patients in the SOC group (n = 24) took a median of 8.5 days (Q1-Q3 6.25–11.75) to normalize aspartate aminotransferase (AST) levels. The PPM group (n = 23) reached normal AST levels at 6 days (Q1-Q3 4–8) (P = 0.014). Data are presented as a box-and-whiskers plot, where the center line represents the median, the bounds of the box indicate the interquartile range (IQR, 25th to 75th percentile), and the whiskers extend to the minimum and maximum values within 1.5 times the IQR. A two-tailed Wilcoxon Rank Sum test was used to compare the groups. B Length of stay after transplantation was directly correlated with the number of days it took for AST levels to normalize (R2 = 0.42, P = 10−6), as assessed by a two-tailed Spearman rank correlation test.

Similar articles

Cited by

References

    1. Zarrinpar, A. & Busuttil, R. W. Liver transplantation: past, present and future. Nat. Rev. Gastroenterol. Hepatol.10, 434–440 (2013). - PubMed
    1. Starzl, T. E., Iwatsuki, S., Shaw, B. W. Jr., Gordon, R. D. & Esquivel, C. O. Immunosuppression and other nonsurgical factors in the improved results of liver transplantation. Semin. liver Dis.5, 334–343 (1985). - PMC - PubMed
    1. Enderby, C. & Keller, C. A. An overview of immunosuppression in solid organ transplantation. Am. J. Manag Care21, s12–s23 (2015). - PubMed
    1. Zarrinpar, A. & Busuttil, R. W. Immunomodulating options for liver transplant patients. Expert Rev. Clin. Immunol.8, 565–578 (2012). - PubMed
    1. Yu, S. et al. Influence of CYP3A5 gene polymorphisms of donor rather than recipient to tacrolimus individual dose requirement in liver transplantation. Transplantation81, 46–51 (2006). - PubMed

Publication types

Associated data