. 2025 May 16;16(1):4564.
doi: 10.1038/s41467-025-59621-5.

USP2 inhibition unleashes CD47-restrained phagocytosis and enhances anti-tumor immunity

Affiliations

USP2 inhibition unleashes CD47-restrained phagocytosis and enhances anti-tumor immunity

Panpan Dai et al. Nat Commun. .

Abstract

The CD47/SIRPα axis conveys a 'don't eat me' signal, thereby thwarting the phagocytic clearance of tumor cells. Although blocking antibodies targeting CD47 have demonstrated promising anti-tumor effects in preclinical models, clinical trials involving human cancer patients have not yielded ideal results. Exploring the regulatory mechanisms of CD47 is imperative for devising more efficacious combinational therapies. Here, we report that inhibiting USP2 prompts CD47 degradation and reshapes the tumor microenvironment (TME), thereby enhancing anti-PD-1 immunotherapy. Mechanistically, USP2 interacts with CD47, stabilizing it through deubiquitination. USP2 inhibition destabilizes CD47, thereby boosting macrophage phagocytosis. Single-cell RNA sequencing shows USP2 inhibition reprograms TME, evidenced by increasing M1 macrophages and CD8+ T cells while reducing M2 macrophages. Combining ML364 with anti-PD-1 reduces tumor burden in mouse models. Clinically, low USP2 expression predicts a better response to anti-PD-1 treatment. Our findings uncover the regulatory mechanism of CD47 by USP2 and targeting this axis boosts anti-tumor immunity.


Conflict of interest statement

Competing interests: The authors declare no competing interests.

Figures

Fig. 1
Fig. 1. Identifying the deubiquitinase USP2 as a positive regulator for CD47.
a Overview of the outline for establishing H1975 and HEK293T cell lines expressing a fusion GFP gene in the C-terminus of CD47 (CD47-GFP) and subsequently identifying the deubiquitinase of CD47 through DUB siRNA library screening with two stable cell lines. DUBs deubiquitinases; FACS fluorescence-activated cell sorting; MFI mean fluorescence intensity. b Whole-cell lysates (WCL) of H1975 or PC9 cells treated with indicated deubiquitinase inhibitors (2.5 µM) or dimethyl sulfoxide (DMSO) for 12 hours (h) were prepared and subjected to immunoblotting (IB) analysis. ce IB analysis of WCL derived from H1975 cells (c) and PC9 cells (e) treated with ML364 (1 µM and 2 µM) or DMSO for 16 h. The mRNA level of CD47 in H1975 cells (c) was measured using reverse transcription quantitative PCR (RT-qPCR) (d). f, g Immunofluorescence (IF) staining for CD47 in H1975 cells (f) and PC9 cells (g) treated with ML364 (2 µM) for 16 h. Scale bar, 25 μm. hk IB analysis of WCL derived from H1975 (h) or PC9 (j) cells stably expressing shUSP2 or shGFP, respectively. The mRNA level of CD47 in H1975 (i) or PC9 (k) cells was measured using RT-qPCR. l, m IB analysis of Cd47 protein expression in the tissues of lung, heart, or kidney obtained from wild-type (WT) and Usp2−/− mice (l). Quantification of Cd47 protein band intensity was normalized to vinculin (m). np IB analysis of WCL derived from HEK293T cells co-transfected with indicated constructs (n, p). The mRNA level of CD47 was quantified by RT-qPCR (o). EV: empty vector. q, r IB analysis of WCL derived from HEK293T cells co-transfected with indicated constructs. Cells were treated with 200 μg/ml CHX for the indicated time points (q). Quantification of CD47 protein band intensity was normalized to vinculin, then compared to the t = 0 time point (r). s, t Representative images from immunohistochemical (IHC) staining of CD47 and USP2 in human lung adenocarcinoma (s). Scale bar, left panels: 100 μm; right panels: 50 μm. n = 83. Quantification of USP2 and CD47 staining intensities was performed as average optical density (AOD) [AOD = Integrated Optical Density (IOD) SUM/Area SUM] (t). For (d, i, k, m, o, and r), unpaired two-tailed Student’s t-test. Correlations were analyzed by Pearson’s test (t). Data are shown as the mean ± SD, n = 3 independent biological replicates. P < 0.05 was considered statistically significant. n = 3 biologically independent experiments for (b, c, e, h, j, l, n, p, and q). Source data are provided as the Source Data file.
Fig. 2
Fig. 2. USP2 interacts with CD47 and deubiquitinates CD47.
a IB analysis of HEK293T WCL and anti-HA immunoprecipitates (IPs). HEK293T cells were co-transfected with indicated constructs and treated with 10 µM MG132 for 12 h before harvesting. b IB analysis of glutathione S-transferase (GST) pull-down protein mixture from HEK293T cell lysates that overexpressed CD47-cHA incubated with bacterially purified recombinant GST or GST-USP2 protein. c IB analysis of GST pull-down products from HEK293T cell lysates that overexpressed Flag-USP2 incubated with bacterially purified recombinant GST or GST-CD47 protein. d Schematic representation of WT and truncations of USP2, including the N-terminal region of amino acid (aa) 1–266 and C-terminal domain of aa267–605. e IB analysis of WCL and anti-HA IPs obtained from HEK293T cells, which were co-transfected with indicated constructs and treated with 10 µM MG132 for 12 h before harvesting. f IB analysis of GST pull-down products derived from HEK293T cell lysates that ectopic expression of CD47-cHA incubated with bacterially purified recombinant GST, GST-USP2 WT, and GST-USP2 truncations. g IB analysis of GST pull-down products derived from HEK293T cell lysates that ectopic expression of Flag-USP2 WT and truncations incubated with bacterially purified recombinant GST-CD47 protein. h Schematic diagram of CD47 WT and its various deletion mutants. i IB analysis of GST pull-down products derived from HEK293T cell lysates that ectopic expression of CD47-cHA WT and deletion mutants incubated with bacterially purified recombinant GST-USP2 protein. j, k IB analysis of WCL and IPs derived from H1975 (j) and PC9 (k) cells. l, m IB analysis of WCL and Ni-NTA pull-down products of the in vivo ubiquitination assay in the guanidine-HCl denaturing buffer. HEK293T cells were co-transfected with the indicated constructs and treated with 10 µM MG132 for 12 h before harvesting. n IB analysis of WCL and Ni-NTA pull-down products of the in vivo ubiquitination assay in the guanidine-HCl denaturing buffer. HEK293T cells were co-transfected with the indicated constructs and treated with 2 µM ML364 for 16 h and 10 µM MG132 for 12 h before harvesting. o, p IB analysis of WCL and IPs derived from lysates of H1975 (o) and PC9 (p) cells using indicated K48-Ubi antibodies. Cells were treated with 20 µM MG132 for 6 h before harvesting. q, r IB analysis of WCL and anti-CD47 IPs derived from H1975 (q) or PC9 (r) cells stably expressing shUSP2 or shGFP, respectively. Cells were treated with 20 µM MG132 for 6 h before harvesting. n = 3 biologically independent experiments for (a, b, c, e, f, g, and ir). Source data are provided as the Source Data file.
Fig. 3
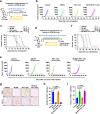
Fig. 3. USP2 inhibition enhances macrophage phagocytosis and reshapes an inflamed tumor microenvironment.
ad In vitro phagocytosis assay. Representative flow cytometry plots displaying THP-1 macrophage phagocytosis of PC9 cells (a) and H1975 cells (c). Quantitative results for phagocytosis to show the percentage of CFSE+ cells (PC9 cells for b and H1975 cells for d) in CD11b+ cells (THP-1 macrophages). PC9 or H1975 cells were pre-treated with DMSO or 2 µM ML364 for 16 h and pre-stained with carboxyfluorescein diacetate succinimidyl ester (CFSE). Subsequently, PC9 or H1975 cells were co-cultured with THP-1 cells, which have been stimulated with 100 ng/ml phorbol 12-myristate 13-acetate (PMA) for 48 h to induce THP-1 monocytes into macrophages. After 6 h of co-culture at 37 °C, cells were harvested for the flow cytometry analysis. n = 3 per group for (b, d). e A schematic treatment plan for immunocompetent C57BL/6J mice bearing LLC tumors. Mice were subcutaneously implanted with 2 × 106 LLC cells and treated with a control vehicle or USP2 inhibitor (ML364, 5 mg/kg), respectively. i.p., intraperitoneal; s.c., subcutaneous. fh The growth of subcutaneous LLC tumors was assessed. Images of LLC tumors at the endpoint (f). Tumor volume for different treatment groups was measured with a caliper, and the tumor growth curve was plotted (g). The weight of LLC tumors was measured at the endpoint (h). i Uniform Manifold Approximation and Projection (UMAP) of single-cell RNA sequencing (scRNA-seq) data showing the myeloid lineage subsets from LLC tumors treated with ML364 (5 mg/kg) or control vehicle for 12 days. Color coding indicates the different cell types. M1, M1 macrophages; M2, M2 macrophages; M0, M0 macrophages; DCs, dendritic cells; MDSCs, myeloid-derived suppressor cells. j Dot-plot showing the selected representative gene markers enriched in myeloid lineage subsets. k Comparative abundance of the myeloid lineage subsets in LLC tumors treated with control vehicle (blue) versus ML364 (green) from the scRNA-seq data. l, m Quantification of MHCII+ (M1 macrophage) cells (l) or CD206+ (M2 macrophage) cells (m) represented as a percentage of F4/80+ macrophages in subcutaneous LLC tumors derived from mice with indicated treatments. n Quantification of Gr1+Ly6C+cells (myeloid-derived suppressor cells, MDSCs) represented as a percentage of CD11b+ monocytes in subcutaneous LLC tumors derived from mice with indicated treatments. o Quantification of CD8+ T cells represented as a percentage of CD3+ lymphocytes in subcutaneous LLC tumors derived from mice-indicated treatments. pr Representative IF staining images of CD86 (orange) and CD206 (green) in subcutaneous LLC tumors with indicated treatments (p). Each point represents the average counts of positive cells within three high-power fields (q, r). Scale bars, 100 μm (left); zoom scale bars, 50 μm (right). For (b, d, h, lo, q, and r), unpaired two-tailed Student’s t-test. Two-way ANOVA for (g). n = 5 mice per group for (g, h, lo, q, and r), Data are shown as the mean ± SD. P < 0.05 was considered statistically significant. Source data are provided as the Source Data file.
Fig. 4
Fig. 4. USP2 inhibition by ML364 sensitizes tumors to anti-PD-1 immunotherapy in syngeneic LLC lung tumor models.
a A schematic treatment plan for immunocompetent C57BL/6J mice bearing LLC tumors. Mice were subcutaneously implanted with 2 × 106 LLC cells and treated with a control vehicle, USP2 inhibitor (ML364, 5 mg/kg, daily for 12 doses), anti-PD-1 mAb (100 μg per mouse, every three days for 4 treatments), or combined treatment, respectively. i.p., intraperitoneal; s.c., subcutaneous; MAb, monoclonal antibody. b, c Tumor growth (b) or Kaplan–Meier survival curves (c) for C57BL/6J bearing LLC tumors with indicated treatments. d The weight of LLC tumors was measured at the endpoint. e Quantification of cellular surface CD47 on CD45 cells in subcutaneous LLC tumors derived from C57BL/6J mice with indicated treatments. fh Quantification of MHCII+ (M1 macrophage) cells (f) or CD206+ (M2 macrophage) cells (g) represented as percentage of F4/80+ macrophages, and CD8+ T cells (h) represented as percentage of CD3+ T cells in subcutaneous LLC tumors derived from C57BL/6J mice-indicated treatments. i A schematic treatment plan for the immunocompetent C57BL/6J lung tumor mouse model. Mice were injected with 1 × 106 LLC cells/per mouse via tail vein injection, followed by treatments with control vehicle, ML364 (5 mg/kg), anti-PD-1 mAb (100 μg per mouse), or combined treatment, respectively. i.p., intraperitoneal; i.v., intravenous. jl Representative H&E-stained images of lung tissues from mice across different groups (j), tumor size was quantified by measuring the cross-sectional area of all tumors (k), and the tumor-occupied lung area (tumor area, %) was calculated (l) from three nonconsecutive sections per mouse. Scale bars, 5 mm. m LLC-GFP tumors bearing C57BL/6J mice were treated as (a). Representative images of IF staining for tumor cells (GFP, green), macrophages (F4/80, red), and nuclei (DAPI, blue). The yellow (indicated with arrows) showing colocalization of GFP (green) and F4/80 (red) double-positive cells suggested the macrophage phagocytosis of tumor cells. Each point represents the average counts of yellow cells within three high-power fields. The sections were scanned at 60× with an oil objective on a confocal microscope. Scale bars, 50 μm (left panels); zoom scale bars, 20 μm (right panels). For (dh, k, and l), unpaired two-tailed Student’s t-test. Two-way ANOVA for (b). Log-rank test for (c). n = 5 mice per group. Data are shown as the mean ± SD. P < 0.05 was considered statistically significant. Source data are provided as the Source Data file.
Fig. 5
Fig. 5. High-dose ML364 combined with anti-PD-1 therapy significantly extends the survival of mice bearing LLC tumors.
a Diagrammatic treatment plan for immunocompetent C57BL/6J mice with LLC tumors. Mice were implanted with 2 × 106 LLC cells and treated with Vehicle, ML364 (5 mg/kg daily for 18 doses), anti-PD-1 mAb (100 μg/mouse every three days for 6 doses), or combination therapy. i.p., intraperitoneal; s.c., subcutaneous. b Tumor volume in different treatment groups was assessed using calipers, and the tumor growth curve was generated. n = 8 (Vehicle); 8 (ML364); 8 (anti-PD-1 mAb) and 10 (Combined therapy) mice. c Kaplan–Meier survival curves for C57BL/6J bearing LLC tumors with indicated treatments. Log-rank test. n = 8 (Vehicle); 8 (ML364); 8 (anti-PD-1 mAb) and 10 (Combined therapy) mice. d A schematic treatment plan for immunocompetent C57BL/6J mice bearing 2 × 106 LLC tumors. Mice were treated with a control vehicle, USP2 inhibitor (ML364, 30 mg/kg for 18 doses), anti-PD-1 mAb (200 μg per mouse for 6 doses), or combined treatment, respectively. e Tumor volume in the different treatment groups was measured using calipers, and the corresponding tumor growth curve was generated. Vehicle (n = 9), ML364 (n = 8), PD-1 mAb (n = 8), ML364 & PD-1 mAb (n = 13) mice per group. f Kaplan–Meier survival curves for C57BL/6J bearing LLC tumors with indicated treatments. Vehicle (n = 9), ML364 (n = 8), PD-1 mAb (n = 8), ML364 & PD-1 mAb (n = 13) mice per group. Log-rank test. g IHC staining for CD47 and PD-L1 in LLC tumors from C57BL/6J mice treated with indicated reagents. Scale bar, 50 μm. h, i Quantification for CD47 (h) and PD-L1 (i) positive cells. Each point represents the average counts of positive cells within three high-power fields. For (h) and (i), unpaired two-tailed Student’s t-test. n = 5 mice per group. Log-rank test for (c, f). Data are shown as the mean ± SD. P < 0.05 was considered statistically significant. Source data are provided as the Source Data file.
Fig. 6
Fig. 6. The anti-tumor effects of ML364 combined with anti-PD-1 therapy require both macrophages and CD8+ T cells.
a A schematic treatment plan for immunocompetent C57BL/6J mice bearing sgControl- or sgCd47-LLC tumors. Mice were subcutaneously implanted with 2 × 106 sgControl or sgCd47-LLC cells and treated with a control vehicle, USP2 inhibitor (ML364, 5 mg/kg, daily for 12 doses), anti-PD-1 mAb (100 μg per mouse, every three days for 4 treatments), or combined treatment, respectively. i.p., intraperitoneal; s.c., subcutaneous. b, c Tumor volume in each treatment group was measured using calipers, and the tumor growth curve was subsequently plotted (b). At the study endpoint, the weight of LLC tumors was recorded (c). n = 5 mice per group. d The body weight of C57BL/6J mice was monitored throughout the duration of the indicated treatment. n = 5 mice per group. e A schematic treatment plan for CD8 T cell or macrophage deletion experiments. Mice were randomly divided into five groups: (1) vehicle, (2) ML364 & PD-1 mAb (MP), (3) MP & CD8 deletion (αCD8), (4) MP & macrophage deletion (clodronate liposomes, CL), and (5) MP & αCD8 & CL. On day 5 post-tumor implantation, mice in MP were treated with a combination of ML364 (5 mg/kg) daily for 12 treatments and anti-PD-1 mAb (100 μg per mouse) every 3 days for 4 doses. After grouping as indicated, mice received αCD8 antibody (200 μg per mouse) every 3 days for 4 doses, starting three days before tumor implantation. Macrophage deletion by CL was administered with 200 μl per mouse every 3 days for 4 doses, starting on the day of tumor implantation. i.p., intraperitoneal; s.c., subcutaneous. f, g Tumor volume for each treatment group was measured using calipers, and the tumor growth curve was plotted (f). The weight of LLC tumors was measured at the endpoint (g). n = 5 mice per group. h, i Quantification of CD8+ represented as percentage of CD3+ T cells (h) and F4/80+ macrophages represented as percentage of CD11b+ cells (i) in subcutaneous LLC tumors derived from C57BL/6J mice treated with indicated reagents. For (c) and (gi), unpaired two-tailed Student’s t-test. n = 5 mice per group. Two-way ANOVA for (b, d, and f). Data are shown as the mean ± SD. P < 0.05 was considered statistically significant. Source data are provided as the Source Data file.
Fig. 7
Fig. 7. USP2 inhibition by ML364 or genetic depletion overcomes resistance to anti-PD-1 immunotherapy in KrasLSL-G12D/+; Trp53fl/fl (KP) mouse tumor model.
a A schematic treatment plan for autochthonous lung tumors in KrasLSL-G12D/+; Trp53fl/fl (KP) mice. KP mice were administered with an intranasal injection of Ad-Cre with 2 × 106 pfu/mouse. Five weeks after induction, mice were treated as indicated with control vehicle, ML364 (5 mg/kg), anti-PD-1 mAb (100 μg per mouse), or combined treatment, respectively. i.p., intraperitoneal; i.n., intranasal. bd Representative H&E staining images of lung tissues from mice during different groups (b), tumor size was quantified by measuring the cross-sectional area of all tumors (c), and the tumor area (%) was calculated (d) from three nonconsecutive sections per KP mouse. Scale bars, 5 mm. e A schematic treatment plan for autochthonous lung tumors in KP and KrasLSL-G12D/+; Trp53fl/fl; Usp2−/− (KPU) mice. KP and KPU mice were administered with an intranasal injection of Ad-Cre with 2 × 106 pfu/mouse. Five weeks after induction, mice were treated as indicated with a control vehicle or anti-PD-1 mAb (100 μg per mouse). i.p., intraperitoneal; i.n., intranasal. f Micro-CT images of lungs in the indicated planes from KP and KPU mice with indicated treatments. Three-dimensional rendering of micro-CT data shows lungs in gray. Scale bars, 5 mm. g The healthy lung volumes of mice in each group were quantified using computational extraction through 3D reconstruction by the Avatar program. hj Representative images of H&E-stained lung tissues from mice in different groups (h), tumor size was quantified by measuring the cross-sectional area of all tumors (i), and the tumor area (%) was calculated (j) based on three nonconsecutive sections per KP or KPU mouse. Scale bars, 5 mm. For (c, d, g, i, and j), unpaired two-tailed Student’s t-test. n = 8 mice per group. Data are shown as the mean ± SD. P < 0.05 was considered statistically significant. Source data are provided as the Source Data file.
Fig. 8
Fig. 8. Cancer patients with low USP2 expression exhibit better responses to cancer immunotherapy.
a, b Representative IF staining images for CD163 (green) and CD8 (red) in human lung adenocarcinoma (LUAD) tissues with the USP2 high (n = 13) and low (n = 16) expression (a). Quantifications of CD163 and CD8 positive cells in LUAD samples with USP2 high or low expression, respectively (b). Each point represents the average counts of positive cells within three high-power fields. Scale bars, 500 μm (left panels); zoom scale bars, 50 μm (right panels). ce USP2 expression was negatively correlated with the infiltration of M1 macrophages (c) and CD8+ T cells (e), while USP2 displayed a positive correlation with the infiltration of M2 macrophages (d) in lung cancer patients based on the immune association analysis by TIMER2.0 software. f, g Representative images from IHC staining of CD47 and USP2 in responders (R) and non-responders (NR) of lung cancer patients with anti-PD-1 therapy (f). Scale bar, left panels: 100 μm; right panels: 50 μm. Association between USP2 or CD47 expression and response to anti-PD-1 therapy in lung cancer patients (g). n = 6 (R), or 6 (NR). Patients were divided into USP2 or CD47 low and high expression groups according to their IHC score mean value (f). h, i Representative images of multiplex immunohistochemistry (mIHC) staining for R and NR of lung cancer patients with anti-PD-1 immunotherapy (h). Quantifications of CD163 (white), CD8 (red), and CK (green) in each group (i). Each point represents the average counts of positive cells within three high-power fields. n = 5 per group. Scale bars, 100 μm (left panels); zoom scale bars, 50 μm (right panels). j, k Representative images from IHC staining of CD47 and USP2 in responders and non-responders of oral cancer patients with anti-PD-1 therapy (j). Scale bar, left panels: 100 μm; right panels: 50 μm. Association between USP2 or CD47 expression and response to anti-PD-1 therapy in oral cancer patients (k). n = 25 (R), or 19 (NR). Patients were divided into USP2 or CD47 low and high expression groups according to their IHC score mean value (j). l, m Representative images of mIHC staining for responders and non-responders of oral cancer patients with anti-PD-1 therapy (l). Quantifications of CD163 (white), CD8 (red), and CK (green) in each group (m). Each data point represents the average counts of positive cells within three high-power fields. n = 18 (R), or 13 (NR). Scale bars, 100 μm (left panels); zoom scale bars, 50 μm (right panels). For (b), unpaired two-tailed Student’s t-test. For (g) and (k), a two-sided χ2 test. For (i) and (m), two-tailed Non-parametric Mann–Whitney test. Data are shown as the mean ± SD P < 0.05 was considered statistically significant. Source data are provided as the Source Data file.

References

    1. Ribas, A. & Wolchok, J. D. Cancer immunotherapy using checkpoint blockade. Science359, 1350–1355 (2018). - PMC - PubMed
    1. Zappasodi, R., Merghoub, T. & Wolchok, J. D. Emerging concepts for immune checkpoint blockade-based combination therapies. Cancer Cell33, 581–598 (2018). - PMC - PubMed
    1. Bagchi, S., Yuan, R. & Engleman, E. G. Immune checkpoint inhibitors for the treatment of cancer: clinical impact and mechanisms of response and resistance. Annu. Rev. Pathol.16, 223–249 (2021). - PubMed
    1. Sharma, P., Hu-Lieskovan, S., Wargo, J. A. & Ribas, A. Primary, adaptive, and acquired resistance to cancer immunotherapy. Cell168, 707–723 (2017). - PMC - PubMed
    1. Yap, T. A. et al. Development of immunotherapy combination strategies in cancer. Cancer Discov.11, 1368–1397 (2021). - PMC - PubMed

MeSH terms