

Bioinformatics analysis of comorbid mechanisms between ischemic stroke and end stage renal disease
- PMID: 40379713
- PMCID: PMC12084348
- DOI: 10.1038/s41598-025-01049-4
Bioinformatics analysis of comorbid mechanisms between ischemic stroke and end stage renal disease
Abstract
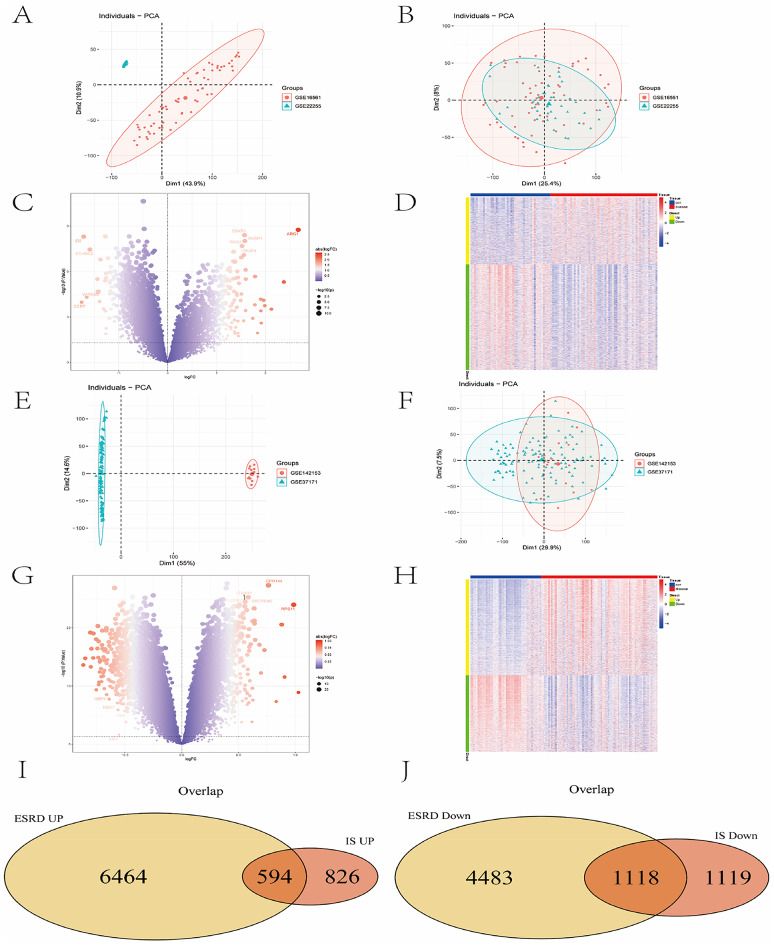
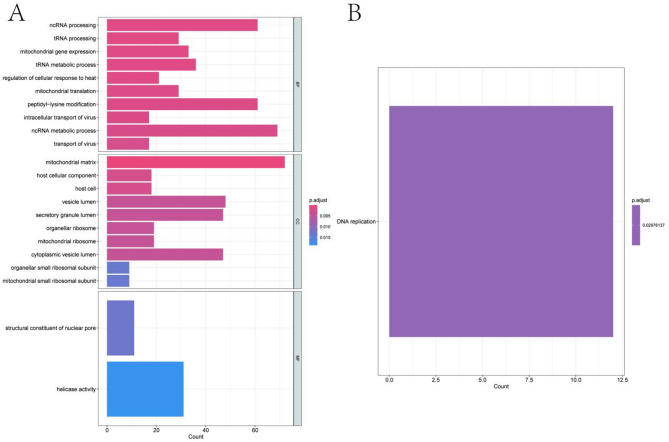
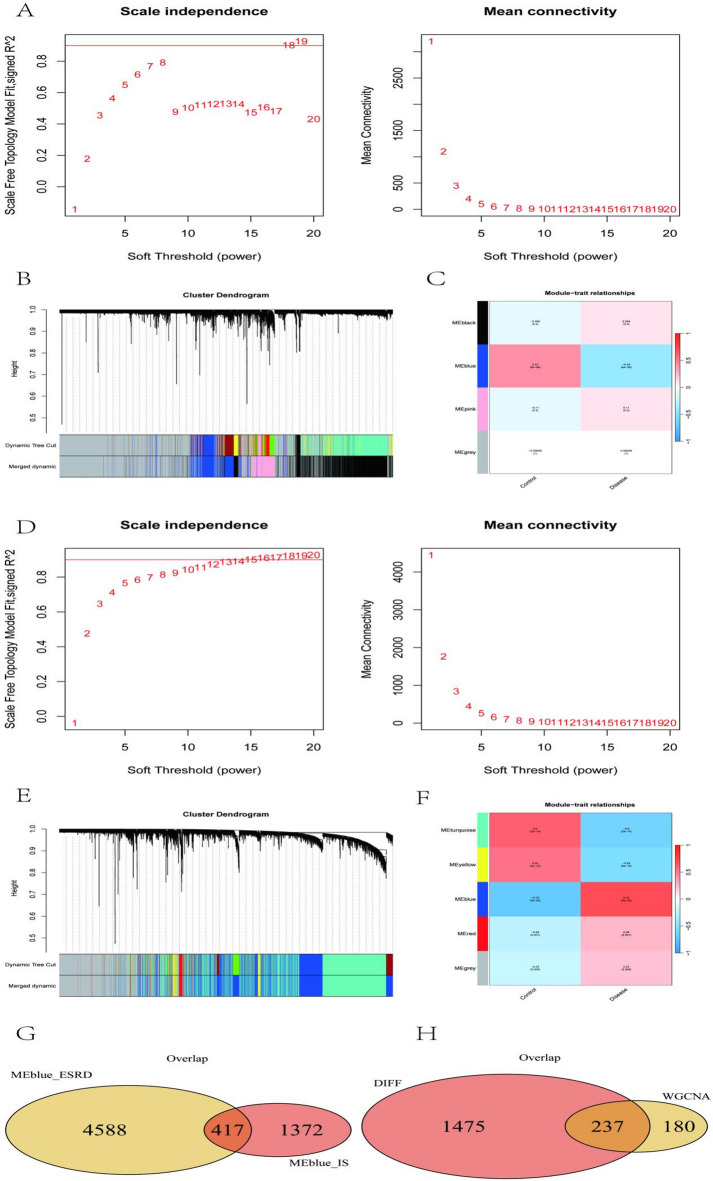
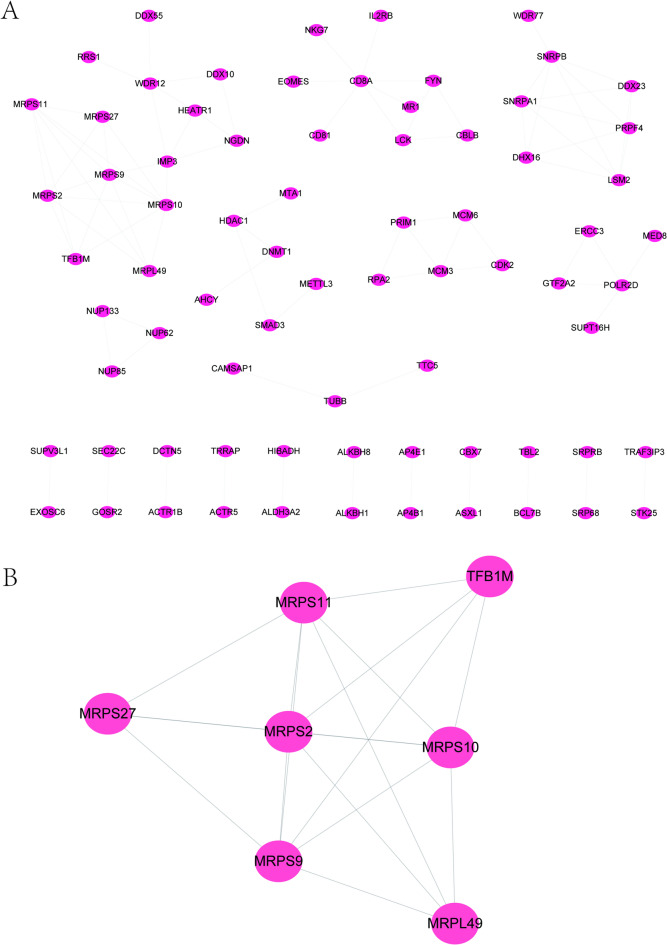
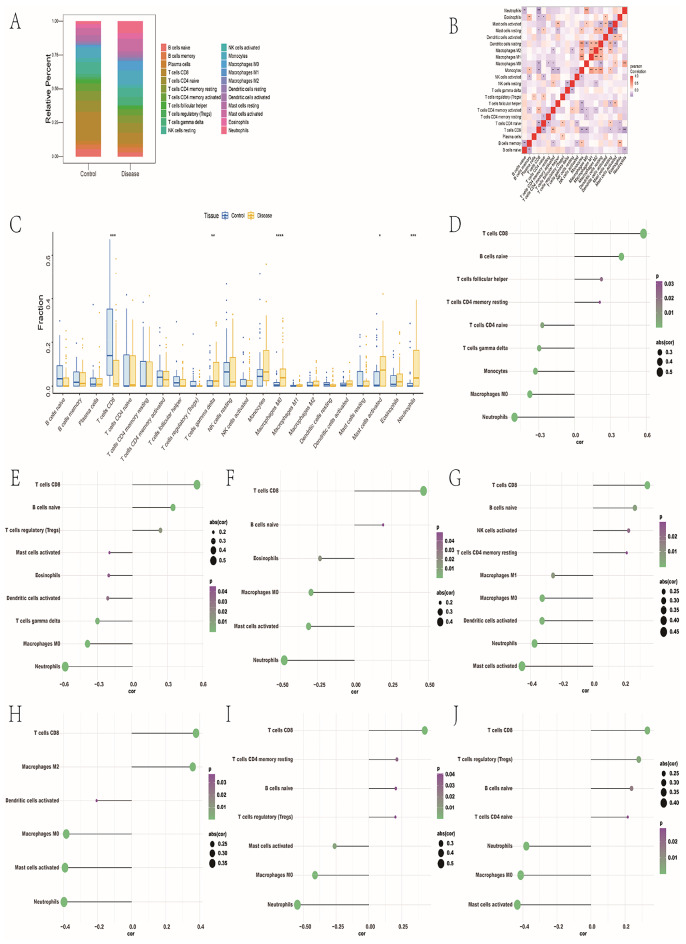
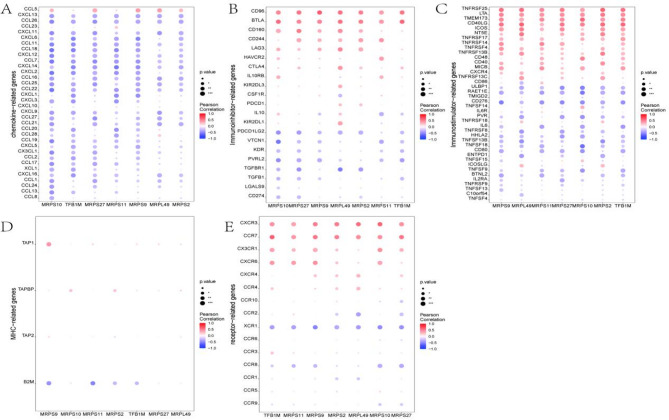
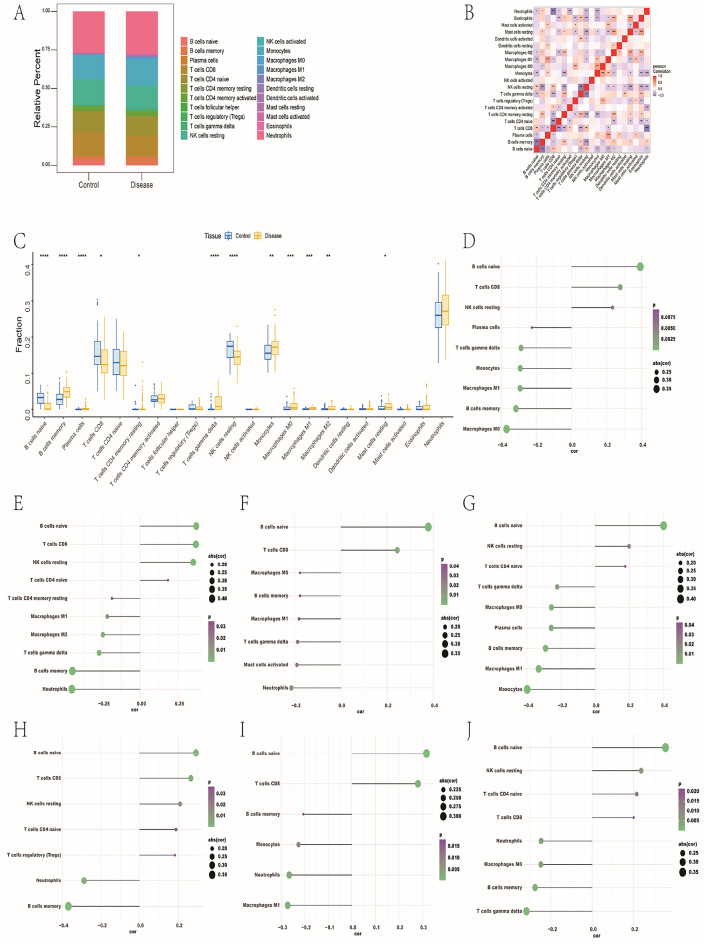
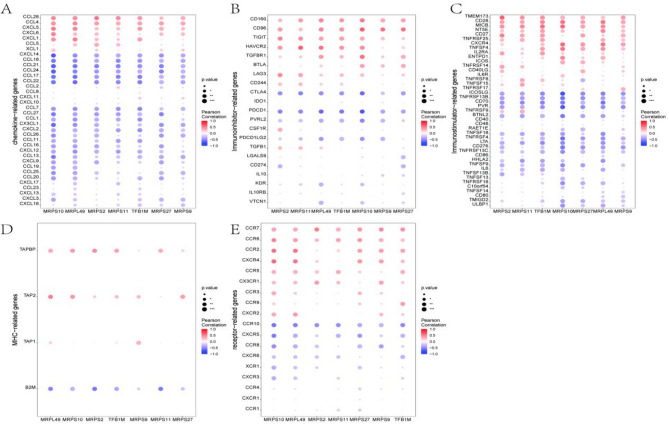
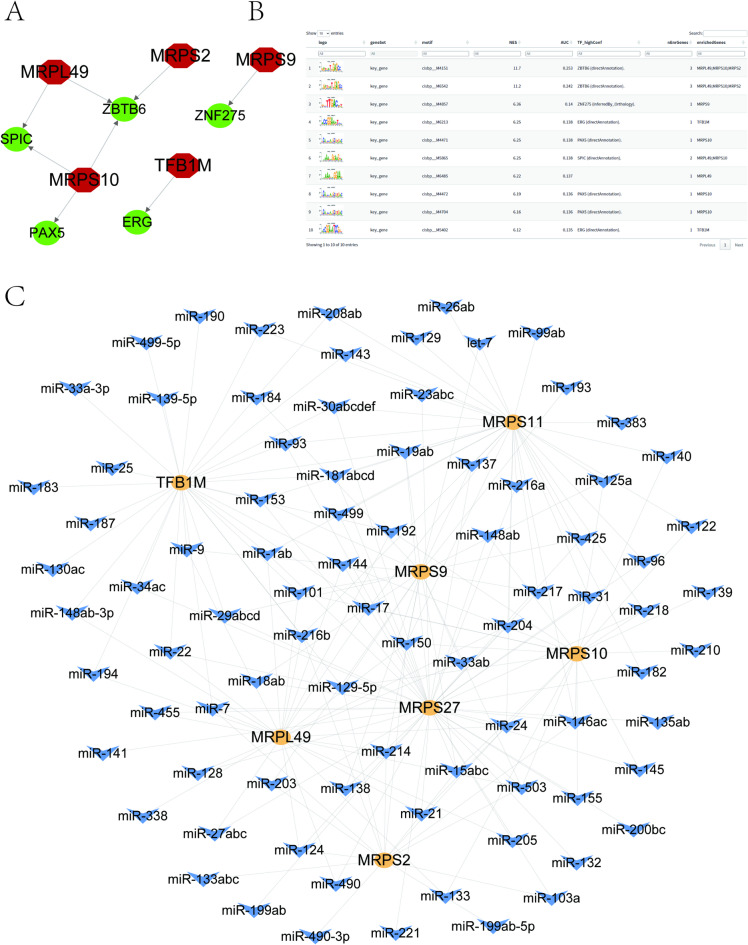
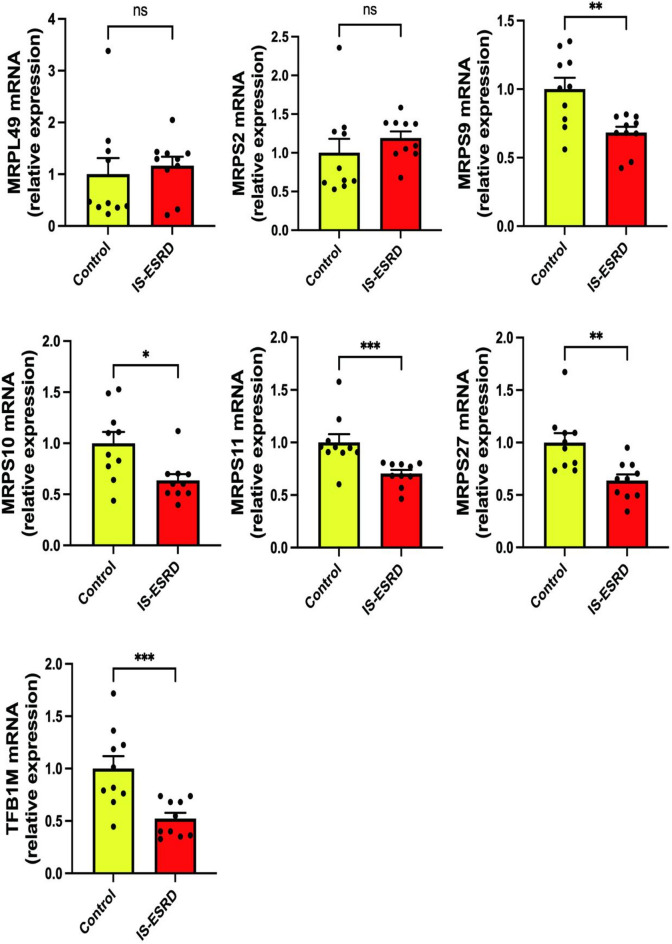
Ischemic stroke (IS) is a leading global cause of mortality and disability, particularly prominent in patients with end-stage renal disease (ESRD). Despite clinical evidence of their comorbidity, the molecular mechanisms underlying their interaction remain elusive. This study aims to identify shared biomarkers, gene regulatory networks, and therapeutic targets through integrative bioinformatics analyses. Gene expression datasets for IS (GSE16561, GSE22255) and ESRD (GSE37171, GSE142153) were obtained from gene expression omnibus (GEO). Weighted gene co-expression network analysis (WGCNA) and differential expression genes (DEGs) analysis identified shared genes and enriched pathways. Protein-protein interaction networks were constructed using STRING with clustering algorithms. Immune cell infiltration analysis was performed via CIBERSORT. Transcriptional regulatory networks were predicted using RcisTarget and miRcode. Key gene expressions were validated by reverse transcription-quantitative polymerase chain reaction (RT-qPCR) in clinical samples. We identified 417 intersecting genes through WGCNA and 1712 shared differentially expressed genes. Among these, seven key genes (MRPL49, MRPS2, MRPS9, MRPS10, MRPS11, MRPS27, TFB1M) demonstrated central roles in mitochondrial function. Immune infiltration analysis revealed significant correlations with T cells and neutrophils. Pathway enrichment implicated these genes in transforming growth factor beta (TGF-β) signaling, p53 pathway, and G2/M checkpoint. Clinical validation confirmed significant downregulation of MRPS9, MRPS10, MRPS11, MRPS27 and TFB1M in comorbid patients. This study systematically elucidates the mitochondrial-immune interaction mechanisms in IS-ESRD comorbidity, highlighting the pivotal role of mitochondrial ribosomal protein (MRP) family genes in regulating cellular energetics and inflammatory responses. These findings provide new foundations for targeted therapies.
Keywords: Bioinformatics analysis; End-stage renal disease; Ischemic stroke; Oxidative stress.
© 2025. The Author(s).
Conflict of interest statement
Declarations. Competing interests: The authors declare no competing interests. Ethics approval and consent to participate: The study involving human participants was reviewed and approved by the Ethics Committee of The Affiliated Guangdong Second Provincial General Hospital of Jinan University (Approval No:2024-KY-KZ-211-01). The research was conducted in accordance with local legislation and institutional requirements. All the patients have been informed and signed informed consent before the experiments. Consent for publication: All authors have read and approved the final manuscript. We confirm that we have obtained consent from all individuals whose datas are included in the manuscript, and all authors agree with the publication of this manuscript.
Figures
Similar articles
-
Identifying immune cell infiltration and effective diagnostic biomarkers for ischemic stroke using bioinformatics analysis.PLoS One. 2024 Dec 5;19(12):e0310108. doi: 10.1371/journal.pone.0310108. eCollection 2024. PLoS One. 2024. PMID: 39636891 Free PMC article.
-
Analyses of the mechanism and therapeutic targets of senescence related genes in ischemic stroke with multi-omics approach.Sci Rep. 2025 Jul 18;15(1):26178. doi: 10.1038/s41598-025-10367-6. Sci Rep. 2025. PMID: 40681605 Free PMC article.
-
Identification of common mechanisms and biomarkers for dermatomyositis and atherosclerosis based on bioinformatics analysis.Skin Res Technol. 2024 Jun;30(6):e13808. doi: 10.1111/srt.13808. Skin Res Technol. 2024. PMID: 38899746 Free PMC article.
-
Circulating mRNA and microRNA profiling analysis in patients with ischemic stroke.Mol Med Rep. 2020 Aug;22(2):792-802. doi: 10.3892/mmr.2020.11143. Epub 2020 May 14. Mol Med Rep. 2020. PMID: 32626985 Free PMC article.
-
Bioinformatics identification and validation of pyroptosis-related gene for ischemic stroke.BMC Med Genomics. 2025 Mar 16;18(1):53. doi: 10.1186/s12920-025-02119-2. BMC Med Genomics. 2025. PMID: 40091022 Free PMC article.
References
-
- Soltanpour, M., Greiner, R., Boulanger, P. & Buck, B. Improvement of automatic ischemic stroke lesion segmentation in CT perfusion maps using a learned deep neural network. Comput Biol. Med.137, 104849 (2021). - PubMed
-
- Kim, S. J. & Bang, O. Y. Antiplatelet therapy for preventing stroke in patients with chronic kidney disease. Contrib. Nephrol.179, 119–129 (2013). - PubMed
MeSH terms
Grants and funding
LinkOut - more resources
Full Text Sources
Medical
Research Materials
Miscellaneous
