. 2025 May 16;15(1):17099.
doi: 10.1038/s41598-025-00553-x.

A recombinant BCG with surface-displayed antigen induces humoral and cellular immune responses

Affiliations

A recombinant BCG with surface-displayed antigen induces humoral and cellular immune responses

Jin-Yu Zhang et al. Sci Rep. .

Abstract

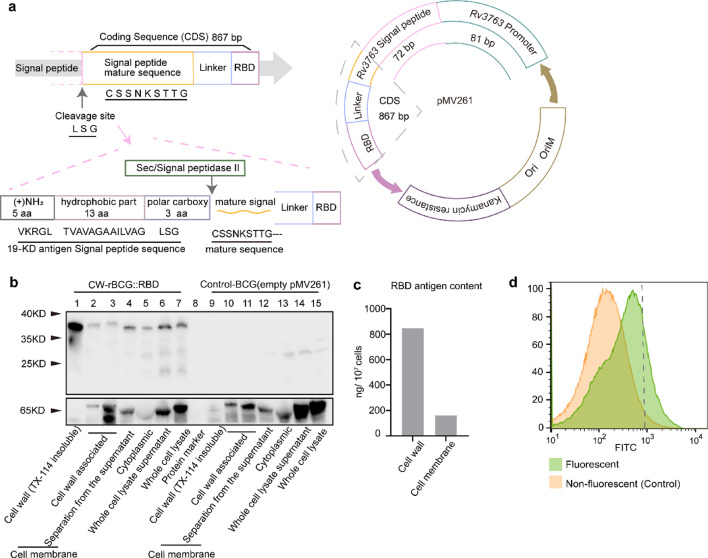
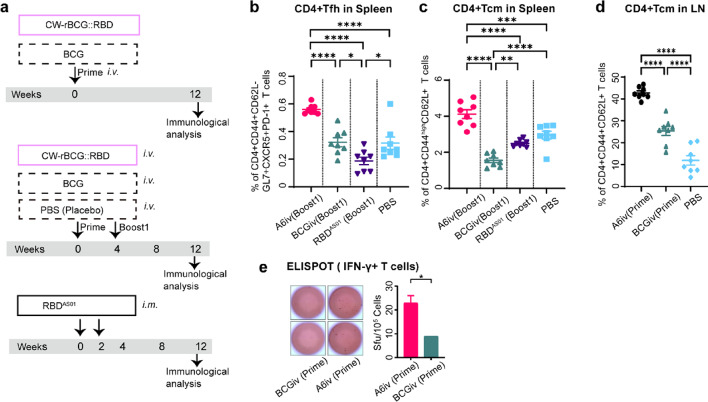
Bacillus Calmette-Guérin (BCG) is an attenuated vaccine widely used for tuberculosis prevention. While BCG has long been perceived as an intracellular candidate vector for delivering antigens against infectious diseases and cancers, challenges persist in inducing durable immune responses, particularly high-titer neutralizing antibodies (Nabs). Here we show that displaying antigens in the surface of BCG is a promising strategy to induce long-lasting Nabs production and T-cell responses. We constructed a recombinant BCG expressing the SARS-CoV-2 receptor-binding domain (RBD) antigen on its cell wall, termed CW-rBCG::RBD, which achieved an antigen yield approaching 850 nanograms per 107 colony-forming unit. Compared with both the parental BCG and the RBD protein subunit vaccine (RBDAS01), intravenous administration of CW-rBCG::RBD followed by a booster dose significantly enhanced Nab production and increased the frequencies of RBD-specific central memory T cells (Tcm) and T follicular helper (Tfh) cells in the spleen. In mice primed with a single dose of CW-rBCG::RBD and boosted with RBDAS01, we also observed elevated Nab titers and detectable levels of RBD-specific IgG2a antibodies at 8 weeks post-priming, responses that were not observed in the BCG-primed or RBDAS01-only groups. Furthermore, subcutaneous co-administration of CW-rBCG::RBD and RBDAS01 sustained Nab production for up to 31 weeks and maintained higher Tfh and Tcm cell frequencies compared to both BCG co-administration with RBDAS01 and RBDAS01 alone. These findings highlight an effective strategy for optimizing BCG-based vaccination and immunotherapy platforms. Subject terms: recombinant BCG; immune response; vaccines; cell wall; SARS-CoV-2 RBD.


Conflict of interest statement

Declarations. Competing interests: The authors declare no competing interests.

Figures

Fig. 1
Fig. 1
Generation and verification of recombinant BCG strain CW-rBCG::RBD. (a) Schematic representation of the coding sequence within the recombinant pMV261 plasmid, encompassing the 19-KD antigen (coding gene Rv3763) promoter and signal peptide, linker sequence, and the wild-type SARS-CoV-2 RBD sequence. Illustration depicting the engineering process of the RBD antigen expressed by CW-rBCG::RBD, wherein the signal peptide of 19-KD antigen undergoes cleavage by Sec/signal peptidase II at the preferred restriction site LSG, forming a mature signal peptide with the mature sequence CSSNKSTTG. The mature signal peptide, together with the RBD protein, constitutes the fusion protein expressed by CW-rBCG::RBD. (b) Western blot analysis of CW-rBCG::RBD strain to assess the presence of the RBD antigen in subcellular fractions. The RBD antigen band was observed at approximately 35–40 kDa. A negative control was established using the parent BCG Danish strain harboring an empty pMV261 vector. The subcellular constituents of the CW-rBCG::RBD are organized within the identical lanes as those observed in the control group situated on the right-hand side. Subcellular fractions were analyzed in lanes corresponding to the cell membrane and other components: lane 2 represents the Triton X-114 soluble detergent phase extracted from the precipitate; lane 3 represents the Triton X-114 aqueous phase extracted from the precipitate; lane 4 represents the Triton X-114 detergent and amphoteric phases extracted from the supernatant of cell lysate. (c) Quantification of RBD antigen content in the cell wall and membrane of CW-rBCG::RBD per 10⁷ cfu. Integrated density values of the bands were determined via western blot experiments and quantified against RBD-His protein standards using ImageJ software. Details regarding the calculation of CW-rBCG::RBD or BCG quantities used for subcellular component separation, along with corresponding volume ratios, are provided in the Methods, Supplementary Data, and Supplementary Fig. S1b–e. The RBD antigen content in the samples was calculated by estimating the final volume ratios of different subcellular components relative to the total bacterial solution volume during the separation process (Supplementary Fig. S1). (d) Flow cytometry confirmed surface expression of RBD on CW-rBCG::RBD. Shown is one representative result from three independent experiments (Supplementary Fig. S1g). Green histogram: stained with anti-RBD antibody and FITC-conjugated secondary antibody. Yellow histogram: shown background fluorescence, anti-RBD antibody only (control).
Fig. 2
Fig. 2
Intravenous immunization with CW-rBCG::RBD rapidly induces anti-RBD Nabs responses in mice. (a) Schematic overview of the immunization protocols, including the timeline and grouping for vaccination and monitoring of antibody responses across four groups of vaccinated mice. Eight-week-old BALB/c mice were immunized with indicated dose and route of CW-rBCG::RBD at week 0, or followed by a booster at week 4. Blood samples were collected at week 4 and 8 to evaluate RBD-specific IgG titers and neutralizing titers, respectively. (b-c) ELISA analysis of RBD-specific IgG titers in pooled sera from each group at weeks 4 (b) and 8 (c). CW-rBCG::RBD groups are labeled as “rBCG::RBD”, with “10⁶” indicating the standard-dose group (10⁶ cfu/ml) and “105” representing a 10-fold lower dose. Mice were immunized intravenously (i.v.), subcutaneously (s.c.), or intramuscularly (i.m.) as specified. Prime denotes the initial immunization, while Boost1 refers to the first booster dose. RBD-specific IgG titers were defined as the serum dilution factor at which the absorbance at 450 nm was twice the value of the maximum dilution from PBS-immunized controls. The dotted line represents the detection limit. All experiments were performed at least twice, with data presented as the geometric mean ± SEM from two independent experiments, using six mice per group in each. (d) Neutralizing antibody titers (NT₅₀) values at week 8 post-immunization were measured using a SARS-CoV-2 RBD pseudovirus (PsV) neutralization assay. Sera from six mice per group were pooled in equal volumes. Data are presented as geometric mean ± SEM from two independent experiments (with two replicates in experiment 1). The right panel shows percent inhibition curves used to calculate NT₅₀ values (50% inhibition of PsV infection), analyzed by non-linear regression in GraphPad Prism. Statistical significance was assessed by an one-way ANOVA. Statistical significance is indicated as   ****p < 0.0001.
Fig. 3
Fig. 3
The RBD-specific cellular immune responses elicited by the CW-rBCG::RBD compared with BCG and RBDAS01. Single-cell suspensions from spleens, inguinal lymph nodes, and lungs were pooled from six mice per group and divided into four replicates for assays at week 12. Cells were restimulated ex vivo with 2.5 µg/ml SARS-CoV-2 RBD peptide pool for 44 h, followed by flow cytometry to assess Tfh and Tcm responses. (a) Immunization schedule and experimental grouping. (b) Detection of Tfh cells (CD4+CD44+CD62L-GL7+ CXCR5+PD-1+) in boosted mice. Gating strategy and representative plots shown in Supplementary Fig. S5a–b. (c) CD4+Tcm (CD4+CD44+CD62L-) detection in the boosted group and (d) primed group; gating shown in Supplementary Fig. S4c. (e) IFN-γ–secreting cells per 10⁵ lung cells measured by ELISPOT. Two wells represent data from two independent experiments, statistical analysis was performed using a t- test. In (b)–(d), data are from two independent experiments, each with four replicates. Data are presented as mean ± SEM. Statistical analysis was performed using an one-way ANOVA, with significance indicated as *p < 0.05, **p < 0.01, ***p < 0.001, ****p < 0.0001.
Fig. 4
Fig. 4
Intravenous vaccination of CW-rBCG::RBD followed by RBDAS01 enhances Nabs production and induces Th1-biased cellular responses along with IgG2a subtype antibody generation. (a) Schematic overview of the immunization protocols. BALB/c mice were intravenously vaccinated with PBS, BCG, or CW-rBCG::RBD, followed by two doses of RBDAS01 at week 4 and 6. Whole blood was collected at week 6 after the first boost with RBDAS01, at week 8 and 16 to assess Nabs. (b, c) Neutralizing antibody titers (NT50) values at 8 weeks (b) and 12 weeks (c) post-immunization were determined using pooled sera in the SARS-CoV-2 RBD PsV neutralization assay. Sera from six mice per group were pooled in equal volumes. Data are presented as geometric mean ± SEM from two independent experiments (with two technical replicates in experiment 1). (d-f) Spleens and lungs from each group of six mice were pooled and divided into four aliquots for downstream assays. Single-cell suspensions from spleens (collected at 8 weeks) and lungs (at 12 weeks) were restimulated ex vivo with 2.5 µg/ml of a SARS-CoV-2 RBD peptide pool for 44 h. IFN-γ production by CD4+T cells (d) and CD8+T cells (e) was assessed by intracellular cytokine staining and analyzed via flow cytometry. The gating strategy is shown in Supplementary Fig. S4. Data are presented as geometric mean ± SEM from a single experiment. (f) ELISPOT assay quantifying the number of IFN-γ secreting cells per 105 lung cells, each well represents a replicate of the experimental sample. Data are presented as geometric mean ± SEM. (g-i) RBD-specific IgG (g), IgG2a (h), and IgG1 (i) titers in sera pooled from each group were measured by ELISA. Boost 1 refers to the administration of a single dose of RBDAS01 following the priming immunization. Titers were defined as the serum dilution factor at which absorbance at 450 nm was twice the value of the maximum dilution of PBS-immunized controls. The dotted line represents the detection limit. All experiments were performed at least twice. (j) The IgG2a to IgG1 ratio for all groups. (k) Bone marrow samples were collected at week 12, pooled from six mice per group, and analyzed in four replicates from a single experiment. Flow cytometry was performed to identify IgG2a+ B cells (B220+ IgD IgG2a+ RBD+). Data are presented as geometric mean ± SEM from four replicates of a representative experiment. In (b)- (c), statistical analysis was performed using an one-way ANOVA, with significance indicated as     ****p < 0.0001.
Fig. 5
Fig. 5
Subcutaneous co-administration of CW-rBCG::RBD with RBDAS01 enhances neutralizing antibodies and RBD-specific memory T cells. (a) Schematic overview of the immunization protocols. BALB/c mice were subcutaneously vaccinated in the footpad with standard-dose BCG, standard-dose CW-rBCG::RBD combined with RBDAS01 (i.m.), or RBDAS01 alone (i.m.). All groups received a subsequent boost with RBDAS01 after 2 weeks. (b, c) Neutralizing antibody titers (NT50) values were measured via a SARS-CoV-2 RBD PsV neutralization assay at 16 weeks (b) and 31 weeks (c) using the sera from six mice per group were pooled in equal volumes. Data are presented as geometric mean ± SEM from two independent experiments (with two technical replicates in experiment 1) (d, e) Memory T cell responses were assessed 12 weeks post-immunization by flow cytometry. Samples from each group were pooled and divided into four aliquots for downstream assays, resulting in four technical replicates per experiment. Spleens cells were analyzed for Tfh cells (d, CD4+ CD44+ CD62L- GL7+ CXCR5+ PD-1+), and lung cells for Tcm cells (e, CD4+ CD44+ CD62L+) following ex vivo restimulated with 2.5 µg/ml of SARS-CoV-2 RBD peptide pool. Data were obtained from two independent experiments, each involving 6 mice per group. Data are presented as geometric mean ± SEM. Significant differences between groups were determined by one-way ANOVA, with significance indicated as *p < 0.05, **p < 0.01, ***p < 0.001, ****p < 0.0001.

Similar articles

References

    1. Begnini, K. R., Buss, J. H., Collares, T. & Seixas, F. K. Recombinant Mycobacterium bovis BCG for immunotherapy in nonmuscle invasive bladder cancer. APPL. MICROBIOL. BIOT. 99, 3741 (2015). - PubMed
    1. Yuan, S. et al. Immunization with two Recombinant Bacillus Calmette-Guerin vaccines that combine the expression of multiple tandem repeats of mucin-1 and colony stimulating-factor suppress breast tumor growth in mice. J. CANCER RES. CLIN.136, 1359 (2010). - PMC - PubMed
    1. Kato, S. et al. CD8 T cells show protection against highly pathogenic Simian immunodeficiency virus (SIV) after vaccination with SIV Gene-Expressing BCG prime and vaccinia virus/Sendai virus vector boosts. J. VIROL. 95 (2021). - PMC - PubMed
    1. Uno-Furuta, S. et al. Immunization with recombinant Calmette-Guerin bacillus (BCG)-hepatitis C virus (HCV) elicits HCV-specific cytotoxic T lymphocytes in mice. VACCINE 21 3149 (2003). - PubMed
    1. Bueno, S. M. et al. Protective T cell immunity against respiratory syncytial virus is efficiently induced by recombinant BCG. Proceedings of the National Academy of Sciences - PNAS 105 20822 (2008). - PMC - PubMed

MeSH terms