

Sex differences in physical activity dose-response effects on site-specific bone mineral density during childhood and adolescence
- PMID: 40379716
- PMCID: PMC12084363
- DOI: 10.1038/s41598-025-01807-4
Sex differences in physical activity dose-response effects on site-specific bone mineral density during childhood and adolescence
Abstract
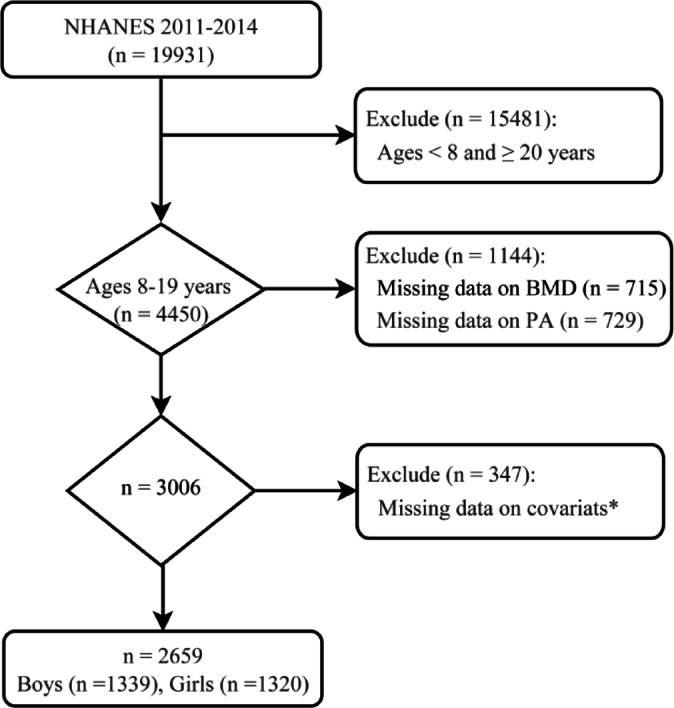
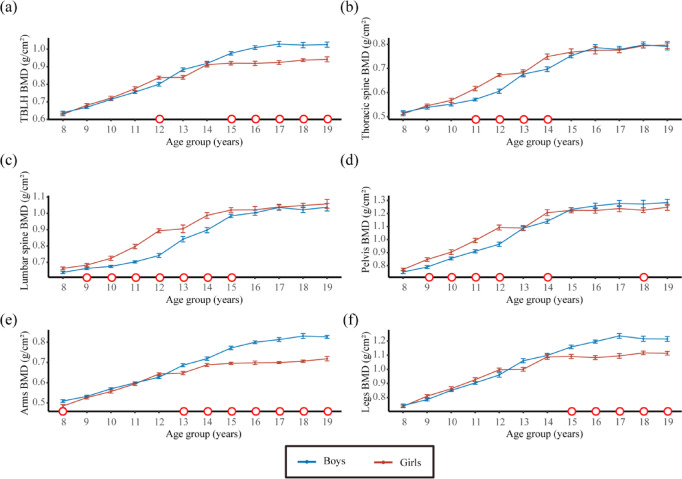
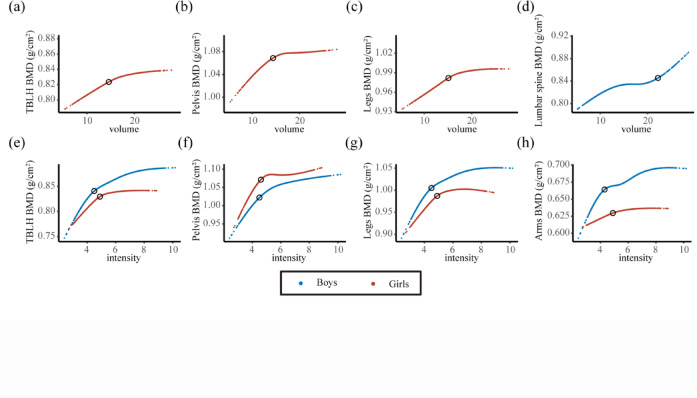
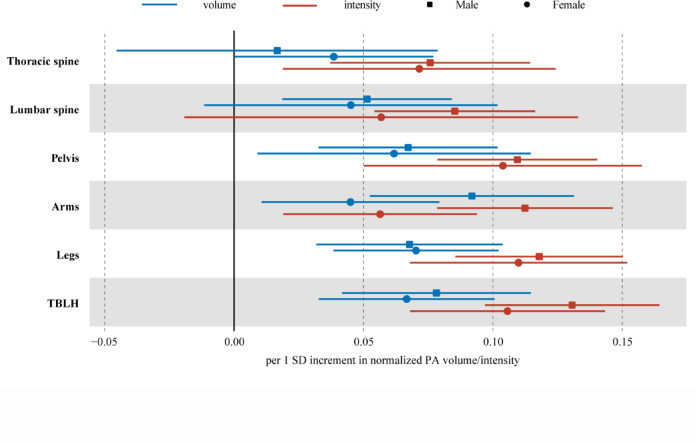
Physical activity (PA) serves as a modifiable determinant of bone mineral density (BMD). However, sex- and site-specific dose-response relationships remain poorly defined. Leveraging data from the National Health and Nutrition Examination Survey (NHANES 2011-2014), this cross-sectional study investigated sex-specific associations between accelerometer-derived PA (volume and intensity) and site-specific BMD in 2,659 children and adolescents aged 8-19 years. BMD assessment was conducted via dual-energy X-ray absorptiometry, and PA was quantified using monitor-independent movement summary units (MIMS). Linear and nonlinear analyses revealed distinct patterns: boys exhibited stronger linear associations between PA volume and BMD at weight-bearing sites (e.g., pelvis, arms, and legs; β = 0.003-0.004, P < 0.05), and girls demonstrated nonlinear thresholds (e.g., volume threshold: 15.0 × 10³ MIMS/day). Both sexes had intensity-driven thresholds (~ 45-49 MIMS/min), with diminishing returns above these values (β = 0.010 in boys; stagnation in girls). Directional trends suggest the greater BMD gains per standard deviation (SD) increase in PA for boys compared with that for girls across most skeletal regions (e.g., total body less head: 0.131 SD vs. 0.106 SD for intensity). However, statistical significance (P < 0.05) was observed only for arm BMD responses. Mechanistic analyses highlighted the corresponding biomechanical principles, with weight-bearing regions showing stronger PA-BMD links than nonweight-bearing sites (e.g., spine). These findings underscore the importance of prioritizing high-intensity, weight-bearing activities, particularly for girls, to optimize skeletal health during growth. Public health strategies should focus on achieving, rather than exceeding, the identified daily 60 min intensity thresholds (~ 45-49 MIMS/min) through school- and community-based interventions.
Keywords: Bone mineral density; Dose-response; Pediatric; Physical activity; Sex differences..
© 2025. The Author(s).
Conflict of interest statement
Declarations. Ethics approval and consent to participate: Ethical approval was obtained from the National Center for Health Statistics (NCHS) Ethics Review Board (ERB) (Protocol #2011-17, https://www.cdc.gov/nchs/nhanes/about/erb.html ). NHANES has obtained written informed consent from all participants. Competing interests: The authors declare no competing interests.
Figures
References
-
- Golden, N. H. & Abrams, S. A. Committee on N. Optimizing bone health in children and adolescents. Pediatrics134(4), e1229–e1243 (2014). - PubMed
-
- Hernandez, C. J., Beaupre, G. S. & Carter, D. R. A theoretical analysis of the relative influences of peak BMD, age-related bone loss and menopause on the development of osteoporosis. Osteoporos. Int.14(10), 843–847 (2003). - PubMed
MeSH terms
LinkOut - more resources
Full Text Sources
Medical
