Comparative Study
. 2025 May 16;15(1):17037.
doi: 10.1038/s41598-025-00969-5.

Comparison of RNA- and DNA-based 16S amplicon sequencing to find the optimal approach for the analysis of the uterine microbiome

Affiliations
Comparative Study

Comparison of RNA- and DNA-based 16S amplicon sequencing to find the optimal approach for the analysis of the uterine microbiome

Antonia I Dyroff et al. Sci Rep. .

Abstract

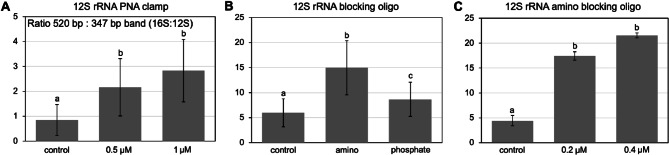
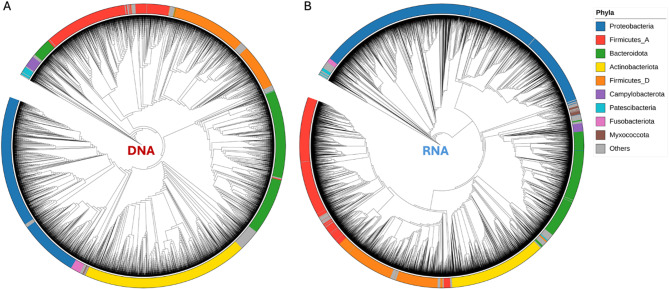
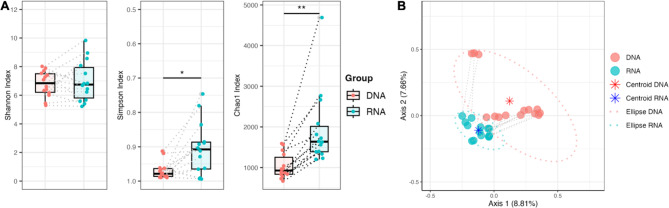
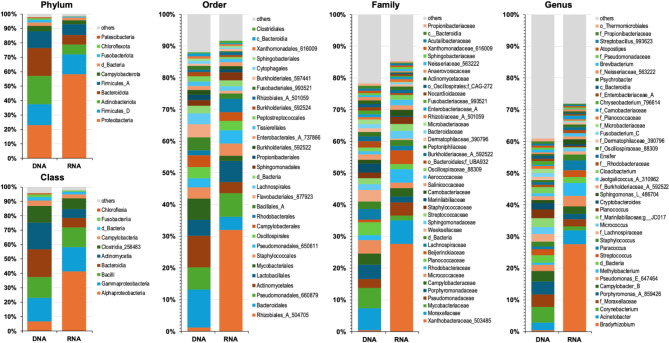
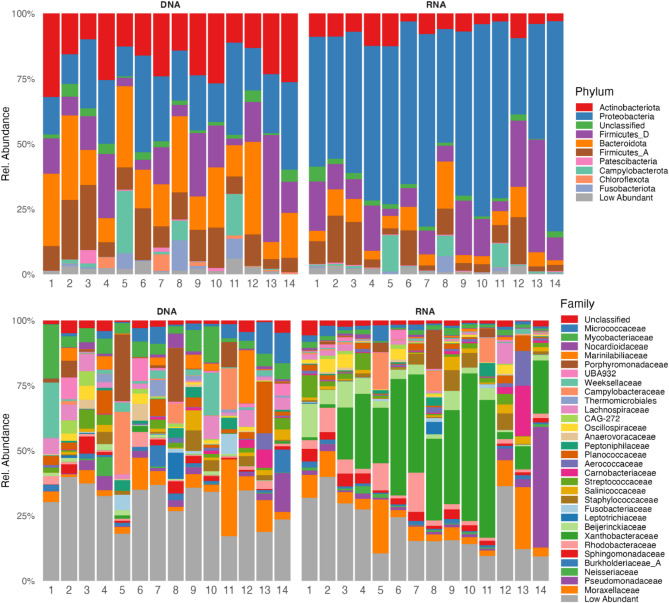
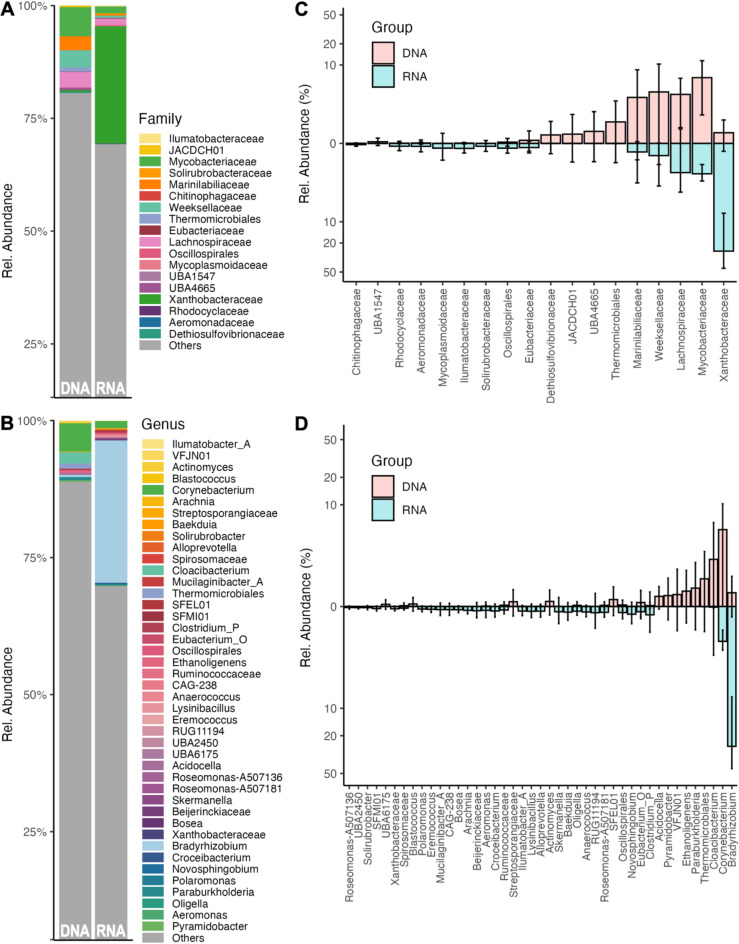
Studies in humans and large animals indicate a relationship between the uterine microbiome composition and endometrial receptivity. Despite many studies have been performed, the analysis of the uterine microbiome remains challenging due to the very low microbial biomass. Studies in other biological systems showed that RNA-based microbiome analysis complements DNA-based results and provides information about active bacteria in a sample. Thus, the aim of this study was to establish a highly sensitive and specific 16S rRNA gene V3-V4 amplicon PCR from equine uterine cytobrush samples and to compare DNA- and RNA-based 16S rRNA microbiome analysis. An optimized 16S rRNA gene V3-V4 amplicon PCR protocol from equine uterine cytobrush samples was developed, which was able to detect less than 38 bacterial genome copies using a bacterial DNA community standard. For the RNA-based amplicon generation protocol starting from cDNA, at least a 10-fold higher sensitivity was estimated compared to DNA-based approach. The comparison of using RNA and DNA isolated from the same uterine cytobrush samples as input for 16S V3-V4 amplicon sequencing revealed a much higher number of amplicon sequence variants as well as taxonomic units for the RNA-based approach. This resulted in significant differences in alpha (Simpson, Chao1) and beta diversity between RNA- and DNA-based analysis. Differential abundance analysis revealed significant differences between DNA and RNA samples at all taxonomic levels. Despite these differences, the overall microbiome composition was similar between the paired DNA and RNA samples. Many differences were probably found due to the higher sensitivity of the RNA-based approach. Furthermore, the DNA-based analysis is biased by the rRNA gene copy numbers (1-21), and the RNA-based analysis by the number of ribosomes per cell, which was reflected in the differences in the microbiome composition between the approaches. In addition, the results suggested that the DNA-based analysis is detecting cell-free bacterial DNA and/or DNA of dead bacteria that could be present in the samples. Altogether, the obtained results indicate advantages of a combined DNA- and RNA-based microbiome analysis, offering complementary and valuable information in the context of fertility-related studies of the uterine microbiome.

Keywords: Equus caballus; Bacterial viability; Endometrial health; Microbial community analysis; Reproductive pathology.


Conflict of interest statement

Declarations. Competing interests: The authors declare no competing interests. Ethics approval and consent to participate: The samples were collected from mares owned by the University of Illinois Urbana-Champaign or from client-owned mares presented at the Veterinary Hospital (IACUC ethical approvals 21237 and 21238, respectively).

Figures

Fig. 1
Fig. 1
Suppression of the unspecific amplification product derived from the equine mitochondrial 12S rRNA gene. (A) 12S rRNA gene peptide nucleic acid (PNA) PCR clamp at concentrations of 0.5 and 1 µM. (B) Oligonucleotide blocking the Pro805R primer binding site in the equine mitochondrial 12S rRNA gene with 3’-amino or -phosphate modification (0.2 µM final concentration). (C) 12 S rRNA gene blocking oligonucleotide with 3’-amino modification at a final concentration of 0.2 and 0.4 µM. Imaging and quantification were performed with the ChemiDoc MP system (302 nm UV transilluminator) and ImageLab software v.6.1. (Bio-Rad Laboratories). The ratio between the 16S rRNA V3-V4 amplicon product and the unspecific amplification product was calculated from background-subtracted band intensities. Different letters indicate significant differences (Student’s t-test).
Fig. 2
Fig. 2
Phylogenetic tree reconstruction of all ASVs for DNA- (A) and RNA-based (B) analysis. Phylogenetic trees for DNA and RNA samples were constructed with FastTree, and the rooted trees were generated using iTOL. The nine most abundant phyla are indicated in different colors in the outer ring.
Fig. 3
Fig. 3
Comparison of alpha- and beta-diversity between DNA- and RNA-based 16S rRNA amplicon sequencing results. (A) Comparison of alpha-diversity between DNA- and RNA-based analysis for Shannon, Simpson, and Chao1 indices. (B) Principal coordinate analysis (PCoA) illustrating beta diversity of DNA and RNA samples was performed using Jaccard distance. Centroids and ellipses were calculated to depict location and dispersion. Each sample is represented by a dot and dotted lines connect paired samples.
Fig. 4
Fig. 4
Taxonomic composition for DNA- and RNA-based 16S rRNA analysis. The taxonomy bar plots show the average taxonomic composition of DNA and RNA samples for the taxonomic levels: phylum, class, order, family, and genus.
Fig. 5
Fig. 5
Taxonomic composition of individual DNA and RNA samples. Taxa with a relative abundance of > 5% in at least one sample are shown (10 most abundant for phylum and 31 most abundant taxa for family).
Fig. 6
Fig. 6
Identification of differentially abundant taxa between DNA- and RNA-based 16S rRNA analysis. (A) and (B) Taxonomy bar plots showing differentially abundant taxa between DNA and RNA samples at family (level 4) and genus (level 6) level, respectively. (C) and (D) Box plots showing the relative abundance of differentially abundant taxa between DNA and RNA samples for the family and the genus level, respectively. Y-axis is in logarithmic scale (log 10).

Similar articles

References

    1. Stinson, L. F., Boyce, M. C., Payne, M. S. & Keelan, J. A. The Not-so-Sterile womb: evidence that the human fetus is exposed to Bacteria prior to birth. Front. Microbiol.10, 1124. 10.3389/fmicb.2019.01124 (2019). - PMC - PubMed
    1. Franasiak, J. M. et al. Endometrial Microbiome at the time of embryo transfer: next-generation sequencing of the 16S ribosomal subunit. J. Assist. Reprod. Genet.33, 129–136. 10.1007/s10815-015-0614-z (2016). - PMC - PubMed
    1. Baker, J. M., Chase, D. M. & Herbst-Kralovetz, M. M. Uterine microbiota: residents, tourists, or invaders?? Front. Immunol.9, 208. 10.3389/fimmu.2018.00208 (2018). - PMC - PubMed
    1. Banchi, P., Colitti, B., Opsomer, G., Rota, A. & Van Soom, A. The dogma of the sterile uterus revisited: Does microbial seeding occur during fetal life in humans and animals? Reproduction16710.1530/REP-23-0078 (2024). - PMC - PubMed
    1. Garcia-Grau, I., Simon, C. & Moreno, I. Uterine microbiome-low biomass and high Expectationsdagger. Biol. Reprod.101, 1102–1114. 10.1093/biolre/ioy257 (2019). - PubMed

Publication types