

FISH unveils a unified method for multi-marker biodose assessment
- PMID: 40379733
- PMCID: PMC12084291
- DOI: 10.1038/s41598-025-87549-9
FISH unveils a unified method for multi-marker biodose assessment
Abstract
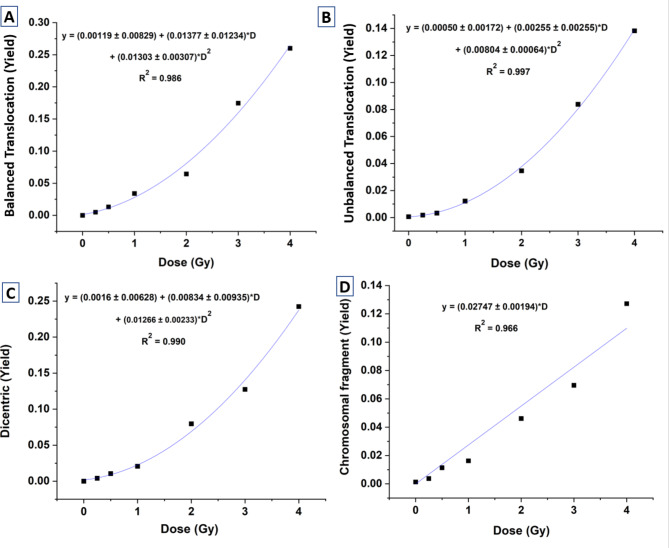
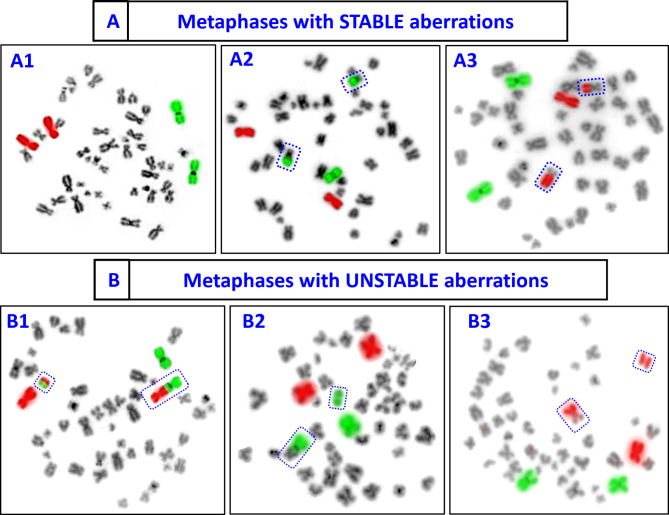
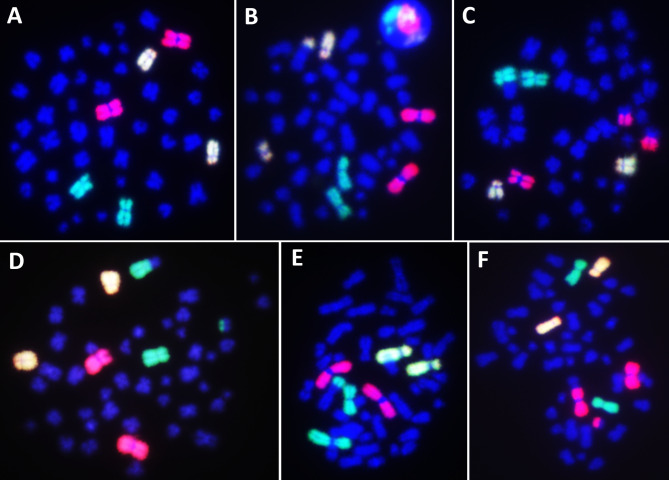
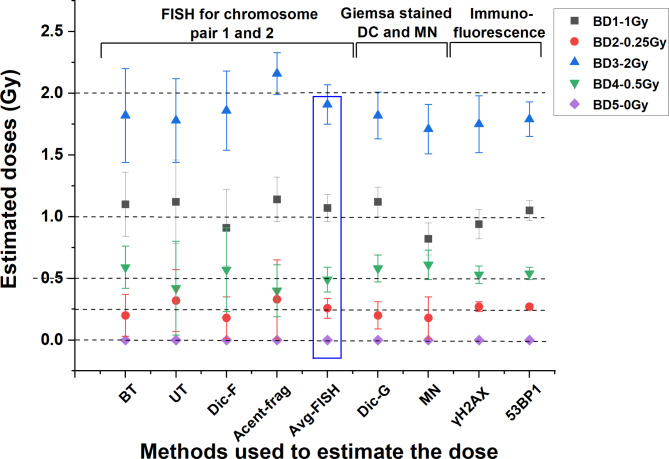
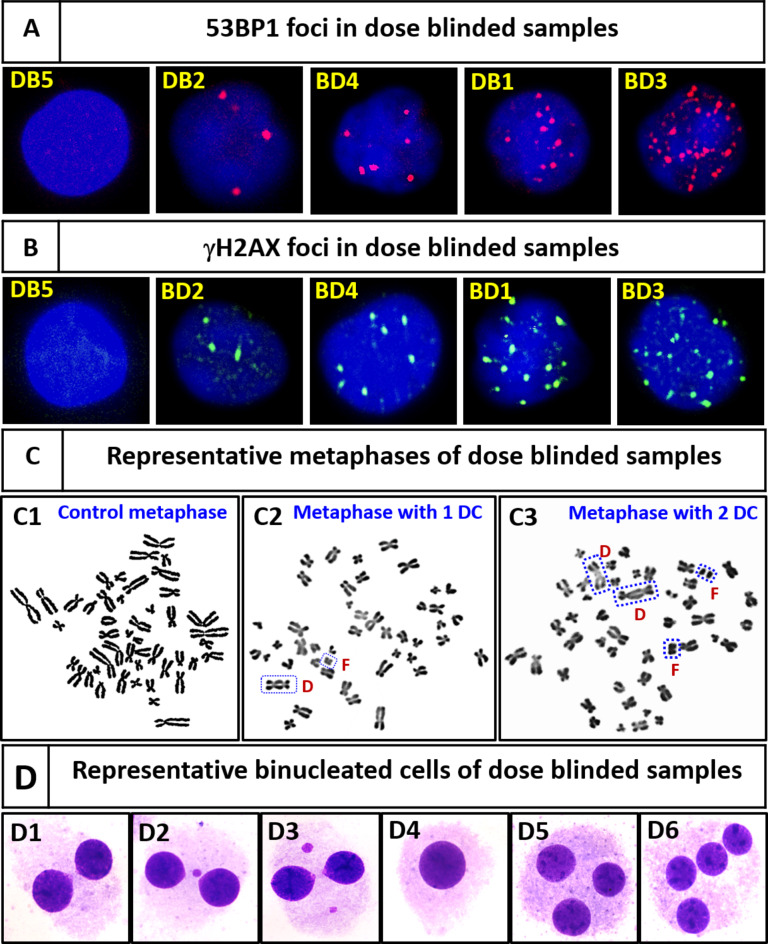
Accurate dose assessment following radiation disasters or accidents is crucial for informed medical interventions. Cytogenetic biomarkers, such as dicentrics (dic), translocations, and chromosomal fragments, are essential for radiation biodosimetry in various exposure scenarios. However, quantifying these markers via separate staining and detection methods presents challenges in terms of efficiency and consistency. This study aimed to quantify multiple cytogenetic markers, including dic, balanced and unbalanced translocations and acentric fragments, from the same metaphases via fluorescence in situ hybridization (FISH). By enabling multimarker dose estimation from a single sample, this approach minimizes interexperimental variation and improves overall accuracy. Independent calibration curves were generated for each marker, enabling precise dose estimation with smaller class intervals, in accordance with the IAEA and ISO guidelines. The method was validated by estimating doses for five blinded samples via both standard cytogenetic methods and protein biomarkers (γH2AX and 53BP1). The multimarker approach yielded the closest estimates with 2-7% variation from true doses, providing the most accurate results among all cytogenetic techniques. This unified FISH-based approach enhances the precision of dose estimation for both recent and past radiation exposures, offering a more reliable tool for diverse biodosimetry applications.
Keywords: Cytogenetic markers; Dose-repose-calibration curve; Fluorescence in situ hybridization (FISH); Human radiation-exposure-dosimetry; Retrospective biodosimetry.
© 2025. The Author(s).
Conflict of interest statement
Competing interests: The authors declare no competing interests. Ethics statement: This study was performed in accordance with the principles of the Declaration of BARC ethical committee. Approval was granted by institutional ethical committee of Bhabha Atomic Research Centre.
Figures


Similar articles
-
Construction of fluorescence in situ hybridization (FISH) translocation dose-response calibration curve with multiple donor data sets using R, based on ISO 20046:2019 recommendations.Int J Radiat Biol. 2019 Dec;95(12):1668-1684. doi: 10.1080/09553002.2019.1664788. Epub 2019 Sep 24. Int J Radiat Biol. 2019. PMID: 31550191
-
Multifaceted applications of pre-mature chromosome condensation in radiation biodosimetry.Int J Radiat Biol. 2020 Oct;96(10):1274-1280. doi: 10.1080/09553002.2020.1798545. Epub 2020 Aug 3. Int J Radiat Biol. 2020. PMID: 32689847
-
Reconstruction of doses from ionizing radiation using fluorescence in situ hybridization techniques.Br J Radiol. 2007 Sep;80 Spec No 1:S63-7. doi: 10.1259/bjr/24766640. Br J Radiol. 2007. PMID: 17704328 Review.
-
Application of FISH based G2-PCC assay for the cytogenetic assessment of high radiation dose exposures: Potential implications for rapid triage biodosimetry.PLoS One. 2024 Oct 25;19(10):e0312564. doi: 10.1371/journal.pone.0312564. eCollection 2024. PLoS One. 2024. PMID: 39453904 Free PMC article.
-
Health impacts of large releases of radionuclides. Cytogenetic effects as quantitative indicators of radiation exposure.Ciba Found Symp. 1997;203:188-99; discussion 199-204, 232-4. Ciba Found Symp. 1997. PMID: 9339319 Review.
Cited by
-
First evidence of coexistence of Pseudo Pelger Huet anomaly and balanced translocation in a two decades retrospectively exposed human subject.Sci Rep. 2025 Aug 11;15(1):29292. doi: 10.1038/s41598-025-14858-4. Sci Rep. 2025. PMID: 40790071 Free PMC article.
References
-
- Henriksen, T. & Maillie, D. H. Radiation and Health (CRC, 2002).
-
- Chaurasia, R. K., Sapra, B. K. & Aswal, D. K. Interplay of Immune Modulation, Adaptive Response and Hormesis: Suggestive of Threshold for Clinical Manifestation of Effects of Ionizing Radiation at low Doses? 170178 (Science of The Total Environment, 2024). - PubMed
-
- Frane, N. & Bitterman, A. Radiation Safety and Protection (Wiley, 2020). - PubMed
-
- Izewska, J. & Rajan, G. Radiation Dosimeters. Radiation Oncology Physics: A Handbook for Teachers and Students 71–99 (2005).
MeSH terms
Substances
LinkOut - more resources
Full Text Sources
Miscellaneous
