. 2025 Jun;57(6):1374-1388.
doi: 10.1038/s41588-025-02184-4. Epub 2025 May 16.

Dominant variants in major spliceosome U4 and U5 small nuclear RNA genes cause neurodevelopmental disorders through splicing disruption

Caroline Nava #  1   2   3 Benjamin Cogne #  4   5   6 Amandine Santini #  7 Elsa Leitão  8 François Lecoquierre  4   9 Yuyang Chen  10   11 Sarah L Stenton  12   13 Thomas Besnard  5   6 Solveig Heide  14 Sarah Baer  15   16 Abhilasha Jakhar  17   18 Sonja Neuser  19 Boris Keren  14   4 Anne Faudet  14 Sylvie Forlani  20 Marie Faoucher  4   21   22   23 Kevin Uguen  4   24   25 Konrad Platzer  19 Alexandra Afenjar  26 Jean-Luc Alessandri  27 Stephanie Andres  28 Chloé Angelini  29 Bernard Aral  23   30 Benoit Arveiler  29   31 Tania Attie-Bitach  4   32   33 Marion Aubert Mucca  34 Guillaume Banneau  23   34 Tahsin Stefan Barakat  35   36 Giulia Barcia  4   32   33 Stéphanie Baulac  20 Claire Beneteau  23   29 Fouzia Benkerdou  14 Virginie Bernard  23 Stéphane Bézieau  5   6 Dominique Bonneau  37   38 Marie-Noelle Bonnet-Dupeyron  39 Simon Boussion  40 Odile Boute  40 Elise Brischoux-Boucher  41 Samantha J Bryen  42   43 Julien Buratti  14 Tiffany Busa  44 Almuth Caliebe  45 Yline Capri  46 Kévin Cassinari  4   9 Roseline Caumes  40 Camille Cenni  47 Pascal Chambon  4   9 Perrine Charles  14 John Christodoulou  48   49 Cindy Colson  40 Solène Conrad  5 Auriane Cospain  21 Juliette Coursimault  9 Thomas Courtin  32   33 Madeline Couse  50 Charles Coutton  23   51   52 Isabelle Creveaux  23   53 Alissa M D'Gama  54   55   56   57 Benjamin Dauriat  23   58 Jean-Madeleine de Sainte Agathe  14   4 Giulia Del Gobbo  59 Andrée Delahaye-Duriez  4   60   61   62 Julian Delanne  63   64 Anne-Sophie Denommé-Pichon  23   64   65 Anne Dieux-Coeslier  40 Laura Do Souto Ferreira  5 Martine Doco-Fenzy  5   23   66 Stephan Drukewitz  19 Véronique Duboc  67 Christèle Dubourg  4   21   22 Yannis Duffourd  64   65 David Dyment  59 Salima El Chehadeh  68 Monique Elmaleh  69 Laurence Faivre  63   64 Samuel Fennelly  29 Hanna Fischer  70 Mélanie Fradin  71 Camille Galludec Vaillant  14 Benjamin Ganne  23   72 Jamal Ghoumid  40 Himanshu Goel  73   74 Zeynep Gokce-Samar  75   76 Alice Goldenberg  9 Romain Gonfreville Robert  5 Svetlana Gorokhova  23   44   77 Louise Goujon  46 Victoria Granier  34 Mathilde Gras  14 John M Greally  78 Bianca Greiten  45 Paul Gueguen  4   79   80 Anne-Marie Guerrot  9 Saurav Guha  81 Anne Guimier  32   33 Tobias B Haack  82 Hamza Hadj Abdallah  4   32   33 Yosra Halleb  83 Radu Harbuz  23   51   52 Madeleine Harris  49 Julia Hentschel  19 Bénédicte Héron  84 Marc-Phillip Hitz  45   85 A Micheil Innes  86   87 Vincent Jadas  88 Louis Januel  23   89 Nolwenn Jean-Marçais  71 Vaidehi Jobanputra  81   90 Florence Jobic  91 Ludmila Jornea  20 Céline Jost  63   64 Sophie Julia  34 Frank J Kaiser  8   92 Daniel Kaschta  45 Sabine Kaya  8 Petra Ketteler  8   93 Bochra Khadija  8   94   95 Fabian Kilpert  8 Cordula Knopp  96 Florian Kraft  96 Ilona Krey  19 Marilyn Lackmy  97 Fanny Laffargue  98 Laetitia Lambert  99   100 Ryan Lamont  86   87 Vincent Laugel  15 Steven Laurie  101 Julie L Lauzon  86   87 Louis Lebreton  23   102 Marine Lebrun  23   103 Marine Legendre  29 Eric Leguern  20   14 Daphné Lehalle  14 Elodie Lejeune  14 Gaetan Lesca  23   89   104 Marion Lesieur-Sebellin  4   32   33 Jonathan Levy  4   46 Agnès Linglart  105   106   107 Stanislas Lyonnet  32   33 Kevin Lüthy  8 Alan S Ma  108   109 Corinne Mach  14 Jean-Louis Mandel  16 Lamisse Mansour-Hendili  4 Julien Marcadier  86 Victor Marin  23   102 Henri Margot  23   29   31 Valentine Marquet  23   58 Angèle May  9 Johannes A Mayr  110 Catherine Meridda  111 Vincent Michaud  23   29   31 Caroline Michot  32   33 Gwenael Nadeau  112 Sophie Naudion  29 Laetitia Nguyen  14 Mathilde Nizon  5 Frédérique Nowak  113 Sylvie Odent  22   71 Valerie Olin  14 Ikeoluwa A Osei-Owusu  12 Matthew Osmond  59 Katrin Õunap  114   115 Laurent Pasquier  71 Sandrine Passemard  62   116 Melissa Pauly  117 Olivier Patat  34 Marine Pensec  25 Laurence Perrin-Sabourin  46 Florence Petit  40 Christophe Philippe  23   118 Marc Planes  25 Annapurna Poduri  54   57   119 Céline Poirsier  120 Antoine Pouzet  46 Bradley Prince  86 Clément Prouteau  37 Aurora Pujol  121   122   123 Caroline Racine  63   64 Mélanie Rama  23   40 Francis Ramond  23   103 Kara Ranguin  124 Margaux Raway  41 André Reis  117   125 Mathilde Renaud  99   100 Nicole Revencu  126 Anne-Claire Richard  9 Lucile Riera-Navarro  67 Rocio Rius  42   43   48 Diana Rodriguez  84   127 Agustí Rodriguez-Palmero  128 Sophie Rondeau  4   32   33 Annika Roser-Unruh  129 Christelle Rougeot Jung  130 Hana Safraou  23   64   65 Véronique Satre  23   51   52 Pascale Saugier-Veber  4   9 Clément Sauvestre  29 Elise Schaefer  68 Wanqing Shao  57 Ina Schanze  131 Jan-Ulrich Schlump  132   133 Agatha Schlüter Martin  121   122 Caroline Schluth-Bolard  23   134   135 Sarah Schuhmann  117 Christopher Schröder  8 Monisha Sebastin  78 Sabine Sigaudy  44 Malte Spielmann  45 Marta Spodenkiewicz  136 Laura St Clair  108 Julie Steffann  4   32   33 Radka Stoeva  83 Harald Surowy  8 Mark A Tarnopolsky  137 Calina Todosi  138   139 Annick Toutain  140 Frédéric Tran Mau-Them  23   64   65   141 Astrid Unterlauft  142 Julien Van-Gils  29   31 Clémence Vanlerberghe  40 Georgia Vasileiou  117   125 Gabriella Vera  9 André Verdel  52 Alain Verloes  46   62   143 Yoann Vial  4   46   62 Cédric Vignal  46 Marie Vincent  5 Catherine Vincent-Delorme  40 Aline Vincent-Devulder  111 Antonio Vitobello  23   64   65 Sacha Weber  111 Marjolaine Willems  144 Khaoula Zaafrane-Khachnaoui  67 Pia Zacher  145 Lena Zeltner  146 Alban Ziegler  23   147 Wojciech P Galej  148 Hélène Dollfus  68   135 Christel Thauvin  63   64   65 Kym M Boycott  59   149 Pierre Marijon  4 Alban Lermine  4 Valérie Malan  4   32   33 Marlène Rio  32   33 Alma Kuechler  8 Bertrand Isidor  5 Séverine Drunat  4   46   62 Thomas Smol  4   40 Nicolas Chatron  23   89   104 Amélie Piton  16   23   134 Gael Nicolas  4   9 Matias Wagner  150   151   152 Rami Abou Jamra  19 Delphine Héron  14   143 Cyril Mignot  14   143 Pierre Blanc  4 Anne O'Donnell-Luria  12   13   153 Nicola Whiffin  10   11   12 Camille Charbonnier  154 Clément Charenton  17   18 Julien Thevenon  23   51   52 Christel Depienne  155   156
Affiliations

Dominant variants in major spliceosome U4 and U5 small nuclear RNA genes cause neurodevelopmental disorders through splicing disruption

Caroline Nava et al. Nat Genet. 2025 Jun.

Abstract

The major spliceosome contains five small nuclear RNAs (snRNAs; U1, U2, U4, U5 and U6) essential for splicing. Variants in RNU4-2, encoding U4, cause a neurodevelopmental disorder called ReNU syndrome. We investigated de novo variants in 50 snRNA-encoding genes in a French cohort of 23,649 individuals with rare disorders and gathered additional cases through international collaborations. Altogether, we identified 145 previously unreported probands with (likely) pathogenic variants in RNU4-2 and 21 individuals with de novo and/or recurrent variants in RNU5B-1 and RNU5A-1, encoding U5. Pathogenic variants typically arose de novo on the maternal allele and cluster in regions critical for splicing. RNU4-2 variants mainly localize to two structures, the stem III and T-loop/quasi-pseudoknot, which position the U6 ACAGAGA box for 5' splice site recognition and associate with different phenotypic severity. RNU4-2 variants result in specific defects in alternative 5' splice site usage and methylation patterns (episignatures) that correlate with variant location and clinical severity. This study establishes RNU5B-1 as a neurodevelopmental disorder gene, suggests RNU5A-1 as a strong candidate and highlights the role of de novo variants in snRNAs.


Conflict of interest statement

Competing interests: N.W. receives research funding from Novo Nordisk and has consulted for ArgoBio Studio. A.O’D.-L. is on the scientific advisory board for Congenica, was a paid consultant for Tome Biosciences and Ono Pharma USA, and at present for Addition Therapeutics, and received reagents from PacBio to support rare disease research. V. Jobanputra has served as a consultant to Illumina and received consulting fees from the company. All other authors declare no competing interests.

Figures

Fig. 1
Fig. 1. Overview of RNU4-2 variants identified in this study.
a, Two-dimensional predicted structure of the interaction between U4 (red) and U6 (orange) snRNAs showing distinct domains. Arrowheads indicate variants identified in this study; P and LP in black, and VUS in gray. The numbers in black within the zoom-in box represent the count of patients with each variant for nucleotide changes that occur more than once. Red and orange numbers refer to the numbering of nucleotides from each snRNA. Red-shaded region, 18-bp critical region; gray-shaded regions, Sm sites. b, Organization of the U4–U6 duplex at the tri-snRNP stage (PDB ID: 6QW6) and close-up views of stem III, RBM42 binding and quasi-pseudoknot regions. Interactions stabilizing these structures, as well as LP/P variants potentially affecting their stability, are represented. Ψ, pseudouridine; m, 2′-O-methyl residues; m6, N6-methyladenosine; 2,2,7m3Gppp, 2,2,7-trimethylguanosine cap; mpppG, 5′ guanosine triphosphate cap with γ-monomethyl phosphate.
Fig. 2
Fig. 2. Overview of RNU5A-1, RNU5B-1, RNU5E-1 and RNU5F-1 variants identified in this study.
a, Two-dimensional predicted structure of U5 (light blue) snRNA showing distinct domains. Arrowheads indicate variants identified in this study—pink, RNU5A-1; dark blue, RNU5B-1; green, RNU5E-1 and yellow, RNU5F-1. P and LP variants are indicated with a filled color, while VUS are marked with a white dot inside the arrowheads. Numbers near the arrowheads represent the count of patients with each variant for nucleotide changes that occur more than once. Nucleotide differences between RNU5A-1, RNU5B-1, RNU5E-1 and RNU5F-1 are shown using International Union of Pure and Applied Chemistry (IUPAC) codes, except for the highly variable 3′ stem loop II, for which separate loops are displayed. Light blue numbers refer to the numbering of nucleotides from each snRNA. The N at position 79 corresponds to a gap in RNU5F-1. Blue-shaded region, critical region. Gray-shaded region, Sm site. b, The 5′ exon recognition by the U5 stem loop I at the B-complex stage (PDB ID: 8Q7N). Interactions stabilizing these structures, as well as LP/P variants potentially affecting their stability, are represented.
Fig. 3
Fig. 3. RNU4-2 variants in the T-loop and stem III associate with different phenotype severity.
a, PCA of 44 phenotypic features in 143 patients showing the separation of variants with respect to their location within distinct U4:U6 domains. Labels with the nucleotide change appear for variants other than n.64_65insT. RNU4-2 variants are colored according to their location within the distinct U4:U6 domains; stem I (n = 1) in light blue, quasi-pseudoknot (n = 119) in orange, RBM42 interaction region (n = 4) in blue and stem III (n = 19) in green. Triangles, P (n = 128) variants; squares, LP (n = 15) variants. b, Contributions of the clinical features to the PCA. c, Comparative analysis of 14 phenotypes related to RNU4-2 n.64_65insT and n.76C>T variants. The P values were calculated using Fisher’s exact tests (two-sided; 2 × 2, 2 × 3 or 2 × 4 contingency tables) to compare 41 phenotypes between patients with n.64_65insT variants and those in the other three variant groups. Multiple comparisons were adjusted for using Bonferroni correction. The percentage of patients with the feature, followed by the numerator (number of affected patients) and denominator (total assessed), is shown directly in the bars. Full details of all tests and patient numbers can be found in Supplementary Table 8.
Fig. 4
Fig. 4. Facial photographs from 22 patients with the recurrent RNU4-2 c.64_65insT variant.
av, The main facial features include a large mouth, a short philtrum, downturned corners of the mouth, thick lips, deep-set eyes, sparse eyebrows and strabismus. Older individuals also showed facial asymmetry. av correspond to unrelated patients except p and q who are monozygotic twins. Consent forms have been obtained for the publication of the facial photographs.
Fig. 5
Fig. 5. Facial photographs from 13 patients with other variants in RNU4-2 and two patients with variants in RNU5B-1.
a, Individuals with other variants in RNU4-2. (i), n.65A>G; (ii)–(iv), n.66A>G; (v) and (vi), n.67A>G; (vii), n.68A>C; (viii)–(x), n.76C>T; (xi), n.77_78insG; (xii) and (xiii), n.77_78insT. b, Individuals with the RNU5B-1 n.39C>G variant (i and ii). Consent forms have been obtained for the publication of the facial photographs.
Fig. 6
Fig. 6. RNA-seq identifies an alternative 5′SS signature that differentiates severe from mild RNU4-2-related phenotypes.
a, PCA based on PSI values from 111 significant 5′SS events detected using rMATS, comparing 19 patients with RNU4-2 variants (6 mildly affected in teal and 13 severely affected in red) to 21 controls (purple). Triangles, n.64_65insT; circles, other variants. Yellow symbols correspond to three test samples—one variant of uncertain significance (VUS; n.45_46insT), one VUS that could be reclassified as LP and the recurrent variant n.64_65insT from a patient with a milder phenotype. b, Box plot showing raw spliceAI scores of the decreased 5′SS site and the increased 5′SS for the 50 events shared between mild (n = 6) and severe individuals (n = 13) and the 19 events only detected in severe individuals. SpliceAI scores for severe and shared 5′SS were not statistically different for decreased sites (P = 0.476) but were significant for increased sites (P = 0.014) using the two-sided Mann–Whitney U test. Box plot elements are defined as follows: centerline, median; box limits, upper and lower quartiles; whiskers, 1.5× interquartile range; points, outliers. c,d, Sashimi plots showing isoform shifts in MAP4K4 (c) and AKNA (d). Aggregated coverage and splicing-supporting reads from patients with RNU4-2 variants with mild (n.75C>G, n.76C>T and n.72_73del; n = 6) or severe (n.64_65insT, n.67A>G, n.68A>C and n.70T>C; n = 13) phenotypes and controls (n = 21) are shown. The MAP4K4 event is present in both patient groups, while the AKNA abnormality appears only in severe cases. e, Consensus nucleotide sequence of decreased and increased 5′SS for 50 shared events (left) and for the 19 severe-only events (right), in comparison to the consensus sequence of all 5′SS from MANE transcripts (top).
Fig. 7
Fig. 7. Identification of an episignature that discriminates patients with ReNU syndrome from controls and correlates with phenotypic severity.
a, PCA of adjusted methylation levels at differentially methylated positions (n = 147), after correcting for expected methylation based on age, sex and estimated blood cell counts (n = 80 individuals in total). Different variants are represented by different shapes, while phenotype severity is indicated by color—purple for controls (n = 45), teal for mild phenotypes (n = 5) and red for moderate-to-severe phenotypes (n = 30). The percentage of variance explained is provided for each axis. b, Pathogenicity scores for each variant were obtained by fivefold cross-validation using a support vector machine predictor. Purple, controls; teal, RNU4-2 variants, mild phenotypes; red, RNU4-2 variants, moderate-to-severe phenotypes; yellow, RNU5A-1 variants. c, Heatmap of adjusted methylation levels displays hierarchical clustering of controls and patients with RNU4-2 LP/P variants. Blue indicates hypomethylated positions (n = 89), while red indicates hypermethylated positions (n = 58) with respect to expected methylation levels at equivalent age, sex and blood cell composition. Variants are colored according to the location within the distinct U4:U6 domains (stem I, light blue; quasi-pseudoknot, orange; RBM42 interaction region, blue; stem III, green). Phenotype severity is indicated by color (purple for controls, teal for mild phenotypes and red for moderate-to-severe phenotypes).
Extended Data Fig. 1
Extended Data Fig. 1. Conservation and constraints of genes encoding U4 and U5.
a, Correspondence between the alignment of RNU4-2 sequences from distinct species (top), the alignment of human RNU4-2 and RNU4-1 (middle) and the allele counts from RNU4-2 and RNU4-1 variants in gnomAD v4.1.0 (bottom). The 18-bp critical region from ref. is highlighted in gray and the Sm site in dark green. b, Correspondence between the alignment of RNU5B-1 sequences from distinct species (top), the alignment of human RNU5A-1, RNU5B-1, RNU5E-1 and RNU5F-1 (middle) and their allele counts in gnomAD v4.1.0 (bottom). The 5′ loop I and Sm regions are highlighted in gray and dark green, respectively. The threshold for consensus is 100% identity. Nucleotides in red, blue, yellow and green are shown only for positions with 100% agreement between all sequences. Other nucleotides are in black (consensus, also using IUPAC codes) or gray (sequences). Arrowheads indicate variants from this study (pathogenic and likely pathogenic in black, variants of uncertain significance (VUS) in gray). Pseudouridine (yellow), 2′-O-methyl residues (teal); N6-methyladenosine (gray). Regions without variants in gnomAD v4.1.0 are shaded light red.
Extended Data Fig. 2
Extended Data Fig. 2. Expression of the different genes encoding U4 and U5 genes in multiple brain regions.
a, RNU4-2 is more highly expressed than RNU4-1 in all brain regions studied. Minus strand tracks (−) were auto-scaled, and each of their maximum was set to the plus strand (+). b,c, RNU5A-1 and RNU5B-1 are both highly expressed in the brain, while RNU5E-1 is much less expressed. The expression of RNU5D-1 and RNU5F-1 in the brain is negligible. b, Plus strand track maximum at RNU5A-1 from each tissue was set to the minus strand and kept for all genes. c, Auto-scale was allowed for each tissue and gene. Small RNA data were generated by the ENCODE Consortium for different human embryonic brain regions—diencephalon (GSE78292), temporal lobe (GSE78303), occipital lobe (GSE78298), frontal cortex (GSE78293), parietal lobe (GSE78299) and cerebellum (GSE78291). Tracks show unique read signals for plus and minus strands from the default anisogenic replicate.
Extended Data Fig. 3
Extended Data Fig. 3. RNU4-2 genotype–phenotype correlations.
a, Hierarchical clustering of the clinical features (n = 44, rows) of patients with pathogenic (P) and likely pathogenic (LP) RNU4-2 variants (n = 129, columns). Categorical data were converted to 0–1 scale, and values were z-score scaled for each row. Blue–yellow–red scale depicts z scores. Lower values indicate a more favorable phenotype, while higher values represent a more severe phenotype. Missing values are shown in gray. Columns are colored based on the variant classification (purple, pathogenic; light purple, likely pathogenic), its location within the distinct U4:U6 domains (stem I, light blue; quasi-pseudoknot, orange; RBM42 interaction region, blue; stem III, green) and the nucleotide change (color shades related to their position within the respective U4:U6 domain). Rows are colored on the category of the clinical feature (shades of pink and green). bd, Details of the principal component analysis of clinical features associated with RNU4-2 LP/P variants presented in Fig. 3a. b, Percentage of explained variance by the first 10 principal components (PC). c, Top clinical features contributing to PC1. d, Top clinical features contributing to PC2. The horizontal red line represents the expected level of contribution if the contributions were uniform. Only variables with values above the red line are shown.
Extended Data Fig. 4
Extended Data Fig. 4. Overview of the clinical characteristics of patients with RNU4-2 LP/P variants.
a, Aggregated clinical features of the whole cohort. b, Comparison of phenotypes related to RNU4-2 variants in the T-loop and stem III domains. The P values were calculated using Fisher’s exact tests (two-sided 2 × 2, 2 × 3 or 2 × 4 contingency tables) to compare 41 phenotypes between patients with n.64_65insT variants to those in the other three variant groups. Multiple comparisons were adjusted using the Bonferroni correction. Triangles, depletion (2 × 2 contingency tables); asterisks, significant difference (2 × 3 or 2 × 4 contingency tables). The percentage of patients with the feature, followed by the numerator (number of affected patients) and denominator (total assessed), are shown directly in the bars. For full details on all tests and patients numbers, please refer to Supplementary Table 8.
Extended Data Fig. 5
Extended Data Fig. 5. Photographs of hands and feet of patients with RNU4-2 or RNU5B-1 LP/P variants.
a, Individuals with the RNU4-2 n.64_65insT variant. Please note the presence of vasomotor disorders (h,n), foot edema (o) and long fingers (h,i,p,q). The patient identification letters are the same as in Fig. 4. b, Individuals with other variants in RNU4-2. (i), n.65A>G; (iii) and (iv), n.66A>G; (v), n.67A>G; (viii)–(x), n.76C>T; (xii), n.77_78insT. The patient identification letters are the same as in Fig. 5a. c, Individual with the RNU5B-1 n.39C>G variant. The patient identification letters are the same as in Fig. 5b.
Extended Data Fig. 6
Extended Data Fig. 6. Principal component analysis using PSI values of significant splicing events detected using rMATS.
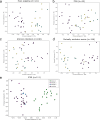
ad, PCA of splicing events other than those altering the 5′SS in patients with RNU4-2 variants. PCA was performed using PSI values of significant calls (FDR < 0.1) with a |deltaPSI| >0.05 for exon skipping (a, n = 121), alternative 3′ splice sites (b, n = 35, 3′SS), intronic retention (c, n = 100), or mutually exclusive exons (d, n = 126). Purple, controls; teal, RNU4-2 n.64_65insT; yellow, other variants. e, PCA showing the RNU4-2 5′SS signature (111 events) applied to U5 variants. RNU5B-1 (n = 4) and RNU5A-1 (n = 2) variants cluster with controls, indicating that they do not share the 5′SS signature of RNU4-2. Purple, controls; green, RNU4-2 variants; blue, RNU5B-1 variants; pink, RNU5A-1 variants.
Extended Data Fig. 7
Extended Data Fig. 7. Splicing analysis of 5′SS and 3′SS events in patients with RNU5B-1 variants.
ad, Significant alternative 5′SS and 3′SS events (FDR < 0.1) were called for variants n.39C>G (n = 2) and n.44A>G (n = 2) independently against 21 controls using rMATS. PCAs were performed using PSI values of these calls with additional 20 controls, 19 RNU4-2 and other U5 variants, including n.39del and n.40_41insA in RNU5A-1. PCAs were performed using PSI values of 105 5′SS events for n.39C>G (a), 51 3′SS events for n.39C>G (b), 87 5′SS events for n.44A>G (c), and 111 3′SS events for n.44A>G (d). Purple, controls; teal, RNU4-2; yellow, U5 variants.
Extended Data Fig. 8
Extended Data Fig. 8. Splicing analysis of 5′SS and 3′SS events in patients with RNU5A-1 variants.
ad, Significant alternative 5′SS and 3′SS events (FDR < 0.1) were called for variants n.39del (n = 1) and n.40_41insA (n = 1) independently against 21 controls using rMATS. PCAs were performed using PSI values of these calls with additional 20 controls, 19 RNU4-2 and other U5 variants, including n.39C>G and n.44A>G in RNU5B-1. PCAs were performed using PSI values of 21 5′SS events for n.39del (a), 70 3′SS events for n.39del (b), 229 5′SS events for n.40_41insA (c) and 202 3′SS events for n.40_41insA (d). Purple, controls; teal, RNU4-2; yellow, U5 variants.
Extended Data Fig. 9
Extended Data Fig. 9. Epigenetic study.
a,b, Manhattan plot (a) and volcano plot (b) of the epigenome-wide association analysis (45 controls, 35 RNU4-2 pathogenic variant carriers). c, Heatmap of adjusted methylation levels with the addition of both RNU5A-1 n.40_41insA variants (n = 45 controls, 30 RNU4-2 pathogenic variant carriers with moderate-to-severe phenotype, 5 with mild phenotype, 2 RNU5A-1 n.40_41insA variant carriers, 147 differentially methylation positions).
Extended Data Fig. 10
Extended Data Fig. 10. Comparison of RNU4-2, KMT2A and KMT2D episignatures.
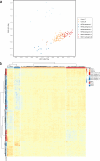
a, PCA of adjusted methylation levels, after correction for expected methylation based on age, sex and estimated blood cell counts showing no overlap between RNU4-2 (147 probes), and the union of KMT2A (287 probes) and KMT2D (348 probes) episignatures. The compared groups are color-coded—orange for controls, red for RNU4-2 P/LP variants, dark blue for KMT2A P/LP variants and light blue for KMT2D P/LP variants. The percentage of variance explained is provided on each axis. b, Heatmap of adjusted methylation levels on the union of RNU4-2 (147 probes), and the union of KMT2A (287 probes) and KMT2D (348 probes) episignatures with the addition of two RNU5A-1 n.40_41insA, 12 KMT2D and 11 KMT2A variant carriers. The compared subject groups in columns and signatures of origin in rows are color-coded similarly—orange for controls (columns only), red for RNU4-2 P/LP variants, dark blue for KMT2A P/LP variants and light blue for KMT2D P/LP variants.

References

    1. Wilkinson, M. E., Charenton, C. & Nagai, K. RNA splicing by the spliceosome. Annu. Rev. Biochem.89, 359–388 (2020). - PubMed
    1. Lee, Y. & Rio, D. C. Mechanisms and regulation of alternative pre-mRNA splicing. Annu. Rev. Biochem.84, 291–323 (2015). - PMC - PubMed
    1. Vazquez-Arango, P. & O’Reilly, D. Variant snRNPs: new players within the spliceosome system. RNA Biol.15, 17–25 (2018). - PMC - PubMed
    1. Charenton, C., Wilkinson, M. E. & Nagai, K. Mechanism of 5′ splice site transfer for human spliceosome activation. Science364, 362–367 (2019). - PMC - PubMed
    1. Artemyeva-Isman, O. V. & Porter, A. C. G. U5 snRNA interactions with exons ensure splicing precision. Front. Genet.12, 676971 (2021). - PMC - PubMed

Supplementary concepts

LinkOut - more resources