. 2025 May;4(5):624-636.
doi: 10.1038/s44161-025-00650-0. Epub 2025 May 16.

Developing cardiac digital twin populations powered by machine learning provides electrophysiological insights in conduction and repolarization

Affiliations

Developing cardiac digital twin populations powered by machine learning provides electrophysiological insights in conduction and repolarization

Shuang Qian et al. Nat Cardiovasc Res. 2025 May.

Abstract

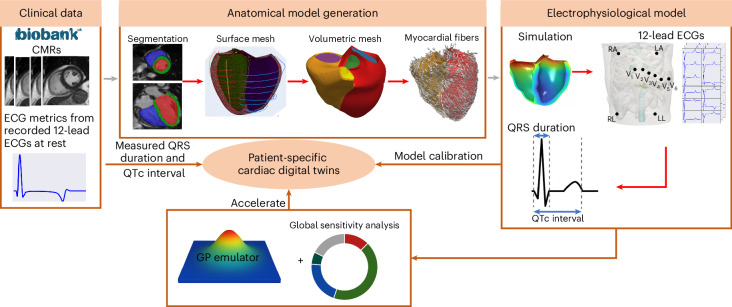
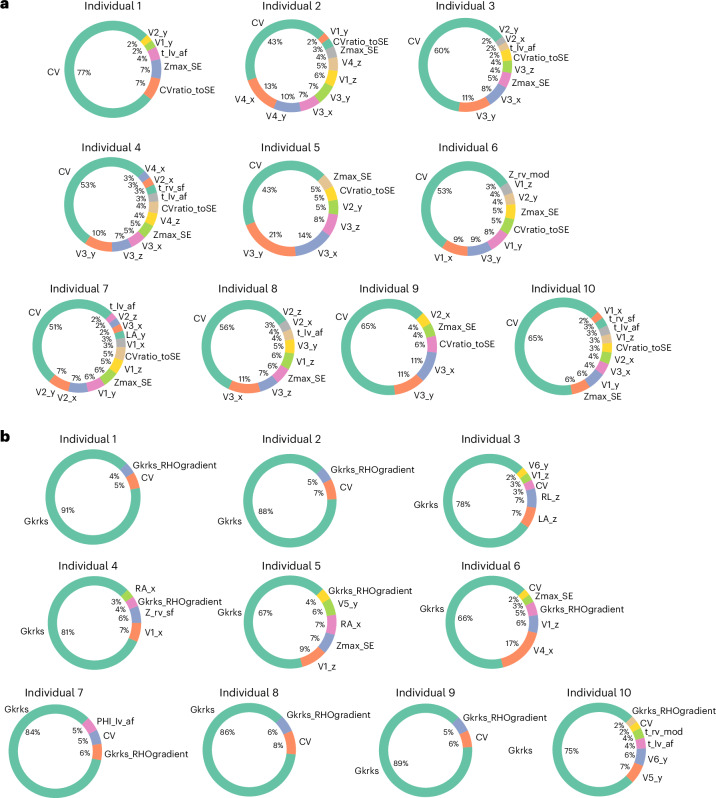
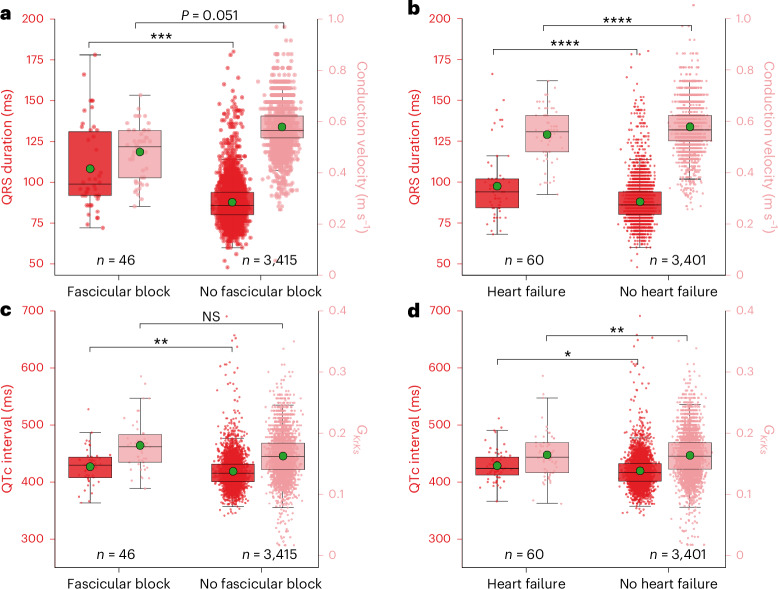
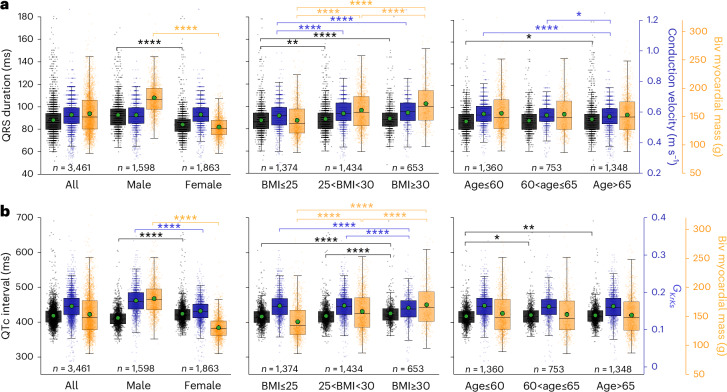
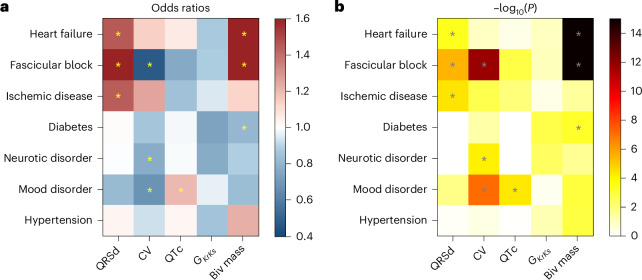
Large-cohort imaging and diagnostic studies often assess cardiac function but overlook underlying biological mechanisms. Cardiac digital twins (CDTs) are personalized physics-constrained and physiology-constrained in silico representations, uncovering multi-scale insights tied to these mechanisms. In this study, we constructed 3,461 CDTs from the UK Biobank and another 359 from an ischemic heart disease (IHD) cohort, using cardiac magnetic resonance images and electrocardiograms. We show here that sex-specific differences in QRS duration were fully explained by myocardial anatomy while their myocardial conduction velocity (CV) remains similar across sexes but changes with age and obesity, indicating myocardial tissue remodeling. Longer QTc intervals in obese females were attributed to larger delayed rectifier potassium conductance G KrKs . These findings were validated in the IHD cohort. Moreover, CV and G KrKs were associated with cardiac function, lifestyle and mental health phenotypes, and CV was also linked with adverse clinical outcomes. Our study demonstrates how CDT development at scale reveals biological insights across populations.


Conflict of interest statement

Competing interests: The authors declare no competing interests.

Figures

Fig. 1
Fig. 1. The automated anatomical and functional (EP) CDT generation workflow.
The anatomical models are personalized finite element meshes with physiological-detailed myocardial fibers constructed from the short-axis and long-axis heart images in the UKBB following the steps of segmentations, surface meshes and volumetric meshes construction as well as myocardial fiber generation. The functional CDT workflow is to replicate the EP activities within the anatomical models to match the QRSd and QTc interval from the clinically measured 12-lead ECGs. Reproduced by kind permission of the UKBB.
Fig. 2
Fig. 2. GSA results.
The total effects of all parameters explain the variance of interested outputs in 10 individuals sampled from the cohort based on sex, age and BMI. a, GSA results for QRSd. b, GSA results for QTc interval. Gkrks_RHOgradient, the transmural gradients of GKrKs. Gkrks_conductance, the scaling factor of baseline GKrKs. Note that only parameters with more than 2% impact on the output are included in the plots. Source data
Fig. 3
Fig. 3. Comparison of ECG and CDT-derived phenotypes of pathological individuals having FB or HF with their control counterparts.
Comparison of QRSd and CV (a and b) and QTc interval and delayed rectifier potassium conductance ‘GKrKs’ (c and d) for groups of participants afflicted with FB or HF and non-afflicted counterparts. The centerline within each box represents the median (50th percentile), and the box bounds correspond to the interquartile range (IQR), with the lower and upper edges indicating the 25th and 75th percentiles, respectively. The whiskers extend to the minimum and maximum values within 1.5 times the IQR from the quartiles. The green dots indicate their means. The corresponding P values are from the two-sided Mann–Whitney U-test. *P < 0.05; **P < 0.01; ***P < 0.001; ****P < 0.0001. NS, not significant.
Fig. 4
Fig. 4. Comparison of imaging, ECG and CDT-derived phenotypes for different sex, age and BMI groups.
Box plots of QRSd and CV (a) and QTc interval and delayed rectifier potassium conductance ‘GKrKs’ (b) with myocardial mass for different groups of sex, BMI and age. The centerline within each box represents the median (50th percentile), and the box bounds correspond to the interquartile range (IQR), with the lower and upper edges indicating the 25th and 75th percentiles, respectively. The whiskers extend to the minimum and maximum values within 1.5 times the IQR from the quartiles. The green dots indicate their means. The corresponding P values are from the two-sided Mann–Whitney U-test. *P < 0.05; **P < 0.01; ***P < 0.001; ****P < 0.0001. Biv, biventricular.
Fig. 5
Fig. 5
Manhattan plot showing the -log10P (two-sided t-test) for correlations among the QRSd, CV, QTc interval, delayed rectifier potassium conductance GKrKs, myocardial mass and UKBB-reported phenotypes. The size of the dots indicates the absolute Spearman correlation coefficient. The dashed horizontal lines are the Bonferroni threshold (Bonf) and the FDR (α = 0.05). Note that the plot is clipped at 65 for better visualization. Biv, biventricular. Source data
Fig. 6
Fig. 6. Association of QRSd, CV, QTc interval, baseline ‘GKrKs’ conductance and myocardial mass with common diseases.
a, ORs for phenotypes as input risk factors for common diseases as the outcomes. Sex, age, BMI, age × BMI and sex × age were adjusted in the logistic regression analysis (N = 3,461). b, The corresponding P values (two-sided t-test) for ORs. *Result reaches Bonferroni threshold (PBonf=7.1×10⁴ for α = 0.05). Biv, biventricular. Source data
Extended Data Fig. 1
Extended Data Fig. 1. Global sensitivity analysis results for the electrophysiological and ECG electrode positions parameters on QRS duration.
The total effects of input EP parameters explain the variance of output QRS duration in 10 representative individuals sampled from the cohort based on sex, age and BMI. a is for only tissue-level EP parameters and b is for the 30 ECG electrodes’ location parameters combining with the most important tissue-level parameter from a. Source data
Extended Data Fig. 2
Extended Data Fig. 2. Global sensitivity analysis results for the whole parameter set on QRS duration in 10 representative individuals with pathology.
The total effects of all input parameters on QRS duration were assessed. Note that only parameters with >2% impact on the output are included in the sensitivity plots. Source data
Extended Data Fig. 3
Extended Data Fig. 3. Parameter analysis for repolarization electrophysiological model framework.
a. Global sensitivity analysis results for the ionic parameters on action potential duration (APD: the key cellular feature to QTc interval). b. Finding the ranges of the baseline GKrKs conductance based on maximum APD ranges measured physiologically. Source data
Extended Data Fig. 4
Extended Data Fig. 4. Uncertainty quantification for the 10 representative individuals.
a, the fitted conduction velocity (CV) values for 10 subjects (blue circles) with uncertainty ranges (red error bars) derived from the 5th and 95th percentiles of simulated QRS duration distribution due to the variability of the other 49 parameters affecting QRS duration. b. the corresponding confidence interval of fitted CVs in %, with the median lower and upper bounds across the 10 subjects of −12.1% and +13.9%. c, the fitted GKrKs values for 10 subjects (blue circles) with uncertainty ranges (red error bars) derived from the 5th and 95th percentiles of simulated QTc distribution due to the variability of the other 52 parameters affecting QTc. d. the corresponding confidence interval of fitted GKrKs in %, with the median lower and upper bounds across the 10 subjects of −14.2% and +24.7%. Source data
Extended Data Fig. 5
Extended Data Fig. 5. Comparison of simulated 12 lead ECGs (black) with recorded ECGs (red) in the UK biobank of the five example representative individuals.
It shows five example cases which are selected as every second case ranked from best to worst matched to recordings (due to the UK biobank restrictions). Each simulated lead ECGs were scaled to have the same maximum absolute amplitude as the corresponding recorded lead ECGs in μV. All lead simulated and recorded ECGs were temporally aligned by matching the timepoints that the maximum voltage energy were achieved. Then the correlation scores for each pair of simulated and recorded lead ECGs were computed as shown at the bottom right corner of the plots and the 12 lead ECGs were listed in descending order of their correlation scores.
Extended Data Fig. 6
Extended Data Fig. 6. Correlations between simulated and recorded ECGs of the ten representative individuals.
The averaged correlation coefficients (r) of simulated and recorded ECGs versus the number of lead ECGs included in computing the averaged r. Source data
Extended Data Fig. 7
Extended Data Fig. 7. Boxplots for different groups of sex, BMI and age in a clinical cohort of patients with ischemic heart diseases.
(a) shows QRS duration and conduction velocity; (b) shows QTc interval and delayed rectifier potassium conductance GKrKs with myocardial mass. The centerline within each box represents the median (50th percentile), while the box bounds correspond to the interquartile range (IQR), with the lower and upper edges indicating the 25th and 75th percentiles, respectively. The whiskers extend to the minimum and maximum values within 1.5 times the IQR from the quartiles. The green dots indicate their means. The corresponding P values are from the two-sided Mannwhitney U-test. *P < 0.05; **P < 0.01; ***P < 0.001; ****P < 0.0001. Source data
Extended Data Fig. 8
Extended Data Fig. 8. Manhattan plot for correlations between the multimodal phenotypes and phenotypes in the UK biobank.
a. log10P (two-sided t-test) for correlations between the multimodal phenotypes and phenotypes in the UK biobank. The size of the dots indicates the absolute Spearman’s correlation coefficient. The dashed horizontal lines are the Bonferroni threshold (Bonf) and the false-discovery rate (fdr) (α = 0.05). b. the corresponding correlation coefficients. The size of the dots indicates the absolute Spearman’s correlation coefficient. Source data
Extended Data Fig. 9
Extended Data Fig. 9. Fascicular-based model illustration replicating the realistic ventricular activation modulating by the His-Purkinje system.
The SE layer (yellow) represents the fast conduction regions, where the fascicles are located, defined by apical-basal coordinate Z and transmural coordinate ρ, bounded by physiological measurements from literature as shown in Supplementary Table 2. There are also five early activation sites represented by disks with a thickness of 5% of the ventricular wall (δz and δρ = 0.05) and having a fixed radius of 20μm, representing ~25 cells. The disks are centred at root locations, defined by apical-basal coordinates Z and rotational coordinates φ, which are activated at specific timings. Both coordinates and timings of the five sites are bounded by physiological measurements from literature as shown in Supplementary Table 2.
Extended Data Fig. 10
Extended Data Fig. 10. The impact of the number of simulations performed used for training the GPE on the resultant R2score and ISE along with the resultant total effects of CV.
a. is for GPEs with the output as QRSd on the 30 tissue-level parameters. b. is for GPEs with the output as QRSd on 31 parameters including 30 ECG electrodes’ locations and CV. Source data

References

    1. Niederer, S. A., Sacks, M. S., Girolami, M. & Willcox, K. Scaling digital twins from the artisanal to the industrial. Nat. Comput. Sci.1, 313–320 (2021). - PubMed
    1. Prakosa, A. et al. Personalized virtual-heart technology for guiding the ablation of infarct-related ventricular tachycardia. Nat. Biomed. Eng.2, 732–740 (2018). - PMC - PubMed
    1. Sakata, K. et al. Assessing the arrhythmogenic propensity of fibrotic substrate using digital twins to inform a mechanisms-based atrial fibrillation ablation strategy. Nat. Cardiovasc. Res.3, 857–868 (2024). - PMC - PubMed
    1. Qian, S. et al. Additional coils mitigate elevated defibrillation threshold in right-sided implantable cardioverter defibrillator generator placement: a simulation study. Europace25, euad146 (2023). - PMC - PubMed
    1. Niederer, S. A. et al. Creation and application of virtual patient cohorts of heart models: virtual cohorts of heart models. Philos. Trans. A Math. Phys. Eng. Sci.378, 20190558 (2020). - PMC - PubMed

MeSH terms

LinkOut - more resources