

Angiogenesis related gene signatures predict prognosis and guide therapeutic strategies in renal clear cell carcinoma
- PMID: 40379825
- PMCID: PMC12084375
- DOI: 10.1038/s41598-025-02134-4
Angiogenesis related gene signatures predict prognosis and guide therapeutic strategies in renal clear cell carcinoma
Abstract
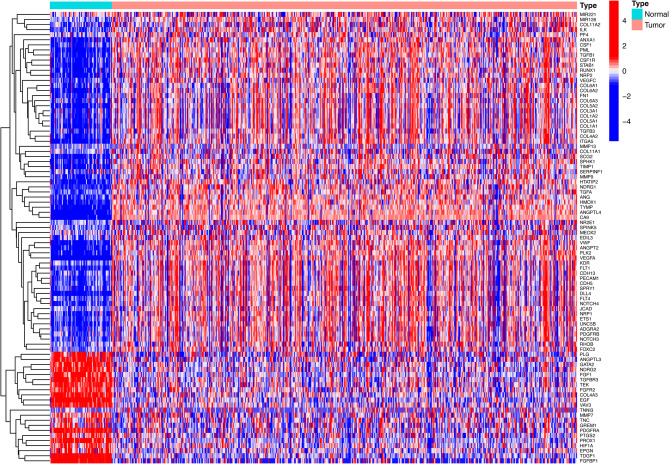
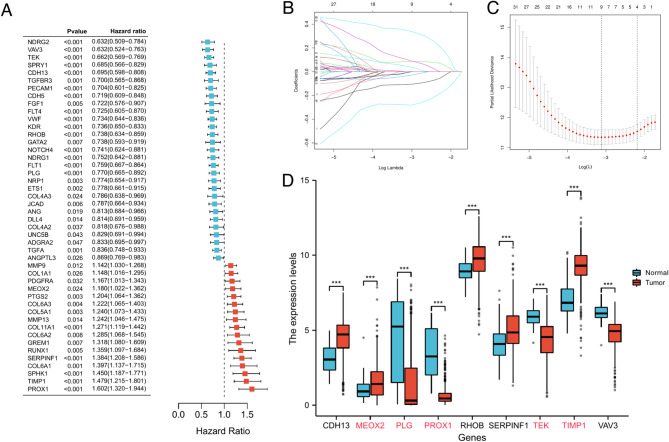
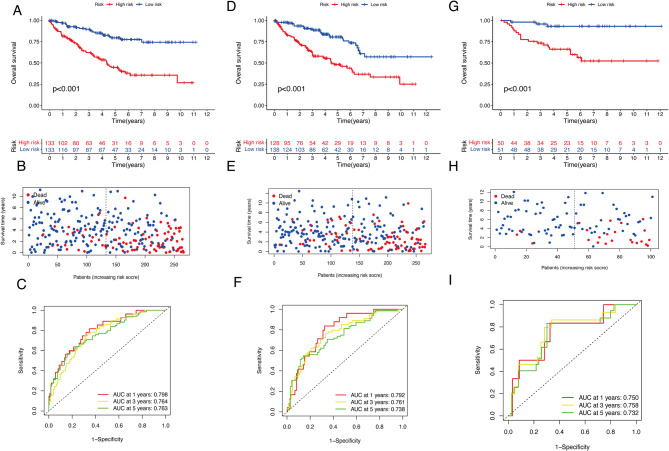
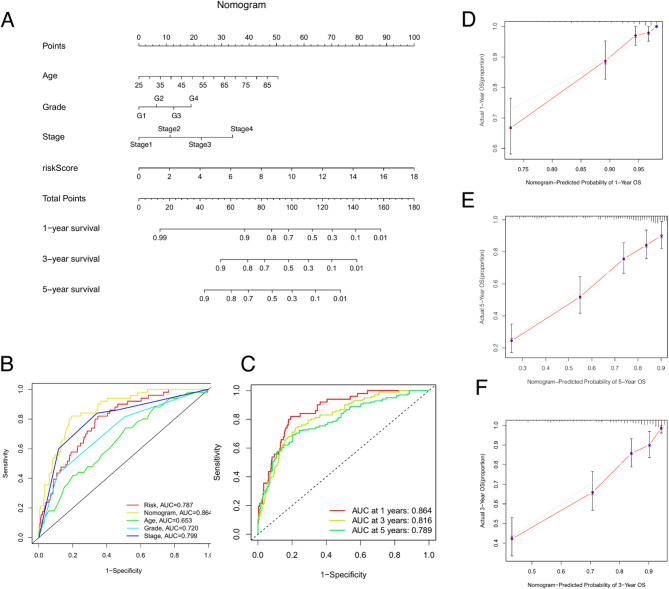
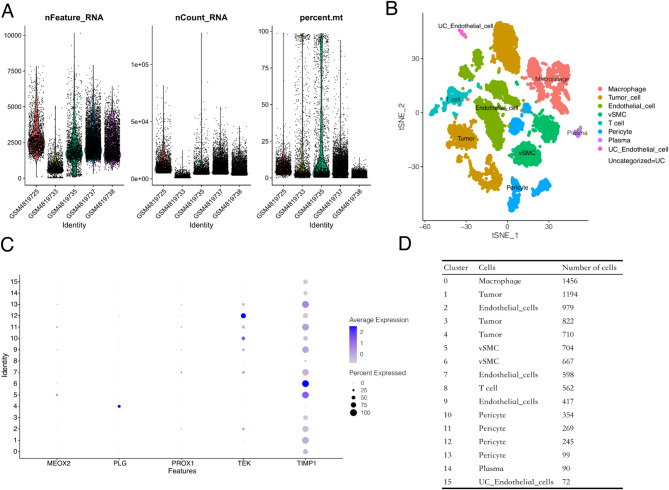
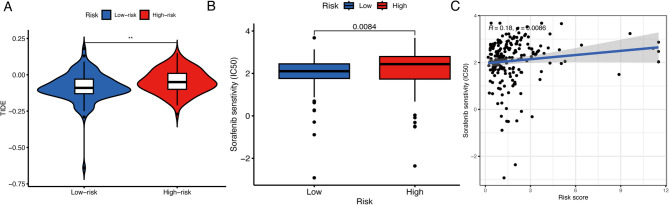
Kidney tumors are hypervascular tumors with crucial antiangiogenic effects in tumor therapy. This study aimed to develop a predictive model for kidney renal clear cell carcinoma (KIRC) by utilizing angiogenesis-related genes to formulate targeted therapy and immunotherapy strategies. Angiogenesis-related genes were screened via the GeneCard and Molecular Signatures Database (MSigDB). The KIRC data downloaded from The Cancer Genome Atlas (TCGA) were randomly divided into an experimental cohort and a validation cohort. In the experimental cohort, a risk score prediction model was constructed through successive analyses via univariate Cox regression, LASSO regression, and multivariate Cox regression. Receiver operating characteristic (ROC) curves were employed to assess the sensitivity of the model's predictions. The model's stability and generalizability were subsequently validated in both the validation cohort and the E-MTAB-1980 cohort. Subsequently, the TCGA-KIRC dataset was stratified into two distinct groups: a localized tumor cohort and a progression/metastasis cohort, based on tumor staging criteria. The efficacy of the prognostic prediction model was evaluated within each subgroup. A nomogram model was developed in conjunction with each independent prognostic factor to accurately predict patient outcomes. Additionally, single-cell and intercellular communication analyses were conducted via KIRC single-cell data obtained from the Gene Expression Omnibus (GEO) database. The effects of immunotherapy and targeted therapy on patients were predicted via prognostic modeling. A total of 260 angiogenesis-related genes were identified through screening in the GeneCards and Molecular Signatures Database(MSigDB). We subsequently developed a risk model comprising five genes: MEOX2, PLG, PROX1, TEK, and TIMP1. Survival analysis indicated that the prognosis for high-risk patients was significantly poorer than that for low-risk patients (P < 0.001), and the model demonstrated satisfactory accuracy in predicting 1-, 3-, and 5-year survival rates. This finding was further validated in both internal and external validation cohorts. The model demonstrated applicability for prognostic predictions in both the localized tumor cohort and the progression/metastasis cohort, with proficiency in forecasting the prognosis of patients diagnosed with metastatic renal cancer. The AUC values for 1, 3, and 5 years were recorded at 0.691, 0.709, and 0.773, respectively. We successfully constructed a nomogram model to facilitate accurate prognostic predictions for patients. Analysis of single-cell data revealed that PLG was expressed predominantly in tumor cell clusters, whereas TEK was highly expressed primarily in pericytes. TIMP1 was found to be highly expressed in vascular smooth muscle cells. In contrast, MEOX2 and PROX1 were highly expressed in specific cell clusters but presented low expression levels across the overall cell population. Cell communication analysis indicated that the modeling gene TEK was involved in the angiogenic pathway, with the interaction between the ligand ANGPT2 and the receptor ITGA5-ITGB1 being particularly prominent in this study. Furthermore, the immune dysfunction and rejection scores for high-risk patients within the non-localized renal cancer cohort were markedly elevated compared to those observed in the low-risk group. In terms of targeted pharmacological intervention, individuals classified in the low-risk group exhibited a heightened sensitivity to sorafenib. The KIRC prognostic prediction model, which is based on five angiogenesis-related genes, demonstrated reliable performance, indicating that high-risk patients have a significantly poorer prognosis than low-risk patients do. The developed nomogram model effectively visualizes and accurately predicts patient prognosis. It is essential to highlight that individuals diagnosed with low-risk metastatic KIRC may experience greater advantages from the administration of immunotherapy and sorafenib.
Keywords: Angiogenesis; Immunotherapy; Kidney renal clear cell carcinoma; Prognosis; Targeted therapy.
© 2025. The Author(s).
Conflict of interest statement
Declarations. Competing interests: The authors declare no competing interests. Ethical approval and consent to participate: The data utilized in this study were sourced exclusively from publicly accessible online databases, and the research did not entail any experiments involving animals or humans; therefore, approval from an ethical review board was not necessary.
Figures


Similar articles
-
Cuproptosis gene-related, neural network-based prognosis prediction and drug-target prediction for KIRC.Cancer Med. 2024 Jan;13(1):e6763. doi: 10.1002/cam4.6763. Epub 2023 Dec 22. Cancer Med. 2024. PMID: 38131663 Free PMC article.
-
A novel glycogene-related signature for prognostic prediction and immune microenvironment assessment in kidney renal clear cell carcinoma.Ann Med. 2025 Dec;57(1):2495762. doi: 10.1080/07853890.2025.2495762. Epub 2025 May 7. Ann Med. 2025. PMID: 40329678 Free PMC article.
-
Unveiling ammonia-induced cell death: a new frontier in clear cell renal cell carcinoma prognosis.Front Immunol. 2025 Jul 31;16:1636977. doi: 10.3389/fimmu.2025.1636977. eCollection 2025. Front Immunol. 2025. PMID: 40821775 Free PMC article.
-
Treatment selection for patients with metastatic renal cell carcinoma.Cancer. 2009 May 15;115(10 Suppl):2327-33. doi: 10.1002/cncr.24231. Cancer. 2009. PMID: 19402069 Free PMC article. Review.
-
Applying single-cell technologies to clinical pathology: progress in nephropathology.J Pathol. 2020 Apr;250(5):693-704. doi: 10.1002/path.5417. Epub 2020 Mar 31. J Pathol. 2020. PMID: 32125696 Free PMC article. Review.
References
-
- Shuch, B. et al. Understanding pathologic variants of renal cell carcinoma: distilling therapeutic opportunities from biologic complexity. Eur. Urol.67(1), 85–97 (2015). - PubMed
-
- Choueiri, T. K. & Motzer, R. J. Systemic Therapy for Metastatic Renal-Cell Carcinoma. N Engl. J. Med.376(4), 354–366 (2017). - PubMed
-
- Carmeliet, P. & Jain, R. K. Angiogenesis in cancer and other diseases. Nature407(6801), 249–257 (2000). - PubMed
MeSH terms
Substances
LinkOut - more resources
Full Text Sources
Medical
Research Materials
Miscellaneous
