. 2025 Jun;6(6):1073-1087.
doi: 10.1038/s43018-025-00968-5. Epub 2025 May 16.

Sensitizing solid tumors to CAR-mediated cytotoxicity by lipid nanoparticle delivery of synthetic antigens

Affiliations

Sensitizing solid tumors to CAR-mediated cytotoxicity by lipid nanoparticle delivery of synthetic antigens

Lena Gamboa et al. Nat Cancer. 2025 Jun.

Abstract

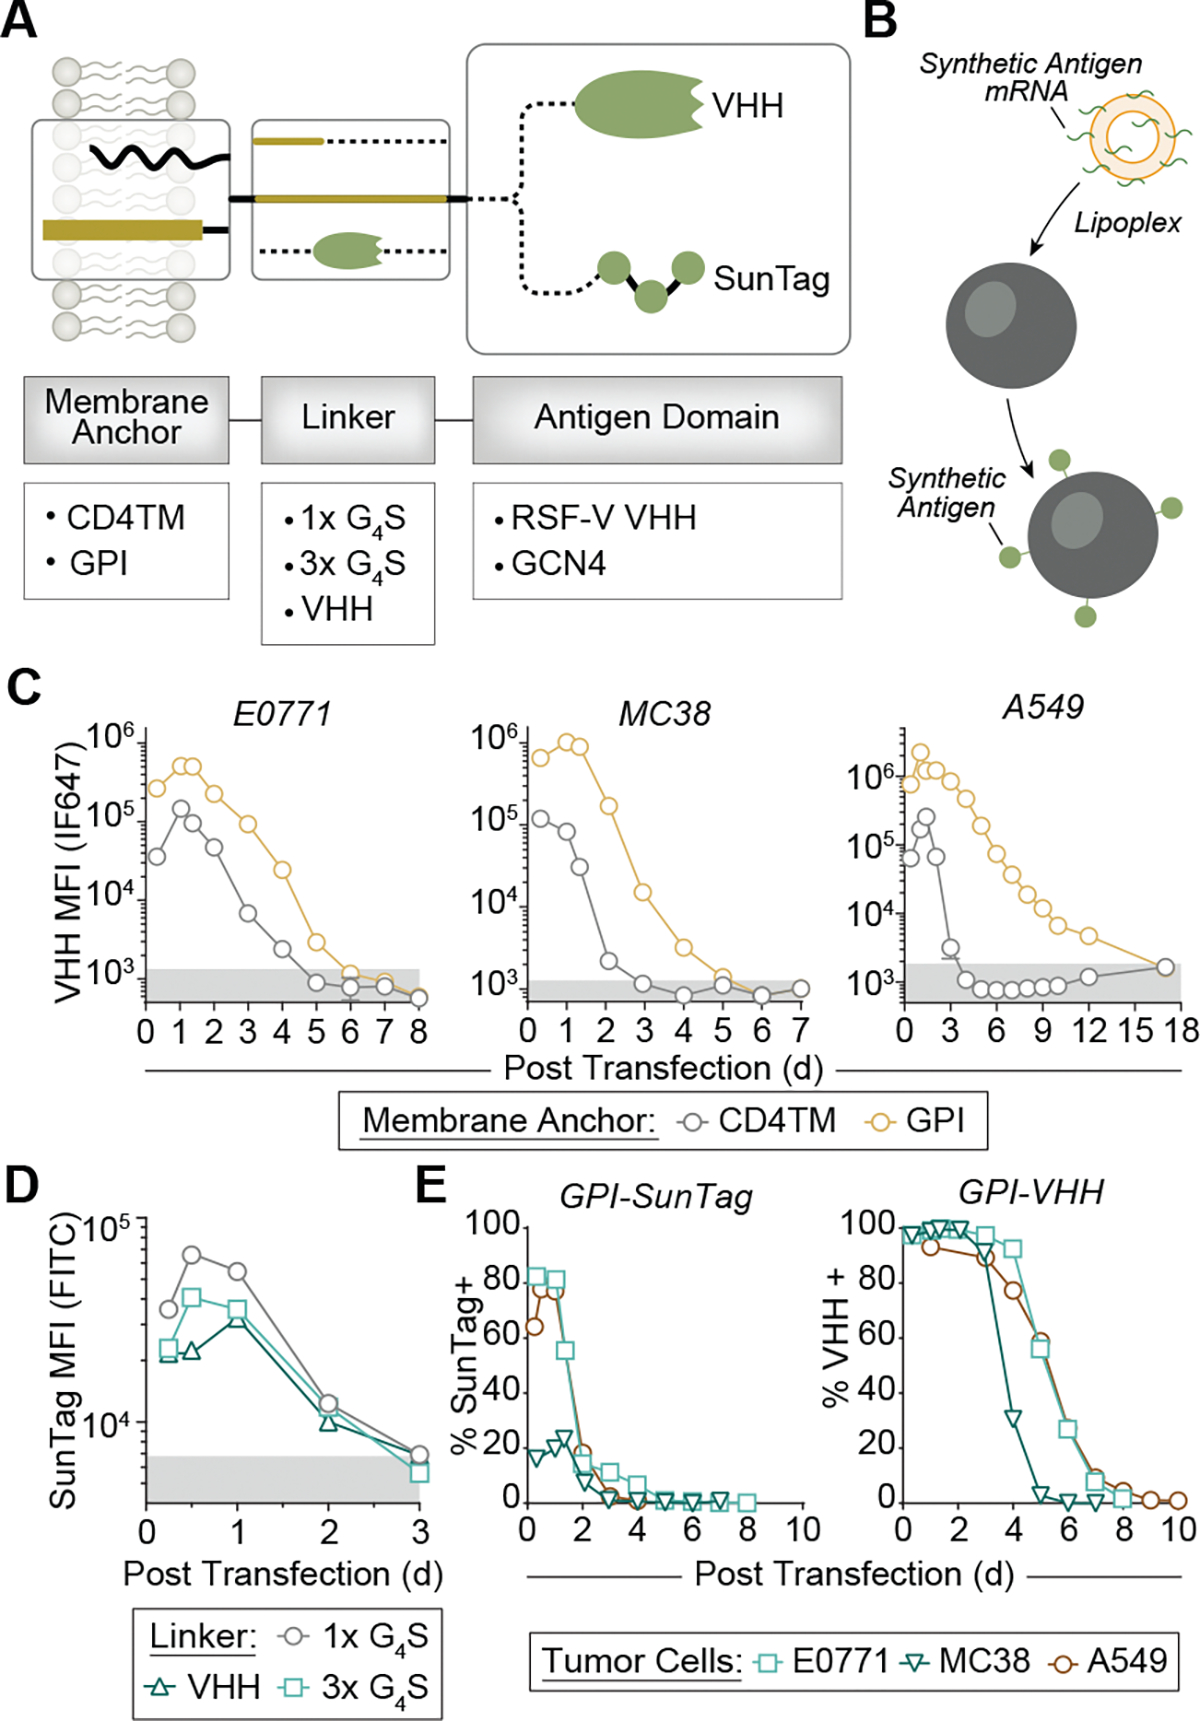
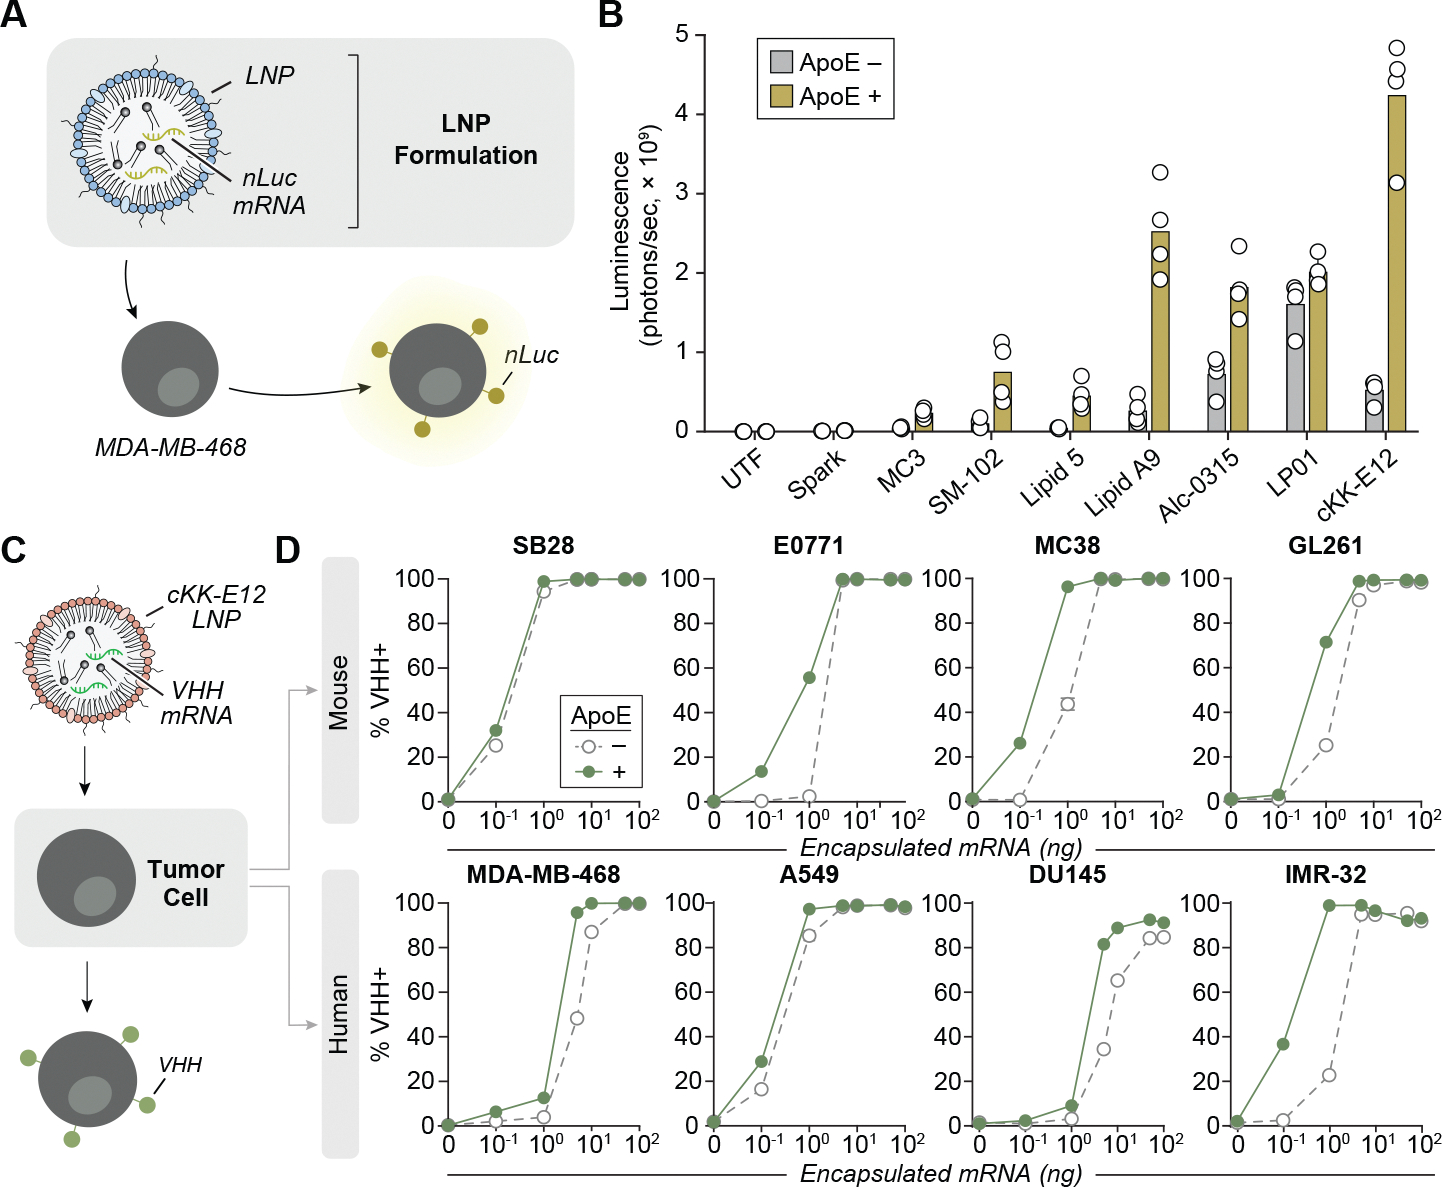
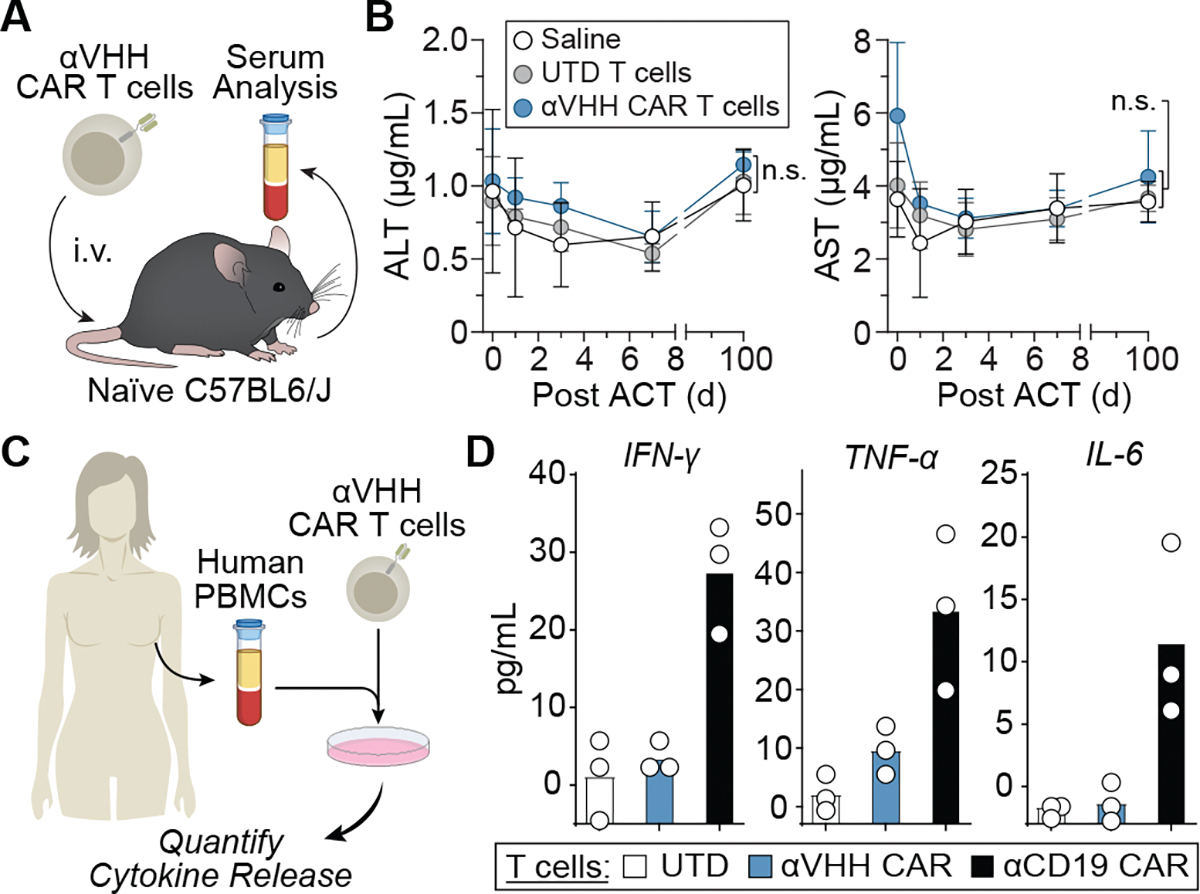
Chimeric antigen receptor (CAR) T cell immunotherapy relies on CAR targeting of tumor-associated antigens; however, heterogenous antigen expression, interpatient variation and off-tumor expression by healthy cells remain barriers. Here we develop synthetic antigens to sensitize solid tumors for recognition and elimination by CAR T cells. Unlike tumor-associated antigens, we design synthetic antigens that are orthogonal to endogenous proteins to eliminate off-tumor targeting and that have a small genetic footprint to facilitate efficient tumor delivery to tumors by lipid nanoparticles. Using a camelid single-domain antibody (VHH) as a synthetic antigen, we show that adoptive transfer of anti-VHH CAR T cells to female mice bearing VHH-expressing tumors reduced tumor burden in multiple syngeneic and xenograft models of cancer, improved survival, induced epitope spread, protected against tumor rechallenge and mitigated antigen escape in heterogenous tumors. Our work supports the in situ delivery of synthetic antigens to treat antigen-low or antigen-negative tumors with CAR T cells.


Conflict of interest statement

Competing interests: G.A.K. reports equity or consulting roles for Sunbird Bio, Port Therapeutics, Send Biotherapeutics and Ridge Biotechnologies. The terms of this arrangement were reviewed and approved by Georgia Tech in accordance with its conflict-of-interest policies. L.G., A.H.Z., D.V., P.J.S., C.S.C., H.J.L., C.A.T. and G.A.K. are listed as inventors on a patent application related to the results of this paper, titled ‘Synthetic Antigens as Chimeric Antigen Receptor (CAR) Ligands and Uses Thereof’ (US20230390335A1). The patent applicant is the Georgia Tech Research Corporation.

Figures

Extended Data Fig. 1 |
Extended Data Fig. 1 |. Kinetics of expression of Kb-SIINFEKL pMHC complex.
Surface expression kinetics of the Kb-SIINFEKL pMHC complex on the surface of MC38 tumor cells following peptide pulsing with the SIINFEKL peptide for one hour at room temperature. Mean of n = 3 technical replicates from a single experiment.
Extended Data Fig. 2 |
Extended Data Fig. 2 |. Kinetics of expression of LNP mediated delivery of VHH synthetic antigen to tumor cells.
VHH expression on MDA-MB-468 (left) and E0771 (right) following VHH-LNP treatment at the indicated doses. VHH mean fluorescent intensity (MFI) quantified by flow cytometry at indicated days after transfection. Mean of n = 4 technical replicates from a single experiment.
Extended Data Fig. 3 |
Extended Data Fig. 3 |. Characterization of murine CAR T cells sourced from either pmel-1 or C57BL6/J mice.
(a) Staining of indicated murine T cell population with activation markers CD25 and CD69 following co-incubation with ST- or VHH-expressing E0771 tumor cells. Data is representative of 3 technical replicates from a single experiment. (b) IFN-γ secretion by Pmel-1 or C57BL/6J derived αVHH CAR T cells quantified following a 24 hr coculture with MC38-VHH tumor cells at a 1:1 E:T ratio. Mean of n = 3 technical replicates from a single experiment. (c) Cytotoxicity of Pmel-1 and C57BL/6 derived αVHH CAR T cells were assessed following a 24 hr coculture with MC38-VHH at a 1:1 E:T ratio. Mean of n = 3 technical replicates from a single experiment.
Extended Data Fig. 4 |
Extended Data Fig. 4 |. Murine αVHH CAR T cells are well tolerated by immunocompetent mice.
(a) Blood serum analysis 7 d post i.v. administration of αVHH CAR T cells, untransduced T cells, or saline into naïve C57BL6/J mice. One-way ANOVA, mean ± s.d., n = 4 mice.; n.s. = not significant. (b) Body weight measurements following i.v. administration of αVHH CAR T cells, wild-type T cells, or saline into naïve C57BL6/J mouse. Two-way ANOVA, mean ± s.d., n = 5 mice per cohort; n.s. = not significant. (c) PBMC analysis before and 3 days after ACT of saline, WT, αVHH CAR, or αCD19 CAR T cells into C57BL6/J mice. One-way ANOVA; mean ± s.e.m., n = 4 mice for αCD19 CAR treated mice, n = 5 mice in all other cohorts; n.s. = not significant ***p = 0.0002. (d) Blood serum analysis 3 d post i.v. administration of saline, WT, αVHH CAR, or αhHER2 CAR T cells into naïve B6-HER2 mice. One-way ANOVA; mean ± s.e.m., n = 3 mice for hHER2 and VHH treatments, n = 4 mice for Saline and WT treatments.; *p = 0.01, **p = 0.0065.
Extended Data Fig. 5 |
Extended Data Fig. 5 |. VHH expression alone does not alter tumor growth.
(a) VHH expression on wildtype or transduced MC38 and E0771 tumor cells. Data is representative of 2 independent experiments. (b) Tumor growth curves of wildtype MC38 (MC38-WT) or MC38 cells transduced to stably express VHH (MC38-VHH) without adoptive cell transfer of αVHH CAR T cells. n = 4 mice inoculated with MC38-WT and n = 3 mice inoculated with MC38-VHH. Two-way ANOVA, mean ± s.e.m. is depicted; n.s. = not significant (c) Tumor growth curves of wildtype E0771 (E0771-WT) or E0771 cells transduced to stably express VHH (E0771-VHH) without adoptive cell transfer of αVHH CAR T cells n = 4 mice inoculated with E0771-WT and n = 6 mice inoculated with E0771-VHH; Two-way ANOVA, mean ± s.e.m. is depicted; n.s. = not significant.
Extended Data Fig. 6 |
Extended Data Fig. 6 |. Adoptive transfer of αVHH CAR T cells to mice bearing wildtype tumors does not alter tumor growth.
Tumor growth curves of mice bearing wiltdype E0771 tumors treated intravenously with either saline, 5 × 10⁶ untransduced (UTD) or αVHH CAR T cells. Two-way ANOVA, mean ± s.e.m., n = 5 mice; n.s. = not significant.
Extended Data Fig. 7 |
Extended Data Fig. 7 |. The antitumor activity αVHH CAR T cells is comparable to αHER2 CAR T cells against VHH + HER2+ tumors.
(a) Representative flow plots of HER2 and VHH expression on either wildtype or 468-HV tumor cells. Data is representative from a single experiment, repeated 2 times with similar results. (b) 468-HV tumor cells were cocultured with either human untransduced (UTD), αHER2 CAR, or αVHH CAR T cells at a 2:1 E:T ratio and assessed for cytotixicity after 24 hrs (Mean of n = 3 technical replicates) and (c) growth curves of 468-HV tumors following treatment with the UTD, αHER2 CAR, or αVHH CAR T cells. (Two-way ANOVA, mean ± s.e.m., n = 6 mice per cohort, αVHH (**p = 0.0080 on day 6, **p = 0.0015 on day 13, ***p = 0.0003 on day 18, ***p = 0.0005 on day 25, ***p = 0.0003 on day 33) and αHER2 (††p = 0.0054 on day 6, ††p = 0.0016 on day 13, †††p = 0.0003 on day 18, †††p = 0.0005 on day 25, †††p = 0.0003 on day 33) CAR T cell treatments are compared to UTD.
Extended Data Fig. 8 |
Extended Data Fig. 8 |. In vivo biodistribution of functional mRNA delivery mediated by CKK-LNPs following intratumoral injection.
(a) In vivo biodistribution following saline or a 2 μg intratumoral injection of nLuc mRNA-loaded LNPs (nLuc-LNPs) as measured by IVIS 24 hrs following injection. Luminesence in organs quantified (left) and representative (of n = 3 organs, each from individual mice) images are displayed on the right. mean ± s.d., multiple unpaired t test, n = 3 organs, each from individual mice; *p = 0.0397, ***p = 0.00047, ****p < 0.0001. (b) In vivo kinetics of nLuc expression following one (light blue) or two (dark blue) intratumoral injections of 5 μg nLuc-LNPs. Transfection kinetics quantified by IVIS. Two-way ANOVA, mean ± s.e.m., n = 4 mice; *p = 0.0196, **p = 0.0080.
Extended Data Fig. 9 |
Extended Data Fig. 9 |. αVHH CAR T cells reduce tumor burden of VHH LNP injected tumors.
(a) Tumor growth curves of wildtype E0771 (E0771-wt) tumors transfected with VHH-LNPs (CKK-E12) by intratumoral injection of 5 μg mRNA-loaded LNPs without adoptive cell transfer of αVHH CAR T cells. Two-way ANOVA, mean ± s.e.m. is depicted; n = 6 saline injected mice and n = 5 for VHH-LNP injected mice.; n.s. = not significant. (b) Tumor growth curves of wildtype E0771 tumor-bearing mice treated with intratumorally with either saline, Fluc-LNP or VHH-LNP and αVHH CAR T cells on days indicated by a dashed line (D0, D7, D14, D21, and D28). Two-way ANOVA, mean ± s.e.m., n = 5 mice. Saline vs. VHH-LNP: *p = 0.0176, ***p = 0.0006, ****p < 0.0001.
Extended Data Fig. 10 |
Extended Data Fig. 10 |. LNP-mediated synthetic antigen treatment augments antitumor immunity in a preclinical model of heterogenous glioblastoma tumors.
(a) EGFRvIII- (vIII-) or EGFRvIII+ (vIII+) SB28 tumor cells were transfected with 100 ng of VHH-LNP and evaluated for VHH expression by flow cytometry after 18 hrs, mean of n = 5 technical replicates from a single experiment (b) Mice bearing a heterogenous tumor mixture comprised of 90% vIII- and 10% vIII+ SB28 tumor cells were treated with saline or VHH-LNP followed by adoptive transfer of indicated CAR T cells (c) 24 hrs following intratumoral injection VHH-LNP (5 μg), SB28 tumors were dissociated and analyzed by flow cytometry for EGFRvIII (left) and VHH (right) expression, one-way unpaired T test, mean ± s.d., n = 3 dissociated tumors, each from individual mice; ***p = 0.0008, n.s.=nonsignficiant. (d) Representative flow plots of VHH expression on SB28 tumors treated with either saline or VHH-LNP. Data is representative of 3 tumors each isolated from one mouse (e) Tumor growth curves of heterogenous SB28 tumor-bearing mice treated with intratumorally with saline or VHH-LNP and systemically with either WT, αVHH, or αEGFRvIII CAR T cells days indicated days by dashed lines (D0, D7, & D14) n = 5 untreated and VHH-LNP + αVHH CAR treated mice, n = 6 mice with αEGFRvIII CAR T cell treatment, n = 7 mice with VHH-LNP + saline treatment. (f) Survival curves from (e) of heterogenous SB28 tumor-bearing mice following synthetic antigen treatment, log-rank (Mantel–Cox) test; **p = 0.0019 comparing EGFRvIII CAR treatment with LNP + αVHH CAR.
Fig. 1 |
Fig. 1 |. Design of syntAg constructs.
a, mRNA constructs tested consist of a membrane anchor, a linker and a recognition domain. b, These constructs are transfected into tumor cells using the lipoplex jetMESSENGER to achieve syntAg expression. c, Expression kinetics of GPI-anchored and CD4TM-anchored syntAgs consisting of a 1× G4S linker and the respiratory syncytial virus fusion (RSV-F) VHH recognition domain on the surface of indicated tumor cells. Data represent the mean of n = 3 technical replicates from a single experiment. d, Expression kinetics of mRNA constructs with a GPI anchor, SunTag recognition domain and indicated linker domains. Data represent the mean of n = 3 technical replicates from a single experiment. e, Expression kinetics of GPI-anchored SunTag or VHH on the surface of indicated tumor cell lines. Data represent the mean of n = 3 technical replicates from a single experiment.
Fig. 2 |
Fig. 2 |. mRNA-loaded LNPs deliver syntAgs to the surface of tumor cells.
a, Various LNP formulations were loaded with mRNA encoding for GPI-anchored nLuc and coincubated with MDA-MB-468 tumor cells for 18 h before quantifying nLuc expression. b, nLuc expression on MDA-MB-468s after coincubation with various LNP formulations (1 μg ml−1) with or without 1 μg ml−1 ApoE. Luminescence was quantified by IVIS 18 h after transfection. Data represent the mean of n = 4 technical replicates from a single experiment. c, VHH-LNPs were screened against various murine and human tumor cell lines. d, VHH expression was quantified by flow cytometry 16–18 h after transfection at the indicated concentrations of VHH-LNPs with or without 1 μg ml−1 ApoE. Data represent the mean of n = 4 technical replicates from a single experiment.
Fig. 3 |
Fig. 3 |. Anti-VHH CAR T cells recognize and kill tumor cells expressing their cognate syntAgs in murine and human models.
a, Genetic circuit design of the murine and human anti-syntAg CAR. b, Schematic of murine and human CAR constructs expressed on the surface of tumor cells. c, Representative surface expression of anti-SunTag or anti-VHH CARs on primary murine or human T cells following viral transduction. E0771 tumor cells were transfected with VHH or SunTag mRNA and coincubated with either murine anti-SunTag (S) or anti-VHH (V) CARs. Data represent the mean of n = 3 technical replicates from a single experiment. APC, allophycocyanin. d,e, IFNγ secretion (d) and killing (e) by indicated murine T cells were measured following a 24-h coculture at a 2:1 E:T ratio with transfected tumor cells. Data represent the mean of n = 4 technical replicates from a single experiment. f, Killing of untransfected, SunTag-transfected or VHH-transfected A549 tumor cells following coincubation with WT T cells, anti-SunTag CAR T cells or anti-VHH CAR T cells for 24 h quantified by LDH assay. Data represent the mean of n = 3 technical replicates (untransfected and Suntag mRNA) or mean of n = 4 technical replicates (VHH mRNA), each from a single experiment. mCAR, murine CAR.
Fig. 4 |
Fig. 4 |. Anti-VHH CAR T cells are well tolerated by immunocompetent mice and isolated human PBMCs.
a, Systemic toxicity of anti-VHH CAR T cells was assessed by the measure of liver enzyme ALT and AST levels in serum following systemic administration (intravenously) of indicated T cells. i.v., intravenous. b, Serum analysis of AST and ALT at indicated days after ACT. Statistical analysis was performed using a one-way ANOVA (mean ± s.e.m., n = 5 mice). NS, nonsignificant. c, Human anti-VHH CAR T cells were cocultured human PBMCs from the matching donor. d, IFNγ, TNF and IL-6 secretion by human anti-VHH CAR T or anti-CD19 CAR T cells following a 48-h coculture at a 1:1 E:T ratio with donor-matched PBMCs. Data represent the mean of n = 3 technical replicates from a single experiment.
Fig. 5 |
Fig. 5 |. Adoptive transfer of anti-VHH CAR T cells into mice with VHH-expressing tumors delays tumor growth, enhances infiltration of tumor-reactive T cells and promotes endogenous antitumor immunity.
a, MC38-VHH tumors were treated with murine anti-VHH CAR T cells and monitored for tumor growth. T cells were isolated from tumors, spleens and lymph nodes on day 18 for downstream analysis. s.c., subcutaneous; LN, lymph node; TCR, T cell receptor. b, Tumor growth curves following ACT. Statistical analysis was performed using a two-way ANOVA (mean ± s.e.m., n = 4 mice). **P = 0.0043 and ****P < 0.0001. c, Count and frequency of indicated T cell populations isolated from the tumor. Statistical analysis was performed using an unpaired one-sided Student’s t-test (mean displayed, n = 4 tumors for control CAR T cells and n = 5 tumors for anti-VHH CAR T cells). Left, **P = 0.0013; middle, **P = 0.0016; right, *P = 0.0492. d, Representative flow plot (n = 5 for anti-VHH CAR T cells and n = 4 for control CAR T cells) of endogenous (CAR) T cell expression of the Reps1 T cell receptor in tdLNs and the frequency of this population in the ipsilateral and contralateral draining lymph nodes. Statistical analysis was performed using an unpaired two-sided Student’s t-test (mean displayed, n = 3 independent lymph nodes for contralateral control CAR T cell, n = 4 independent lymph nodes for ipsilateral control CAR T cell and contralateral anti-VHH CAR T cell and n = 5 independent lymph nodes for ipsilateral anti-VHH CAR T cell. *P = 0.0374. NS, nonsignificant. Each lymph node was obtained from an individual mouse. e, E0771-VHH tumors were treated with murine anti-VHH CAR T cells. f, Individual traces of tumor growth curves of E0771-VHH tumor-bearing mice treated with control CAR T cells (black) or anti-VHH CAR T cells (blue) (n = 4 mice). g, Next, 45 days after initial treatment, cured mice (n = 3) were rechallenged with WT E0771 tumor cells. Statistical analysis was performed using a two-way ANOVA (mean ± s.e.m., n = 5 mice). ****P < 0.0001. h, Survival curves of tumor-bearing mice following treatment. Statistical analysis was performed using a log-rank (Mantel–Cox) test (n = 4 mice). **P = 0.0019.
Fig. 6 |
Fig. 6 |. LNP-mediated syntAg delivery sensitizes tumors to CAR-mediated cytoxicity in models of TNBC.
a, Murine and human tumor cells were transfected with VHH-LNPs for 18 h before coincubation with anti-VHH CAR T cells. b, Cytotoxicity of E0771 and MDA-MB-468 tumor cells quantified by LDH assay following a 20-h coincubation with either murine or human UTD or anti-VHH CAR T cells, respectively, at various VHH-LNP doses. Data represent the mean of n = 4 technical replicates from a single experiment. c, Mice bearing WT E0771 tumors were treated intratumorally with saline, Fluc-LNP or VHH-LNP followed by adoptive transfer of anti-VHH CAR T cells. m.f.p., mammary fat pad; i.t., intratumoral. d, Left, MFI of VHH expression on E0771 tumor cells 24 h after LNP treatment. Right, representative flow plot of three independent mice from the same population. Statistical analysis was performed using an unpaired two-sided Student’s t-test (mean ± s.e.m., n = 3 tumors, each from individual mice). *P = 0.0480. FSC-A, forward scatter area. e, Tumor growth curves of WT E0771 tumor-bearing mice treated intratumorally with saline, Fluc-LNP or VHH-LNP and anti-VHH CAR T cells on days indicated by a dashed line (days 0 and 7). Statistical analysis was performed using a mixed-effects analysis with Tukey correction for multiple comparisons (mean ± s.e.m., n = 5 mice for Fluc-LNP and VHH-LNP treatments and n = 6 mice for saline treatment). *P = 0.0204 and ****P < 0.0001. f, Survival curves of tumor-bearing mice following two (n = 5 mice for Fluc-LNP and VHH-LNP treatments and n = 6 mice for saline treatment) or five (n = 5 mice) doses of indicated LNPs and CARs. g, Mice bearing WT MDA-MB-468 tumors were treated intratumorally with either saline or VHH-LNP followed by adoptive transfer of anti-VHH CAR T cells. h, Tumor growth curves of WT MDA-MB-468 tumor-bearing mice treated with saline, VHH-LNP or VHH-LNP + anti-VHH CAR T cells on days indicated by a dashed line (days 0 and 7). Statistical analysis was performed using a two-way ANOVA (mean ± s.e.m., n = 4 mice for VHH-LNP + CAR T cells and n = 5 mice for all other cohorts). ****P < 0.0001. hCAR, human CAR.
Fig. 7 |
Fig. 7 |. LNP-mediated syntAg treatment augments antitumor immunity in preclinical models of heterogenous tumors and mitigates outgrowth of antigen-negative tumor cells.
a, Mice bearing a heterogenous tumor mixture comprising 85% HER2 and 15% HER2+ MDA-MB-468 tumor cells were first treated with intratumorally with either saline or VHH-LNP followed by adoptive transfer of anti-VHH CAR T cells or anti-HER2 CAR T cells. b,c, Tumor growth curves (b) and individual spider plots (c) of heterogenous MDA-MB-468 tumors treated intratumorally with saline or VHH-LNP and systemically with indicated T cells on days indicated by a dashed line (days 0, 7 and 14). Statistical analysis was performed using a mixed-effect analysis with Tukey correction for multiple comparisons (mean ± s.e.m., n = 4 mice for WT and anti-HER2 CAR T cell treatments and n = 5 mice for LNP + WT and LNP + anti-VHH CAR T cell treatments). Saline + WT versus LNP + anti-VHH CAR T cell, **P = 0.0050 on day 16, ***P = 0.0008 on day 20 and ****P < 0.0001 for days 25–34; LNP + WT versus anti-HER2 CAR T cell, *P = 0.0337 for day 27, **P = 0.0010 for day 31 and ****P < 0.0001 for day 34. d, Tumors were isolated and evaluated for HER2 expression using flow cytometry. Data represent flow plots from n = 4 tumors, each from individual mice. e, Quantification of endogenous antigen (HER2) tumor composition at endpoint. Statistical analysis was performed using a multiple unpaired one-sided t-test (mean ± s.e.m., n = 4 tumors, each from individual mice). *P = 0.0427 for HER2 CAR versus LNP + WT and *P = 0.0267 for HER2 CAR versus saline + WT. H, HER2; V, VHH.

Similar articles

Cited by

References

    1. Lim WA & June CH The principles of engineering immune cells to treat cancer. Cell 168, 724–740 (2017). - PMC - PubMed
    1. Rafiq S, Hackett CS & Brentjens RJ Engineering strategies to overcome the current roadblocks in CAR T cell therapy. Nat. Rev. Clin. Oncol. 17, 147–167 (2020). - PMC - PubMed
    1. Hou AJ, Chen LC & Chen YY Navigating CAR-T cells through the solid-tumour microenvironment. Nat. Rev. Drug Discov. 20, 531–550 (2021). - PubMed
    1. Martinez M & Moon EK CAR T cells for solid tumors: new strategies for finding, infiltrating, and surviving in the tumor microenvironment. Front. Immunol. 10, 128 (2019). - PMC - PubMed
    1. Majzner RG & Mackall CL Tumor antigen escape from CAR T-cell therapy. Cancer Discov. 8, 1219–1226 (2018). - PubMed

LinkOut - more resources