. 2025 Jun;6(6):1017-1034.
doi: 10.1038/s43018-025-00963-w. Epub 2025 May 16.

MCSP+ metastasis founder cells activate immunosuppression early in human melanoma metastatic colonization

Affiliations

MCSP+ metastasis founder cells activate immunosuppression early in human melanoma metastatic colonization

Severin Guetter et al. Nat Cancer. 2025 Jun.

Abstract

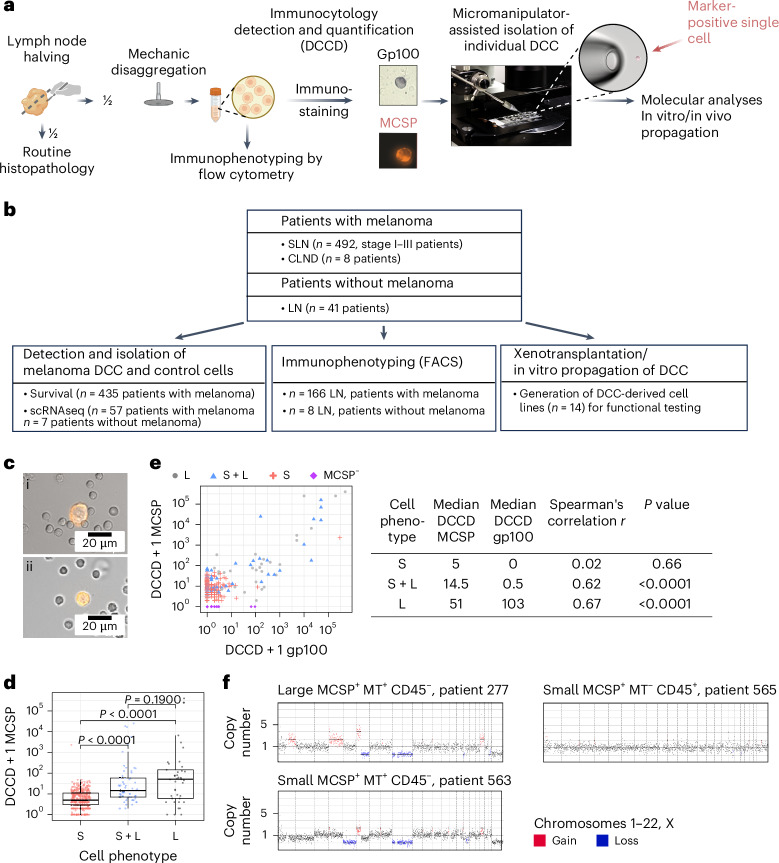
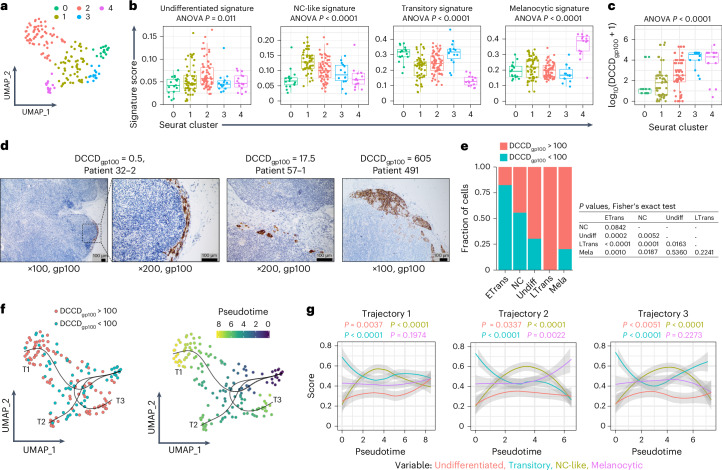
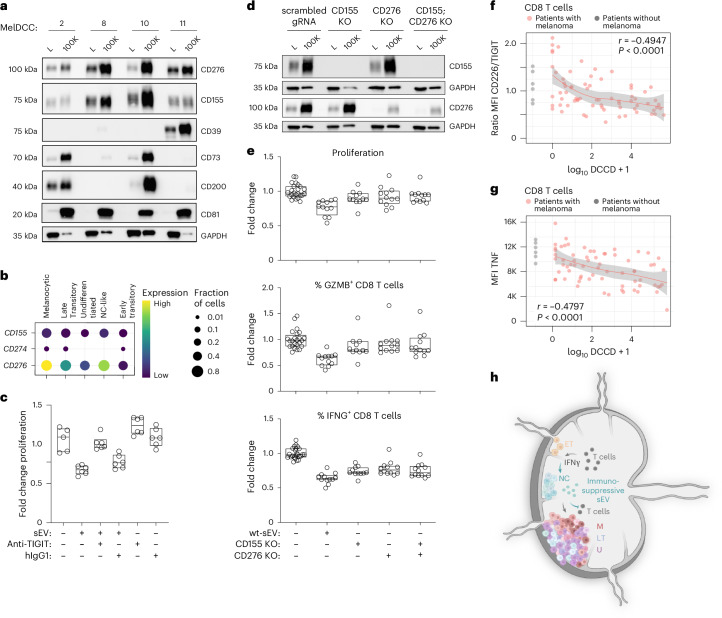
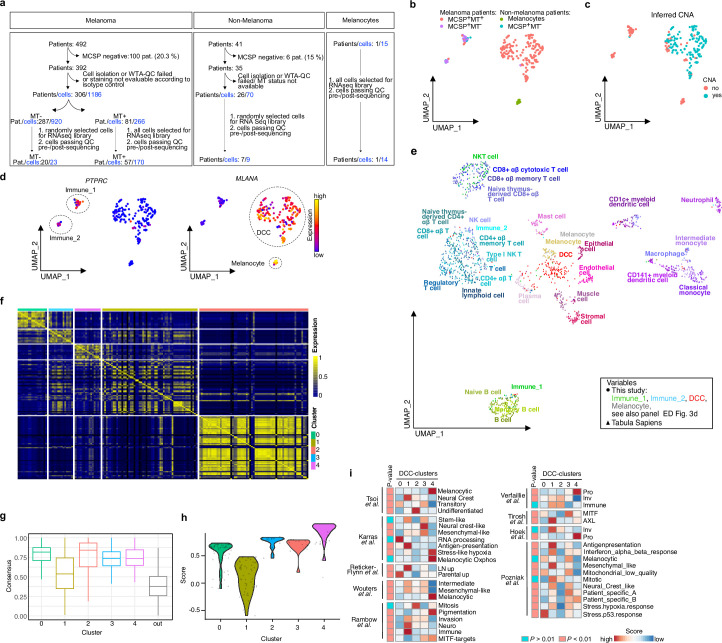
To investigate the early, poorly understood events driving metastatic progression, we searched for the earliest detectable disseminated cancer cells (DCCs), also often referred to as disseminated tumor cells (DTCs), in sentinel lymph node (SLN) biopsies of 492 patients with stage I-III melanoma. Using micromanipulator-assisted isolation of rare DCCs, single-cell mRNA and DNA sequencing, codetection by indexing immunofluorescence imaging and survival analysis, we identified melanoma-associated chondroitin sulfate proteoglycan (MCSP)+ melanoma cells as metastasis founder cells (MFCs). We found that DCCs entering SLNs predominantly exhibited a transitory phenotype that, upon interferon-γ exposure triggered by CD8 T cells, dedifferentiated into a neural-crest-like phenotype. This was accompanied by increased production of small extracellular vesicles (sEVs) carrying the immunomodulatory proteins CD155 and CD276 but rarely programmed cell death protein 1 ligand 1. The sEVs suppressed CD8 T cell proliferation and function, facilitating colony formation. Targeting MCSP+ MFCs or their immune escape mechanisms could be key to curing melanoma early by preventing manifestation of metastasis.


Conflict of interest statement

Competing interests: The authors declare no competing interests.

Figures

Fig. 1
Fig. 1. MCSP+ LN-derived cells comprise melanoma and nonmelanoma cells.
a, LNs were split into halves for routine histopathology and IC. After mechanical disaggregation, single-cell suspensions were stained for gp100 or MCSP. Positive events were counted and recorded per million LN cells and isolated by micromanipulation. Isolated cells underwent single-cell molecular analyses. MCSP+ cells were propagated in vivo and in vitro. Immunophenotyping of LN cells was performed by flow cytometry if the number of leftover cells permitted. b, Overview of patients and methods. CLND, complete LN dissection. FACS, fluorescence-activated cell sorting. c, MCSP staining intensity and diameter of MCSP+ cells in SLNs of patients with melanoma with large, intensely stained cells (i) and small cells (ii). Scale bars are as indicated on the merged images of fluorescence and bright-field channels. d, DCCDMCSP of LNs with MCSP+ cells (n = 477 SLNs from 392 patients) separated according to detected cellular phenotypes (diameter) into small (S; n = 378 SLNs), small and large (S + L; n = 58 SLNs) and large (L; n = 41 SLNs). e, Correlation of DCCDMCSP and DCCDgp100 in SLNs stained for both MCSP and gp100 (n = 542 SLNs, 430 patients). Displayed are phenotypes of MCSP+ cells (S, n = 335 SLNs; S + L, n = 54 SLNs; L, n = 37 SLNs) and SLNs negative for MCSP (MCSP cells, n = 116 SLNs). f, Representative CNA profiles of small and large MCSP+MT+CD45 and small MCSP+MTCD45+ cells. P values in d were determined using a Wilcoxon test. P values in e were determined using Spearman’s rank correlation. Statistical tests were two-sided. Boxes mark the median, lower quartile and upper quartile, with whiskers extending to the minimum and maximum values within 1.5 times the interquartile range. Points beyond this range are shown as outliers. Source data
Fig. 2
Fig. 2. MCSP+ DCCs impose high risk of progression.
ad, Kaplan–Meier curves of PFS, MSS and OS of patients stratified according to IC, MT assay or histopathology results. a, Patients with LNs without MCSP cells (MCSP, n = 99), positive for MCSP+MT cells (n = 238) or positive for MCSP+MT+ cells (n = 98). b, Patients with MCSPgp100+ LNs (n = 10) or MCSP+MT+gp100 LNs (n = 23) (b). c, Patients with gp100+ cells (n = 142) stratified according to whether MCSP+ DCCs (gp100+MCSP+MT+, n = 63) were codetected in the SLN (gp100+MCSP or MCSP+MT, n = 79). d, Patients with histopathology-negative SLNs (N0, n = 296) stratified according to whether IC was negative for MCSP+MT+ and gp100+ DCCs (N0 and IC-negative, n = 196), positive for gp100+ DCCs only (N0 and gp100+MCSP or MCSP+MT, n = 63) or positive for MCSP+MT+ DCCs with or without codetection of gp100+ DCCs (N0, MCSP+MT+ and gp100+ or gp100, n = 37). eg, Multivariable Cox regression analysis for PFS (e), MSS (f) and OS (g) comprising the most informative, backward selected features (n = 380). Patients without MCSP+MT+ cells, female patients and patients without ulceration were used as the reference for defining the hazard ratio (HR). Parameters marked with an asterisk (*) were analyzed as continuous variables, that is, the increase in age (in year), N category (N status) and thickness (in mm). The dots represent the HRs and the whiskers indicate the 95% confidence interval (CI). AIC, Akaike information criterion. P values in ad were determined using a log-rank test. P values in e,f were determined using a Wald test. All statistical tests were two-sided. The baseline characteristics of patients are listed in Table 1. Source data
Fig. 3
Fig. 3. Metastatic colonization is associated with phenotypic plasticity of melanoma DCCs.
ac, scRNA-seq data from the DCC group (n = 164 cells; Extended Data Fig. 3d). Each point represents an individual cell. The clusters are labeled 0, 1, 2, 3 and 4, with corresponding cell numbers of n = 17, 55, 63, 14 and 15, respectively. Louvain clustering with Seurat based on UMAP Seurat (a). Signature scores of the four melanoma phenotypes for DCCs annotated by Seurat cluster labels (b). DCCDgp100 annotated by Seurat cluster label (c). d, Representative examples of SLNs analyzed by histopathology using gp100 staining. The results of the matched LN half analyzed by IC are provided as DCCD. The examples illustrate that a DCCDgp100 < 100 in IC corresponds to isolated tumor cells in histopathology, while a DCCDgp100 > 100 corresponds to micrometastasis. e, Percentage of DCCs (n = 164 cells) before (DCCDgp100 < 100, n = 67 cells) and after (DCCDgp100 > 100, n = 97 cells) metastatic colony formation displaying the different phenotypes. f, Inferred trajectories (T1, T2 and T3) with slingshot. Left: each cell is colored according to its DCCD (DCCDgp100 < 100, blue, n = 67 cells; DCCDgp100 > 100, red, n = 97 cells). Right: each cell is colored according to its pseudotime. g, Melanocytic, NC-like, transitory and undifferentiated signature scores with AUCell score along pseudotime (slingshot) of trajectories 1–3. The gray areas indicate the 95% CI of the curves. P values in b,c were determined using a one-way ANOVA. All statistical tests were two-sided. Boxes mark the median, lower quartile and upper quartile, with whiskers extending to the minimum and maximum values within 1.5 times the interquartile range. Points beyond this range are shown as outliers. P values in e were determined using a Fisher’s exact test. P values in g were determined using a chi-square test. Source data
Fig. 4
Fig. 4. NC-like DCCs crosstalk with immune cells.
a,b, scWGCNA using top variable genes. Cluster dendrograms group genes into distinct modules (a), with module score summaries plotted against DCC samples of each Seurat cluster (x axis) (b). c, Enrichr gene set enrichment analysis. Enriched Gene Ontology and Hallmark collection terms in the Molecular Signature Database assigned to genes in brown, blue and yellow modules. d, Immunofluorescence staining and quantification of CD74 and Melan A in MCSP+ and MCSP cells in SLNs with DCCD < 100 (n = 28 patients per SLN) and DCCD > 100 (n = 13 patients per SLN) and cell nuclei (DAPI). Plots depict the fold change in gray of Melan A or CD74 immunofluorescence of MCSP+ (DCCD < 100, n = 402 cells; DCCD > 100, n = 230 cells) and MCSPCD74+ cells (n = 366 cells) relative to MCSPCD74 cells (n = 765 cells). e, CODEX multiplex immunofluorescence for Melan A, CD3, IFNG, TIM3 and CD47 in SLN (n = 2 patients) with incipient metastatic colonization. Note the absence of CD3 and TIM3 double-positive cells. Scale bars, 50 µm. f, Percentage of PD1+TIM3+ CD8 T cells and CD4+CD25+CD127 Treg cells in LNs from patients with melanoma (red; n = 116 for PD1+TIM3+ CD8 T cells and n = 57 for Treg cells) and patients without melanoma (gray; n = 8 for PD1+TIM3+ CD8 T cells and n = 3 for Treg cells) as a function of their DCCD values on a log scale. The red line provides the percentages for the model where log10(DCCD + 1) is entered as a continuous variable (gray area, 95% CI). g, CODEX multiplex immunofluorescence imaging for Melan A, CD3, IFNG, TIM3 and CD47 (as ubiquitously expressed cell surface protein) in an LN with high DCCD. White triangles indicate CD3 and TIM3 double-positive cells. Scale bars, 100 µm. h, Representative flow cytometric analysis of PD1 and TIM3 expression in CD3+CD8+ T cells from LNs of a patient without tumor and two LNs from a patient with melanoma from the same regional bed. P values in b were determined using a one-way ANOVA. P values in c were determined using a hypergeometric test. P values in d were determined using a one-way ANOVA with Dunn’s post hoc analysis. P values in f were determined using Pearson’s correlation. All statistical tests were two-sided. Source data
Fig. 5
Fig. 5. IFNG-induced acquisition of the NC-like phenotype enhances secretion of T cell-suppressive sEVs by melanoma DCCs.
a, Flow cytometric analysis of MelDCC 5a, 6, 10a and 11 for Melan A and NGFR expression before (day 0) and after 4 weeks of IFNG treatment (day 28) or after 4 weeks of IFNG treatment followed by 48 h in IFNG-free EV production medium (day 30). b, Fold change in the number of sEVs secreted per million MelDCCs over 48 h, either untreated or treated with IFNG for 28 days, followed by 48 h in IFNG-free EV production medium (n = 6 technical replicates each). c, WB analysis of EV pellets (2K, 10K and 100K) isolated from MelDCC 10a, using antibodies for small (CD81 and TSG101) and large (GRP94) EV markers or the pan-EV marker HSP70. L, whole-cell lysate. d, TEM of 100K preparations. Left, negative staining; right, freeze-etching. e,f, Flow cytometric analysis of proliferation and effector cytokine production (IFNG and GZMB) in polyclonal (e) or MART127L26-35-specific (f) CD8 T cells exposed to sEV from MelDCC 10a or PBS for 18 h before (−18 h) or after anti-CD3/CD28 stimulation (+18 h) (n = 6 technical replicates each). g, Cytotoxic activity of MART127L26-35-specific CD8 T cells exposed or not to sEVs from MelDCC 10a 18 h before anti-CD3/CD28 stimulation. CD8 T cells were harvested on day 4 and added at an effector-to-target ratio of 1:1 to MART127L26-35-loaded CFSE-labeled T2 cells. Nonloaded, CellTrace violet-labeled T2 cells served as nontarget controls (n = 6 technical replicates each). h, Flow cytometric analysis of Ki67+ CD8 T cells in human PCLSs (n = 4 patients) 5 days after anti-CD3/CD28 stimulation and exposure to high or low doses of sEVs (sEVs produced by 6.25 × 106 or 1.25 × 106 MelDCC 10a cells) or 5 µM pimecrolimus. Nonstimulated PCLSs served as the control. sEVs or pimecrolimus was added 18 h after stimulation. Shown is the median (line) with range (whiskers) delineating the minimum and maximum values. P values in h were determined using a one-way ANOVA with Dunnett’s post hoc multiple-comparison test (two-sided). Boxes represent the median, lower quartile and upper quartile, with individual data points illustrating the data distribution. Source data
Fig. 6
Fig. 6. Melanoma DCCs suppress T cells through CD155 and CD276.
a, WB for various ICLs in MelDCC lines and their respective 100K pellets. b, Expression of ICLs in DCCs separated according to their phenotype (scRNA-seq data of DCCs; n = 164 cells). c, Flow cytometric analysis of CD8 T cell proliferation on day 4 after anti-CD3/CD28 stimulation and addition of PBS (n = 5 technical replicates) or MelDCC 10a sEVs in the presence or absence of 10 µg of anti-human TIGIT antibody or human IgG1 isotype control (all n = 6 technical replicates). The bar indicates the median. d, WB for CD155 and CD276 expression in MelDCC 10a controls or CD155;CD276 single or double knockout and their respective 100K pellets. KO, knockout; gRNA, guide RNA. e, Flow cytometric analysis of CD8 T cell proliferation and percentage of IFNG+ and GZMB+ CD8 T cells on day 4 after anti-CD3/CD28 stimulation and addition of PBS or sEVs of MelDCC 10a (wild-type sEVs) and MelDCC 10a with CD155;CD276 single or double knockout 18 h before anti-CD3/CD28 stimulation. Experiments with CD155 or CD276 single-knockout or CD155;CD276 double-knockout sEVs were performed independently with n = 11–12 technical replicates per condition and results were normalized to their respective PBS controls to enable a pooled comparative analysis. f,g, Flow cytometric analysis of CD226:TIGIT (f) and TNF (g) expression in CD8 T cells from LNs of patients with melanoma (n = 69 LNs) and patients without melanoma (n = 6 LNs). Mean fluorescence intensity of marker expression by CD8 T cells as a function of patient DCCD. The red line provides the LOESS regression where log10(DCCD + 1) is entered as a continuous variable (gray area, 95% CI; values for patients with and without melanoma are presented as red and gray dots). h, Synopsis of DCC phenotype switching during metastatic colony formation in human melanoma. Acquisition of the NC-like phenotype enables DCCs to suppress early CD8 T cell attack by immunosuppressive sEVs. M, melanocytic; U, undifferentiated; ET and LT, early and late transitory phenotypes. P values in f,g were determined using Pearson’s correlation (two-sided). Boxes represent the median, lower quartile and upper quartile, with individual data points illustrating the data distribution. Source data
Extended Data Fig. 1
Extended Data Fig. 1. Combining MCSP immunofluorescence with melanoma transcript and genome analysis identifies melanoma DCCs.
a, Schematic overview of analyzed patient samples, drop-out causes and reference to individual figure panels. Number of patients, SLNs and cells are depicted in black, red and blue, respectively. b, Staining intensity of MCSP+ cells in SLNs and LNs of melanoma and nonmelanoma patients. Scale bar as indicated. See also Fig. 1c for merged images of fluorescence and bright field channels of MCSP+ cells in SLNs of melanoma patients. c, Percentage of MCSP+ SLNs of melanoma patients with MCSP+ cells separated according to their phenotype (diameter) into small (S), small and large (S + L), large (L) cells. SLN numbers see panel a) and main text. d, Percentage of gp100-MCSP+ (n = 275) and gp100+MCSP- SLN (n = 17) among SLNs of melanoma patients with staining-results for both gp100 and MCSP (n = 542). gp100-MCSP+ SLNs are annotated according to the observed phenotype (diameter) of detected MCSP+ cells. e, Percentage of MCSP+ small (n = 789) and large (n = 237) cells negative or positive for MT expression (gp100, DCT and MLANA), either alone (single+) or in combination (double+ for any two markers or triple+). f, Percentage of MCSP+MT- cells with or without CD45 expression isolated from melanoma (MT- small cells, n = 715) and nonmelanoma patients (MT- small cells, n = 61), MT = melanoma transcripts. g, Cumulative frequency plots of genomic aberrations in MCSP+MT+CD45- large (n = 13) and small (n = 15) cells with genomic gains and losses in orange and blue, respectively. Source data
Extended Data Fig. 2
Extended Data Fig. 2. MCSP defines a subset of melanoma DCC linked to systemic progression.
a, Schematic overview of analyzed patient samples and exclusion criteria. Note reference to individual figure panels. b, left panel: Melanoma patients with IC positive SLNs (n = 165). Percentage and number of patients with SLNs single-positive for gp100+ DCCs (79/165) or MCSP+ DCCs (23/165) or double-positive for gp100+ DCCs and MCSP+ DCCs (63/165). Right panel: Percentage and number of patients with Gp100+ DCCs in their SLNs, in whom MCSP+ DCCs were co-detected or not. c, Impact of LN involvement at diagnosis on metachronous distant metastasis. SLN+: patients with gp100+ and/or MCSP+MT+ cells in the SLN or with a positive SLN by histopathology. Patients without LN involvement: patients lacking gp100+ or MCSP+MT+ cells in SLN, a negative SLN by histopathology and without evidence of LN involvement at any time during the disease. P values in c, Fisher’s exact test (two-sided). See Table 1 for baseline characteristics of the study cohort. Source data
Extended Data Fig. 3
Extended Data Fig. 3. MCSP+ melanoma DCC display different phenotypes during metastatic colonization.
a, Schematic overview of analyzed patient samples and exclusion criteria. The number of patients and cells are depicted in black and blue, respectively. b-d, UMAP of scRNA-seq data of LN-derived small and large MCSP+MT+ cells (n = 170 cells) and MCSP+MT- cells (n = 23 cells) from melanoma patients, LN-derived MCSP+ cells from nonmelanoma patients (n = 9 cells) and cultured human melanocytes (n = 14 cells) with Seurat. Cells are annotated by their patient origin (melanoma, nonmelanoma patient) and cell type (melanocyte, MCSP/MT-status) (b), gene expression inferred CNA (c) or expression of marker genes for immune cells (PTPRC/CD45) and cells of melanocytic origin (MLANA) (d). e, scRNA-seq data (see panel d) integrated into skin and LN of the Human Cell Atlas (Tabula sapiens). Each cell type retrieved from the Human Cell Atlas (n = 33 cell types) was downsampled to contain 50 cells. Each cell is colored by its assigned cluster or cell type. f, g, Stability of DCC cluster assignment (Fig. 3a, n = 164 cells) using Seurat was assessed by comparison with multiple alternative clustering methods and variable parameter combination. Consensus heatmap (f) and its quantification (g). The box plots (g) show consensus scores of cell pairs within Seurat clusters and consensus scores of cell pairs between different Seurat clusters. Boxes represent the median, lower quartile, and upper quartile, with whiskers extending to the minimum and maximum values within 1.5 times the interquartile range. h, Silhoutte score analysis for DCC clusters. i, AUCell scores based on published melanoma subtype marker gene sets averaged over DCC clusters. Source data
Extended Data Fig. 4
Extended Data Fig. 4. MCSP expression is preserved during metastatic progression of melanoma.
a, MCSP expression in the five DCC clusters and published scRNA-seq data sets ,,, or in melanoma cell lines of the Cancer Cell Line Encyclopedia. b, Representative examples of primary melanomas (PT) and metastases (met) analyzed by histopathology using MCSP staining. c, Expression of DCT, MCSP, MITF, PMEL, MLANA in relation to immunotherapy response in stage III/IV melanoma patients. Source data
Extended Data Fig. 5
Extended Data Fig. 5. Robust trajectories of phenotype changes can be identified from low to high DCCD.
a, Inferred trajectories (T1, T2, T3) with ElPiGraph. Left: each cell is colored according to its DCCD (DCCD < gp100 blue, n = 67 cells, DCCD > gp100 red, n = 97 cells). Right: each cell is colored according to its pseudotime. b, Melanocytic, neural-crest-like, transitory and undifferentiated signature scores with AUCell along pseudotime (EiPl) of trajectory 1-3. The grey area indicates the 95% confidence interval of the curves. P values according to Chi-square test (two-sided). c, Comparison of inferred pseudotime using Slingshot (x-axis) and ElPiGraph (y-axis) for trajectory 1-3 (T1, T2, T3). Each dot is a cell. NA indicates cells not belonging to the compared trajectories. Source data
Extended Data Fig. 6
Extended Data Fig. 6. The phenotypes of DCC and immune cells depend on colonization stage and their interaction.
a, Transcription factor regulatory network highly activated in cluster 1 DCC. Black letters and yellow circles indicate genes involved in interferon alpha/gamma signaling pathways. b - d, Flow cytometric analysis of sentinel and regional LNs from melanoma patients for PD1+TIM3+ CD8 T and CD4+CD25+CD127- regulatory T cells. Gating as indicated (b). Percentage of PD1+TIM3+ CD8 T cells (c; n = 9 patients) and CD4+CD25+CD127- regulatory T cells (d; n = 6 patients) plotted against the DCCD of LNs. Each dot represents one LN originating from the same regional bed of the corresponding melanoma patient. Patient IDs are indicated above each graph. Red dotted lines indicate the median percentage of PD1+TIM3+ CD8 T (n = 16 LNs) or CD4+CD25+CD127- T cells (n = 17 LNs) in DCC-free LNs of melanoma patients. Source data
Extended Data Fig. 7
Extended Data Fig. 7. DCC-derived cell lines reflect the diversity of ex vivo DCC phenotypes.
a, Expression of DCC-derived marker genes for the different phenotypes of early and late transitory (ET, LT), neural crest-like (NC), undifferentiated (U), and melanocytic (M) phenotypes in MelDCC 1-13, analyzed by bulk RNAseq in duplicates or triplicates of consecutive passages. b, Flow cytometric analysis of MelDCC 2, 5a, 6, 8, 10a, and 11 for NGFR (neural crest), Melan A (melanocytic), AXL (invasiveness), and MCSP expression. MelDCC2 was stained with anti-MCSP-FITC (clone EP-1), all other MelDCC lines with anti-MCSP-PE (clone 9.2.27). c, Western blot of 100 K sEVs or size-exclusion chromatography-separated 100 K sEV vesicle (SEC-V) and protein (SEC-P) fractions. Markers for exomeres (ACLY), and non-EV contaminants (fibronectin, FN1; calnexin, CANX; histone H2A; albumin, ALB) and sEV (CD81, TSG101), and pan-EV (HSP70, GAPDH) were used. Loaded per lane: 2.5×10⁶ sEVs, 106 cells, 10 µg whole cell lysate (L). The albumin signal in SEC-V and SEC-P samples is due to the absence of a washing step in the SEC workflow, unlike ultracentrifugation. d, Particle size and NTA quantification of sEVs secreted per million MelDCC cells over 48 h. MelDCC 2, 5a, 6, 8, 10a, and 11 (n = 18, 15, 9, 12, 11, and 23). N = biological replicates. e, Size distribution of CD81+ 100 K sEVs from MelDCC 10a (n = 7 biological replicates, indicated by different color codes) determined by NTA. f, Western blot of 100 K sEVs from untreated or IFNG-treated MelDCC 6 for 4 weeks. Loaded are sEVs from 0.5×10⁶ cells/lane. Source data
Extended Data Fig. 8
Extended Data Fig. 8. MelDCC-derived sEVs suppress CD8 T cell proliferation and function.
a-c, CD8 T cell proliferation and IFNG/GZMB production 4 days after anti-CD3/CD28 stimulation. Cells exposed to PBS or sEVs (MelDCC 10a in panel a-c; MelDCC 2, 5a, 6, 8, 10a, 11 in panel c). sEVs were added 18 h before stimulation at a 50:1 ratio unless otherwise noted. Experiments were performed in two independent experimental sets with n = 3 (w/o EV, MelDCC2, 8, 10a, 11), n = 6 (MelDCC5a, 6) technical replicates per MelDCC, and results were normalized to the respective PBS control (n = 3 technical replicates for MelDCC 2, 8, 10a, 11 and n = 5 for MelDCC 5a, 6) to enable a pooled comparative analysis. Bars indicate the median, with individual data points illustrating the data distribution (b,c). d, Uptake of CFSE-labeled sEVs by anti-CD3/CD28-stimulated polyclonal human CD8 T cells incubated with PBS or sEVs for 24 h at a 50:1 or 10:1 ratio (n = 3 technical replicates). e, Flow cytometric analysis of cytotoxicity using MART127L26-35-loaded, CFSE-labeled T2 target cells (red gate) and non-loaded, CellTrace Violet-labeled T2 cells (blue gate) as non-target controls. In the presence of antigen-specific T cells, the fraction of target cells (red gate) decreases due to the cytotoxic T cell activity as compared to non-target control cells (blue gate). The cytotoxicity of T cells is decreased when CD8 T cells were exposed to sEV prior to anti-CD3/CD28 stimulation. f, CD8 T cell proliferation and IFNG/GZMB production 4 days after exposure to PBS, 100 K sEVs or SEC-V/SEC-P-fractions derived from 100 K sEVs of MelDCC 10a. Experiments with SEC-V/P and 100 K sEVs were performed independently with n = 12 technical replicates (SEC-V/P) and n = 9 (100 K, 3 experiments with 3 technical replicates each), and results were normalized to the respective PBS controls to enable a pooled comparative analysis. Boxes represent the median, lower quartile, and upper quartile, with individual data points illustrating the data distribution. Source data
Extended Data Fig. 9
Extended Data Fig. 9. The immune checkpoint ligands CD155 and CD276 are expressed by MelDCC and associated with sEV.
a, Transcript Expression of CD155, CD274 and CD276 by MelDCC 1-13. Each cell line was analyzed by bulk RNAseq and in duplicates or triplicates of consecutive passages. b, c, Western blot analysis for presence of ICL in whole cell lysates of MelDCC lines (L) and their respective 100 K pellets. sEVs from 2.5×10⁶ cells/lane and 15 µg whole cell lysates/lane were loaded. d, Western blot analysis for presence of the ICLs CD155, CD276 and the EV markers CD81 and GAPDH in 100 K sEVs of MelDCC 6 untreated or treated with IFNG for 4 weeks. 2×10⁹ sEVs/lane were loaded, as determined by NTA. e, Flow cytometric analysis of CD155, CD274 and CD276 expression in MelDCC lines cultured in the absence (red) or presence of 500 U IFNG for 14 (blue), 21 (orange) or 28 (green) days. As isotype controls (black line) did not differ between the time points, only the isotype control of untreated cells at d0 is shown. f, g, Expression of CD155, CD276 and CD274 in publicly available scRNA-seq data of melanoma –,, (f) or bulkRNAseq of cell lines of the Cancer Cell Line Encyclopedia (g). h, Western blot analysis for the presence of CD155 and CD276 in a 100 K EV-preparation separated by size exclusion chromatography into a vesicle (SEC-V) and protein (SEV-P) fraction. sEVs from 2.5×10⁶ cells/lane were loaded. i-k, Inhibition of EV-biogenesis in MelDCC 6 by 50 µM Macitentan. Western blot for the ICLs CD155 and CD276 and the EV-markers CD81 and GAPDH in 100 K sEVs isolated from untreated or Macitentan-treated MelDCC 6. sEVs from 0.5×10⁶ cells/lane were loaded (i). NTA-based enumeration of sEVs secreted per million cells within 48 h of DMSO or Macitentan-treated MelDCC 6 (j, n = 3 technical replicates). Flow cytometric analysis of cell surface expression of CD155, CD276 and CD81 on MelDCC 6 treated with DMSO or Macitentan (k). l, Western blot analysis of sEVs treated with PBS, Triton X-100, Proteinase K or Proteinase K plus Triton X-100 for CD81, CD155, CD276 and GADPH. sEVs from 0.5×10⁶ cells/lane were loaded. Source data
Extended Data Fig. 10
Extended Data Fig. 10. sEV-associated CD155 and CD276 suppress CD8 + T Cell proliferation and function.
a, Western blot analysis for IL20RA expression in CD8 T cells from a healthy donor and HeLa cells as positive control. 20 µg of whole cell lysates/lane were loaded. b, Flow cytometric analysis of TIGIT and CD226 expression in CD8 T cells from peripheral blood of a healthy donor. c, Flow cytometric analysis for CD155 and CD276 expression in MelDCC 10a CD155;CD276 single or double knock-outs and scrambled gRNA electroporated control. d, Flow cytometric analysis of CD8 T cell proliferation and percentage of GZMB-IFNG+, GZMB+IFNG+ and GZMB+IFNG- CD8 T cells at day 4 after anti-CD3/CD28 stimulation and addition of PBS or sEVs of MelDCC 10a (wt EV) and MelDCC 10a with CD155/CD276 single or double knock-out 18 h before anti-CD3/CD28 stimulation. Experiments with CD155 single and CD276 single/double-knock out sEV were performed independently with n = 11 (CD155 k.o.) and n = 12 (CD276 k.o., CD155/CD276 k.o.) technical replicates per group, and results were normalized to the respective PBS controls to enable a pooled comparative analysis. e, Flow cytometric analysis of TIGIT and CD226 expression in polyclonal CD8 T cells from LNs of melanoma patients (n = 69 LNs) and nonmelanoma patients (n = 6 LNs). MFI of marker expression by CD8 T cells as a function of patient DCCD. The red line provides LOESS regression where log10(DCCD + 1) is entered as a continuous variable (grey area, 95% CI; values for melanoma and nonmelanoma patients presented as red and grey dots, respectively). f, Expression levels of TIGIT and CD226 in PD1highTIM3high (red gate in dot plot and red line in histograms) and PD1lowTIM3low (black gate in dot plot and black line in histograms) of a patient LN from panel e) with high DCCD (250.000). P values in e, according to Pearson’s correlation, two-sided. Boxes represent the median, lower quartile, and upper quartile, with individual data points illustrating the data distribution. Source data

References

    1. Wolchok, J. D. et al. Long-term outcomes with nivolumab plus ipilimumab or nivolumab alone versus ipilimumab in patients with advanced melanoma. J. Clin. Oncol.40, 127–137 (2022). - PMC - PubMed
    1. Werner-Klein, M. et al. Genetic alterations driving metastatic colony formation are acquired outside of the primary tumour in melanoma. Nat. Commun.9, 595 (2018). - PMC - PubMed
    1. Elsner, F. et al. Disseminated cancer cells detected by immunocytology in lymph nodes of NSCLC patients are highly prognostic and undergo parallel molecular evolution. J. Pathol.258, 250–263 (2022). - PubMed
    1. Werner-Klein, M. et al. Interleukin-6 trans-signaling is a candidate mechanism to drive progression of human DCCs during clinical latency. Nat. Commun.11, 4977 (2020). - PMC - PubMed
    1. Al-Hajj, M., Becker, M. W., Wicha, M., Weissman, I. & Clarke, M. F. Therapeutic implications of cancer stem cells. Curr. Opin. Genet. Dev.14, 43–47 (2004). - PubMed

Substances