

Evaluation of MRI for initial staging of esophageal cancer: the STIRMCO study
- PMID: 40379940
- PMCID: PMC12559062
- DOI: 10.1007/s00330-025-11549-6
Evaluation of MRI for initial staging of esophageal cancer: the STIRMCO study
Abstract
Objectives: To compare the diagnostic accuracy of MRI and PET/CT combined versus standard staging methods (CT, endoscopic ultrasound [EUS], and PET/CT) for initial staging of esophageal cancer (EC).
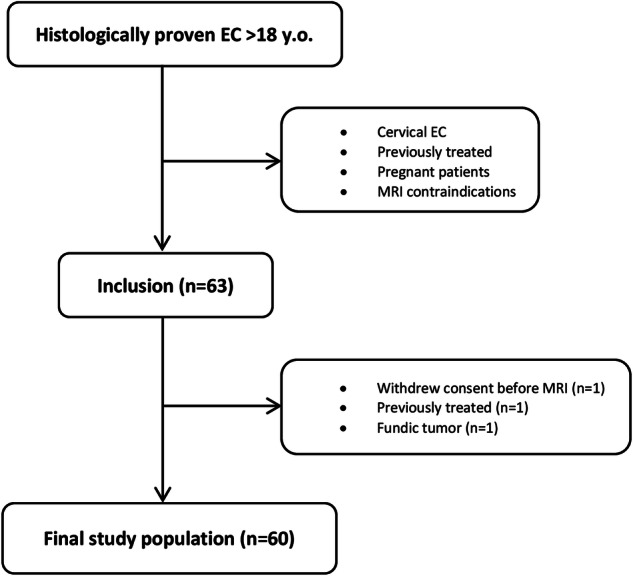
Materials and methods: This study included patients newly diagnosed with histologically proven EC between 2017 and 2021. Patients underwent a 3-T esophageal MRI alongside standard staging (CT, EUS, PET/CT) prior to treatment. TNM-stages were assessed by two independent reviewers for MRI, CT, and PET/CT, with EUS evaluated by one operator. Discrepancies were resolved by a third reviewer. Patients were categorized based on treatment management: surgery (T1-T2N0M0), neoadjuvant (radio)chemotherapy (T3-T4a and/or N1-N2-N3M0), and palliative chemotherapy (T4b and/or M1). The reference standard was histopathology from surgical specimens or TNM staging from tumor board discussions. The area under the curve (AUC) was calculated for each imaging combination.
Results: 60 patients newly diagnosed with EC (50M/10F; mean age 66.5 years) were prospectively enrolled. MRI + PET/CT combination exhibited the highest AUC (0.92, 95% CI: 0.79-1) for differentiating curative versus palliative patients, without statistically significant difference compared to CT + EUS (0.80, 95% CI: 0.56-1, p = 0.34), CT + PET/CT (0.77, 95% CI: 0.53-1, p = 0.42), and CT + EUS + PET/CT (0.78, 95% CI: 0.58-0.97, p = 0.26). In term of differentiating patients eligible for upfront surgery from those with indication for neoadjuvant (radio)chemotherapy, the combination of CT + EUS + PET/CT demonstrated the highest AUC (0.90, 95% CI: 0.75-1) without statistically significant difference compared to CT + EUS (0.82, 95% CI: 0.56-1, p = 0.49), CT + PET/CT (0.79, 95% CI: 0.46-1, p = 0.36), and MRI + PET/CT (0.83, 95% CI: 0.65-1, p = 0.59).
Conclusion: MRI + PET/CT combination is highly accurate for initial EC staging and non-inferior to standard methods, offering less invasiveness and reduced radiation exposure.
Key points: Question Can MRI help improve the TNM staging of esophageal cancer? Findings MRI + PET/CT showed no statistically significant difference compared to endoscopic ultrasound (EUS) + CT + PET/CT in identifying curative vs palliative patients but with a tendency for improved staging. Clinical relevance Thoraco-abdominal MRI can provide added value (as a replacement of CT and EUS) in initial staging of esophagus cancer, particularly in cases of stenotic or advanced tumors.
Keywords: Esophageal neoplasms; Magnetic resonance imaging; Neoplasm staging.
© 2025. The Author(s).
Conflict of interest statement
Compliance with ethical standards. Guarantor: The scientific guarantor of this publication is Clarisse Dromain. Conflict of interest: The authors of this manuscript declare no relationships with any companies, whose products or services may be related to the subject matter of the article. Statistics and biometry: One of the authors has significant statistical expertise. Informed consent: Written informed consent was obtained from all subjects (patients) in this study. Ethical approval: Institutional Review Board approval was obtained. Study subjects or cohorts overlap: No study subjects or cohorts have been previously reported. Methodology: Prospective Diagnostic study Performed at one institution
Figures


References
-
- Bray F, Ferlay J, Soerjomataram I, Siegel RL, Torre LA, Jemal A (2018) Global cancer statistics 2018: GLOBOCAN estimates of incidence and mortality worldwide for 36 cancers in 185 countries. CA Cancer J Clin 68:394–424 - PubMed
-
- Sung H, Ferlay J, Siegel RL et al (2021) Global cancer statistics 2020: GLOBOCAN estimates of incidence and mortality worldwide for 36 cancers in 185 countries. CA Cancer J Clin 71:209–249 - PubMed
-
- De Angelis R, Sant M, Coleman MP et al (2014) Cancer survival in Europe 1999–2007 by country and age: results of EUROCARE-5—a population-based study. Lancet Oncol 15:23–34 - PubMed
-
- Arnold M, Ferlay J, van Berge Henegouwen MI, Soerjomataram I (2020) Global burden of oesophageal and gastric cancer by histology and subsite in 2018. Gut 69:1564–1571 - PubMed
Publication types
MeSH terms
LinkOut - more resources
Full Text Sources
Medical
