. 2025 Jun;17(6):1475-1494.
doi: 10.1038/s44321-025-00248-w. Epub 2025 May 16.

High-purity AAV vector production utilizing recombination-dependent minicircle formation and genetic coupling

Affiliations

High-purity AAV vector production utilizing recombination-dependent minicircle formation and genetic coupling

Hao Liu et al. EMBO Mol Med. 2025 Jun.

Abstract

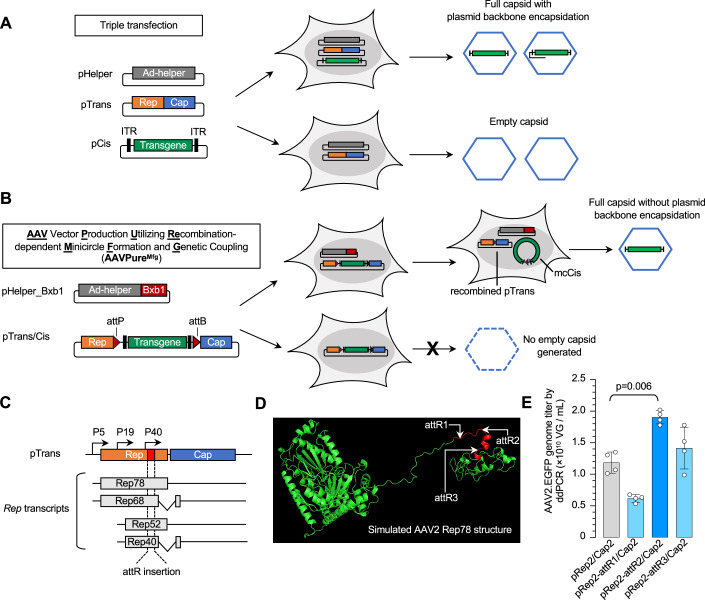
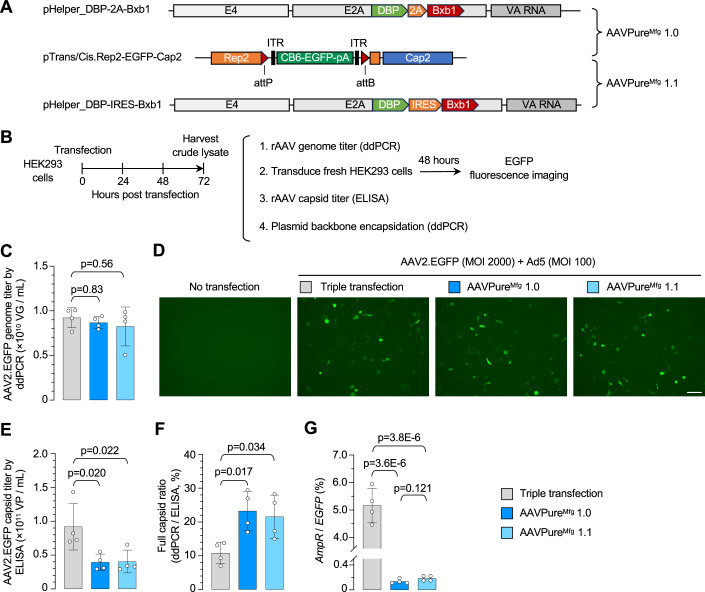
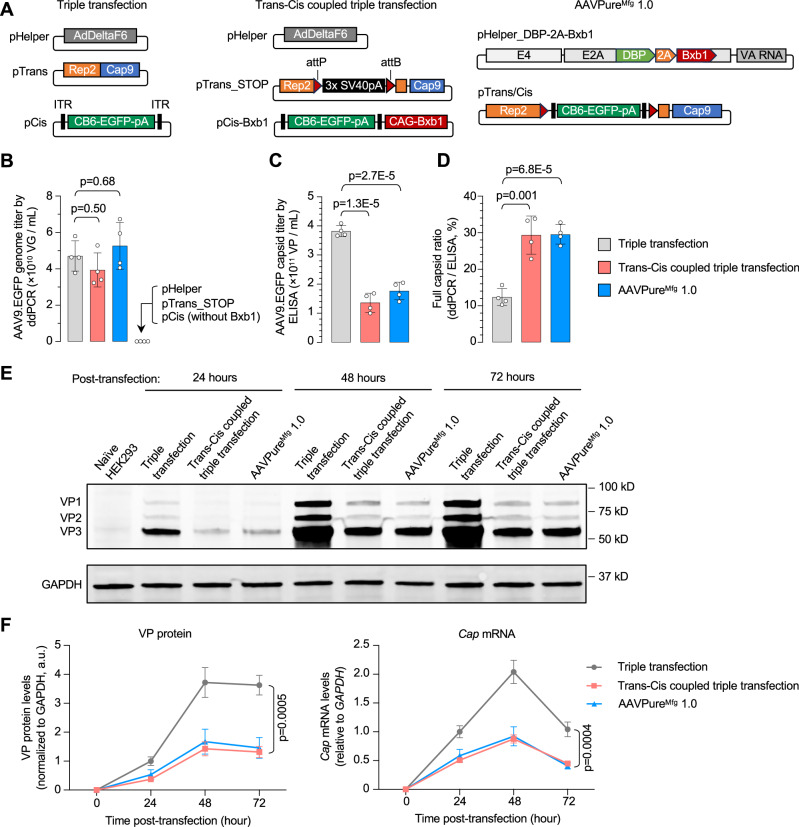
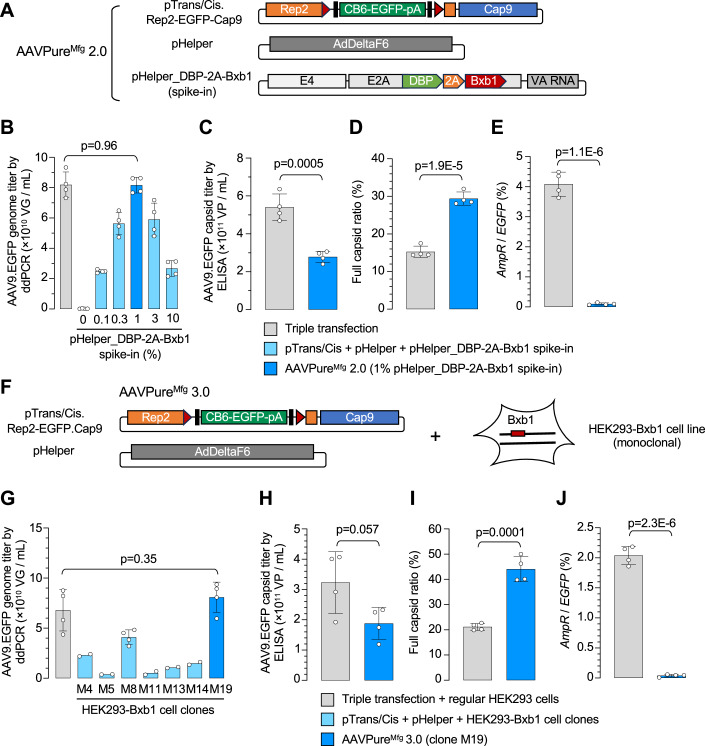
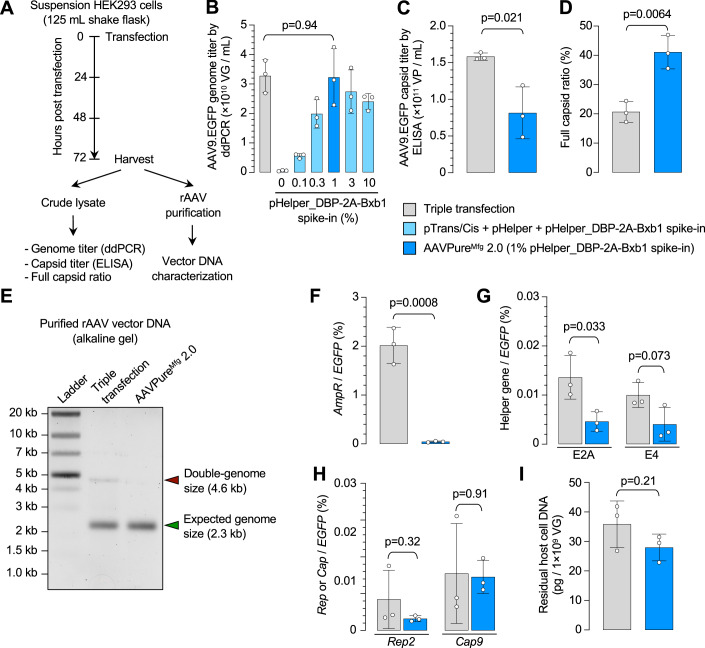
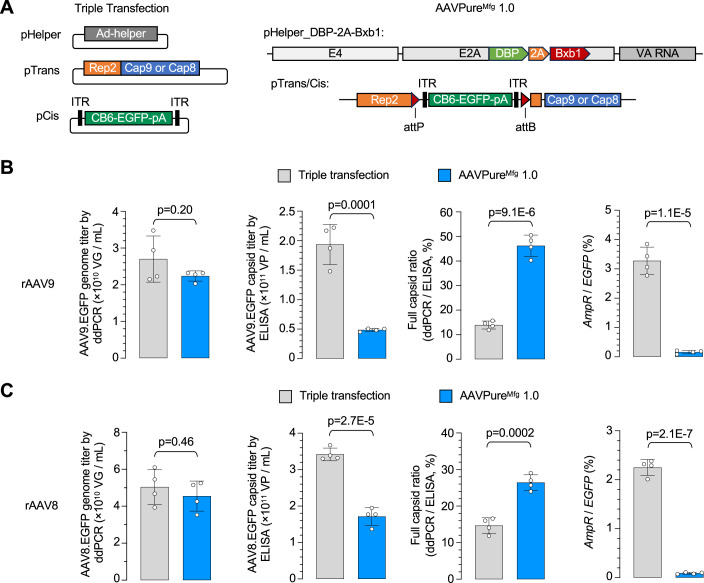
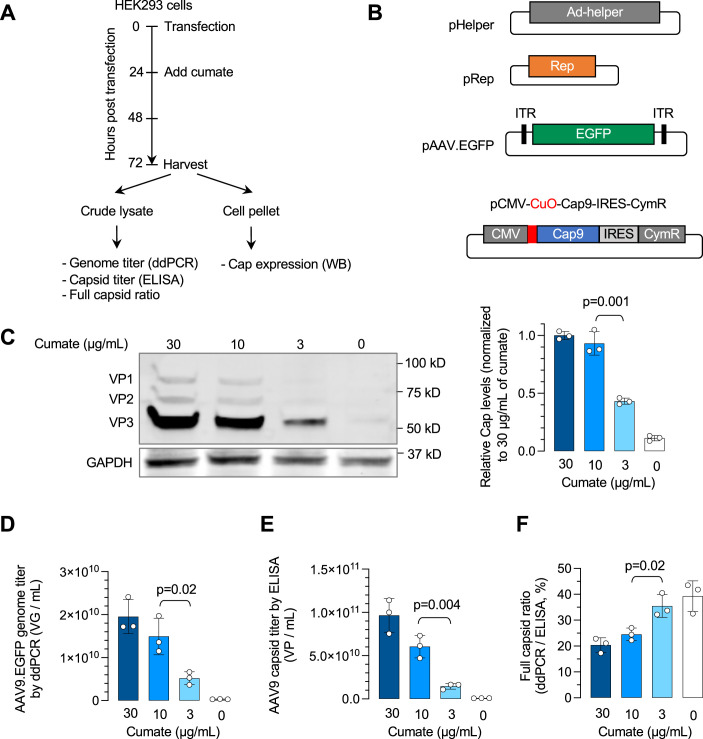
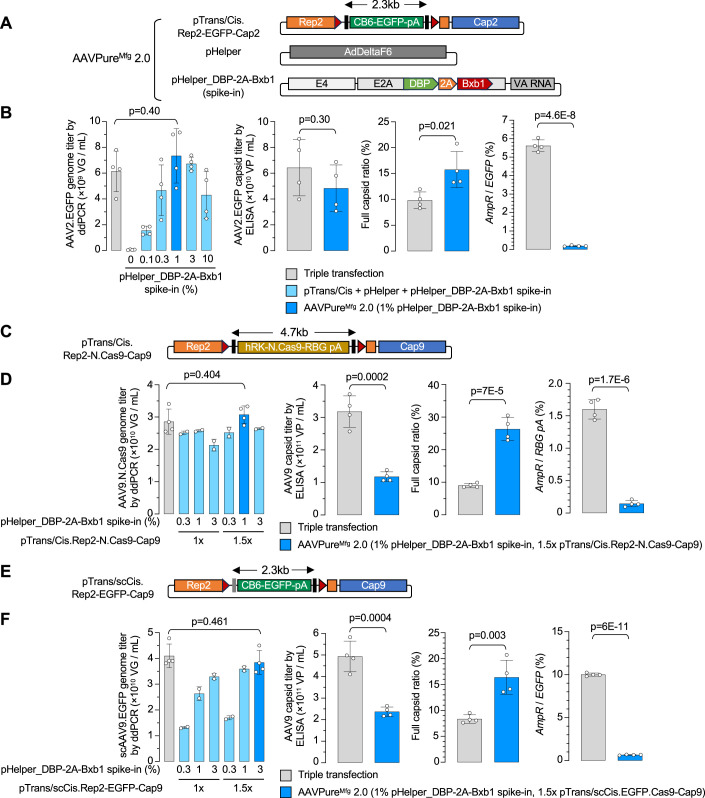
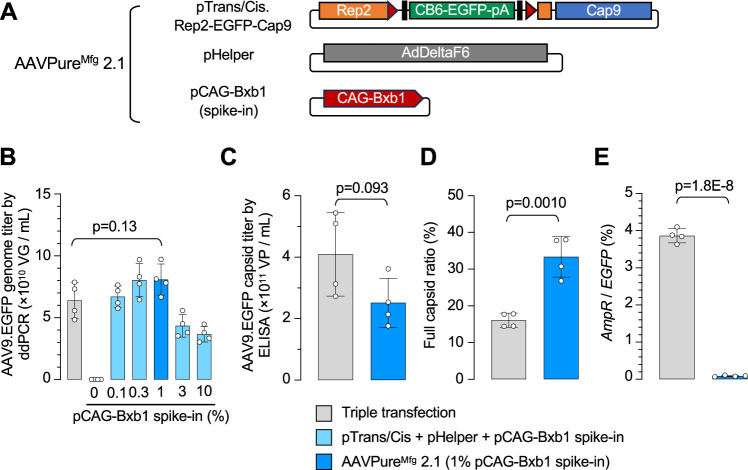
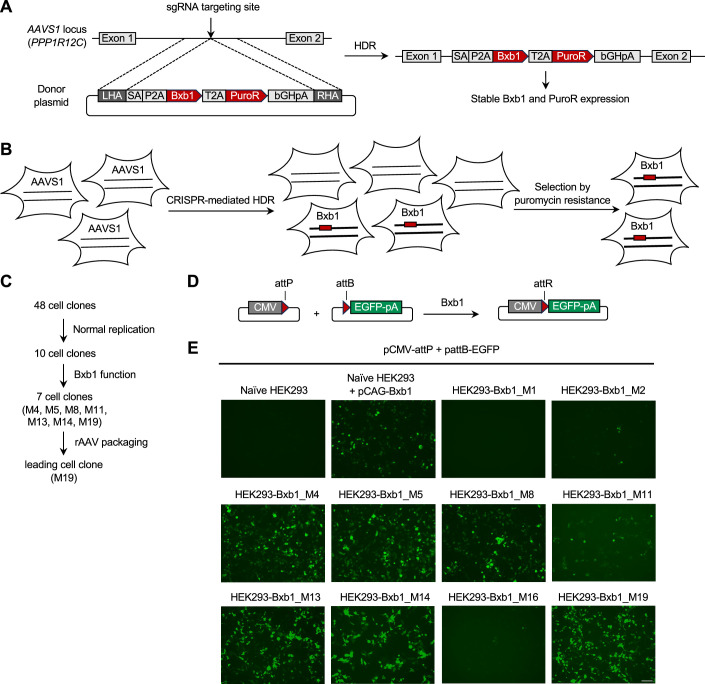
Triple transfection of HEK293 cells is the most widely used method for producing recombinant adeno-associated virus (rAAV), a leading gene delivery vector for human gene therapy. Despite its tremendous success, this approach generates several vector-related impurities that could potentially compromise the safety and potency of rAAV. In this study, we introduce a method for high-purity AAV vector production utilizing recombination-dependent minicircle formation and genetic coupling (AAVPureMfg). Compared with traditional triple transfection, AAVPureMfg substantially improves vector purity by reducing prokaryotic DNA contaminants by 10- to 50-fold and increasing the full capsid ratio up to threefold. Mechanistically, Bxb1-mediated excision of the transgene cassette generates a minicircle cis construct devoid of bacterial sequences and ensures synchronized colocalization of trans and cis constructs in productive cells. Furthermore, we developed iterations that enhance vector genome homogeneity and streamline the production of rAAV with various transgenes, serotypes, and ITR configurations. Overall, our findings demonstrate that AAVPureMfg overcomes the inherent limitations associated with triple transfection, offering a broadly applicable and easy-to-implement method for producing high-purity rAAV with reduced plasmid costs.

Keywords: AAV Manufacturing; AAVPureMfg; Empty Capsid; Plasmid Backbone; Vector Impurities.


Conflict of interest statement

Disclosure and competing interests statement. HL, GG, and DW are inventors of a patent application filed by the University of Massachusetts Chan Medical School concerning the work described in this study. EB was an employee of Pfizer Inc. when the study was conducted. GG is a scientific co-founder of Voyager Therapeutics, Adrenas Therapeutics and Aspa Therapeutics, and holds equity in these companies.

Figures

Figure 1
Figure 1. Schematics comparing triple transfection and AAVPureMfg.
(A) Schematic diagram illustrating how rAAV impurities, including plasmid backbone encapsidation and empty capsid, are generated in triple transfection. After co-transfection, when the three plasmids—pHelper, pTrans, and pCis—are co-localized within the same nuclei of HEK293 cells, Rep rescues the ITR-flanked transgene from the pCis plasmid, generating both the desired full-length rAAV genome and the undesired backbone-containing rAAV genome, both of which are encapsidated. Empty capsids are generated when only pHelper and pTrans coexist in the nuclei of HEK293 cells. (B) Schematic diagram illustrating how rAAV impurities, including plasmid backbone encapsidation and empty capsid, are mitigated in AAVPureMfg. After co-transfection, when pHelper_Bxb1 and pTrans/Cis are co-localized in the same nuclei of HEK293 cells, Bxb1 catalyzes the recombination of attP/attB-flanked transgene cassette, generating minicircle Cis construct (mcCis) that contains no prokaryotic backbone sequence, and the reconstituted pTrans with intact Rep and Cap function. Because mcCis does not contain plasmid backbone, cis construct replication only generates desired full-length rAAV genome, thus avoiding plasmid backbone encapsidation. pTrans/Cis itself cannot generate an empty capsid, because the inserted ITR-flanked transgene cassette prematurely terminates Cap gene expression. (C) The gene structure of pTrans plasmid and the expressed Rep transcripts. attR is chosen to be inserted between P40 and intron, located at the 3’ region of Rep gene as shown in red. (D) Simulated AAV2 Rep78 protein structure, with the region between P40 and the intron highlighted in red. The attR insertion sites are indicated by white arrows. (E) Packaging yield of AAV2.EGFP using unmodified pTrans (pRep2/Cap2) or modified variants (pRep2-attR/Cap2). Small-scale rAAV production was conducted in 12-well plate transfected with an equal amount of pRep2/Cap2 or pRep2-attR/Cap2 variants. Crude lysate was harvested 72 h post transfection followed by three successive freeze–thaw cycles. Cleared crude lysates after centrifugation were treated with DNase-I and proteinase K, followed by droplet digital PCR (ddPCR) to determine the genome titer. In (E), data are mean ± s.d. of biological replicates, n = 4 for each group. Statistical analysis was performed using one-way ANOVA followed by Dunnett’s multiple comparisons test against the pTrans group. The exact P value was indicated in the figure. Source data are available online for this figure.
Figure 2
Figure 2. AAVPureMfg improves AAV2 vector purity.
(A) Schematics of plasmid components in AAVPureMfg 1.0 and AAVPureMfg 1.1. (B) Experimental procedure of rAAV production and vector characterization. (C) Packaging yield of AAV2.EGFP produced by either triple transfection (gray), AAVPureMfg 1.0 (dark blue), or AAVPureMfg 1.1 (light blue). Small-scale rAAV production was conducted in a 12-well plate with plasmid usage as described in Table EV1. Crude lysate was harvested 72 h post transfection followed by three successive freeze–thaw cycles. Cleared crude lysates after centrifugation were treated with DNase-I and proteinase K, followed by droplet digital PCR (ddPCR) to determine the genome titer. (D) Representative fluorescence images of HEK293 cells infected by rAAV-containing crude lysates. Equal multiplicity of infection (MOI) of rAAV produced by triple transfection, AAVPureMfg 1.0, or AAVPureMfg 1.1 were used to infect HEK293 cells in the presence of adenovirus 5 (Ad5). Images were taken 2 days post infection. Scale bar, 100 µm. (E) AAV.EGFP capsid titers in cleared lysates determined by ELISA assay. (F) Full capsid ratio determined by ddPCR genome titer normalized to ELISA capsid titer. (G) Plasmid backbone DNA levels in rAAV products. Duplex ddPCR was performed with one probe targeting EGFP transgene and the other for AmpR in cleared lysates treated with DNase-I and proteinase K. In (C, EG), data are mean ± s.d. of biological replicates, n = 4 for each group. Statistical analysis was performed using one-way ANOVA followed by Dunnett’s multiple comparisons test against the triple transfection group. Exact P value was indicated in the figure. Source data are available online for this figure.
Figure 3
Figure 3. Asynchronous presence of pTrans and pCis plasmids causes empty capsid formation in triple transfection.
(A) Schematics of plasmid components in triple transfection (left panel), Trans-cis coupled triple transfection (middle panel) or AAVPureMfg 1.0 (right panel) used to produce AAV9.EGFP. (B) Comparison of AAV9.EGFP genome titer produced by different transfection methods. The rAAV production and titering procedures were the same as Fig. 2B. (C) AAV9.EGFP capsid titer in cleared lysate determined by ELISA assay. (D) Full capsid ratio determined by ddPCR genome titer normalized to ELISA capsid titer. (E) Western blotting of AAV9 VP proteins in HEK293 cells by different production methods and at indicated time points post transfection. (F) Dynamics of VP protein and Cap mRNA expression levels in HEK293 cells by different production methods and at indicated time points post transfection. The protein or mRNA abundance in triple transfection at 24 h post plasmid transfection is normalized to be 1. Statistical analysis was performed using two-way ANOVA followed by Dunnett’s multiple comparisons test against the triple transfection group. In (BD, F), data are mean ± s.d. of biological replicates, n = 4 for each group. Statistical analysis was performed using one-way ANOVA followed by Dunnett’s multiple comparisons test against the triple transfection group. Exact P value was indicated in the figure. Source data are available online for this figure.
Figure 4
Figure 4. Developing AAVPureMfg iterations that reduce plasmid manufacturing burden.
(A) Schematics of plasmid components in AAVPureMfg 2.0. (B) AAV9.EGFP genome titer produced by triple transfection or AAVPureMfg 2.0 with different amounts of pHelper_DBP-2A-Bxb1 spike-in. The rAAV production and titering procedures were the same as Fig. 2B. (CE) Comparison of AAV9 capsid titer (C), full capsid ratio (D), and plasmid backbone DNA levels (E) in cleared lysates between triple transfection and AAVPureMfg 2.0 with 1% pHelper_DBP-2A-Bxb1 spike-in. (F) Schematics of plasmid and cellular components in AAVPureMfg 3.0. (G) AAV9.EGFP genome titer produced by triple transfection or AAVPureMfg 3.0 with different monoclonal HEK293-Bxb1 cell lines. The rAAV production and titering procedures were the same as Fig. 2B. (HJ) Comparison of AAV9 capsid titer (H), full capsid ratio (I), and plasmid backbone DNA levels (J) in cleared lysates between triple transfection and AAVPureMfg 3.0 with the monoclonal HEK293-Bxb1 cell line M19. The detailed plasmid usage is described in Table EV1. In (BE, GJ), data are mean ± s.d. of biological replicates, n = 4 for each group except in Fig. 4G group M4, M5, M11, M13, M14, n = 2. Statistical analysis was performed using unpaired t test (CE, HJ) or one-way ANOVA followed by Dunnett’s multiple comparisons test against the triple transfection group (B, G). The exact P value was indicated in the figure. Source data are available online for this figure.
Figure 5
Figure 5. Application of AAVPureMfg 2.0 to suspension HEK293 cells.
(A) Experimental procedure of AAV9.EGFP production and vector characterization. (B) AAV9.EGFP genome titer produced by triple transfection or AAVPureMfg 2.0 with different amounts of pHelper_DBP-2A-Bxb1 spike-in. (C, D) Comparison of AAV9 capsid titer (C) and full capsid ratio (D) in cleared lysates between triple transfection and AAVPureMfg 2.0 with 1% pHelper_DBP-2A-Bxb1 spike-in. (E) Denaturing alkaline gel image showing the size of vector DNA purified from AAV9.EGFP in (A). Green arrowhead indicates the full-length vector genome size; red arrowhead indicates the double-genome size. (FI) Vector DNA impurities of plasmid backbone (F), adenovirus helper genes (G), Rep and Cap genes (H), and host HEK293 cell genomic DNA (I) between triple transfection and AAVPureMfg 2.0 with 1% pHelper_DBP-2A-Bxb1 spike-in. In (BD, FI), data are mean ± s.d. of biological replicates, n = 3 for each group. Statistical analysis was performed using unpaired t test (C, D, FI) or one-way ANOVA followed by Dunnett’s multiple comparisons test against the triple transfection group (B). The exact P value was indicated in the figure. Source data are available online for this figure.
Figure EV1
Figure EV1. Application of AAVPureMfg 1.0 in different AAV serotypes.
(A) Schematics of plasmid components in triple transfection (left panel) and AAVPureMfg 1.0 (right panel) used to produce AAV9.EGFP and AAV8.EGFP vectors. (B) Comparison of AAV9.EGFP produced by either triple transfection or AAVPureMfg 1.0. (C) Comparison of AAV8.EGFP produced by either triple transfection or AAVPureMfg 1.0. The procedure of rAAV production and vector characterization in (B, C) were the same as shown in Fig. 2. In (B, C), data are mean ± s.d. of biological replicates, n = 4 for each group. Statistical analysis was performed using unpaired t test. Exact P value was indicated in the figure.
Figure EV2
Figure EV2. Lower VP expression increased the full capsid ratio with a marked decrease in vector genome titer.
(A) Schematic showing the experimental procedure. (B) Construct illustrations of the plasmids used in quadruple transfection to produce AAV9.EGFP. (C) Representative western blotting images (left) and the quantification (right) of viral proteins (VP1, 2, 3) at indicated cumate concentrations. (DF) Comparison of rAAV genome titer, capsid titer, and full capsid ratio in cleared lysates with different cumate concentrations. In (CF), data are mean ± s.d. of biological replicates, n = 3 for each group. Statistical analysis was performed using unpaired t test. Exact P value was indicated in the figure.
Figure EV3
Figure EV3. Application of AAVPureMfg 2.0 in producing AAV vectors with different serotypes, transgenes, and ITR configurations.
(A, C, E) Schematics of plasmid components in AAVPureMfg 2.0 in producing ssAAV2.EGFP, ssAAV9.N.Cas9, and scAAV9.EGFP. In (E), the gray bar indicates mutant ITR that results in self-complementary (sc) vector genome. (B, D, F) Comparison of rAAV genome titer, capsid titer, full capsid ratio, and plasmid backbone DNA levels in cleared lysates between triple transfection and AAVPureMfg 2.0. In (B, D, F), data are mean ± s.d. of biological replicates, n = 4 for each group. Statistical analysis was performed using unpaired t test. Exact P value was indicated in the figure.
Figure EV4
Figure EV4. Developing AAVPureMfg 2.1 with pCAG-Bxb1 spike-in.
(A) Schematics of plasmid components in AAVPureMfg 2.1. (B) AAV9.EGFP genome titer produced by triple transfection or AAVPureMfg 2.1 with different spike-in amount of pCAG-Bxb1. The rAAV production and titering procedures were the same as Fig. 2B. (CE) Comparison of AAV9 capsid titer (C), full capsid ratio (D), and plasmid backbone DNA levels (E) in cleared lysates between triple transfection and AAVPureMfg 2.1 with 1% pCAG-Bxb1 spike-in. The detailed plasmid usage is described in Table EV1. In (BE), data are mean ± s.d. of biological replicates, n = 4 for each group. Statistical analysis was performed using unpaired t test (CE) or one-way ANOVA followed by Dunnett’s multiple comparisons test against the triple transfection group (B). Exact P value was indicated in the figure.
Figure EV5
Figure EV5. Generating a monoclonal HEK293-Bxb1 cell line.
(A) Schematic diagram illustrating Bxb1 knock-in into the AAVS1 site in HEK293 cells. (B) Schematic diagram showing the workflow to engineer and select HEK293-Bxb1 cells. (C) Procedure of HEK293-Bxb1 monoclonal cell line generation and screening. (D) Schematics of a reporter assay to determine Bxb1 recombination activity. (E) Representative fluorescence images showing naive HEK293 cells or HEK293-Bxb1 monoclonal cell lines that were transfected with the reporter plasmids, pCMV-attP and pattB-EGFP. Images were taken 1 day post transfection. Scale bar, 100 µm.

Similar articles

References

    1. Baek M, DiMaio F, Anishchenko I, Dauparas J, Ovchinnikov S, Lee GR, Wang J, Cong Q, Kinch LN, Schaeffer RD et al (2021) Accurate prediction of protein structures and interactions using a three-track neural network. Science 373:871–876 - PMC - PubMed
    1. Barnes LF, Draper BE, Chen YT, Powers TW, Jarrold MF (2021) Quantitative analysis of genome packaging in recombinant AAV vectors by charge detection mass spectrometry. Mol Ther Methods Clin Dev 23:87–97 - PMC - PubMed
    1. Brimble MA, Winston SM, Davidoff AM (2023) Stowaways in the cargo: contaminating nucleic acids in rAAV preparations for gene therapy. Mol Ther 31:2826–2838 - PMC - PubMed
    1. Cabrera A, Edelstein HI, Glykofrydis F, Love KS, Palacios S, Tycko J, Zhang M, Lensch S, Shields CE, Livingston M et al (2022) The sound of silence: transgene silencing in mammalian cell engineering. Cell Syst 13:950–973 - PMC - PubMed
    1. Chadeuf G, Ciron C, Moullier P, Salvetti A (2005) Evidence for encapsidation of prokaryotic sequences during recombinant adeno-associated virus production and their in vivo persistence after vector delivery. Mol Ther 12:744–753 - PubMed

LinkOut - more resources