. 2025 May 16;5(1):178.
doi: 10.1038/s43856-025-00902-x.

Compartmentalised mucosal and blood immunity to SARS-CoV-2 is associated with high seroprevalence before the Delta wave in Africa

Affiliations

Compartmentalised mucosal and blood immunity to SARS-CoV-2 is associated with high seroprevalence before the Delta wave in Africa

Ya Jankey Jagne et al. Commun Med (Lond). .

Abstract

Background: The reported number of SARS-CoV-2 cases and deaths are lower in Africa compared to many high-income countries. However, in African cohorts, detailed characterisation of SARS-CoV-2 mucosal and T cell immunity are limited. We assessed the SARS-CoV-2-specific immune landscape in The Gambia during the presence of the pre-Delta variant in July 2021.

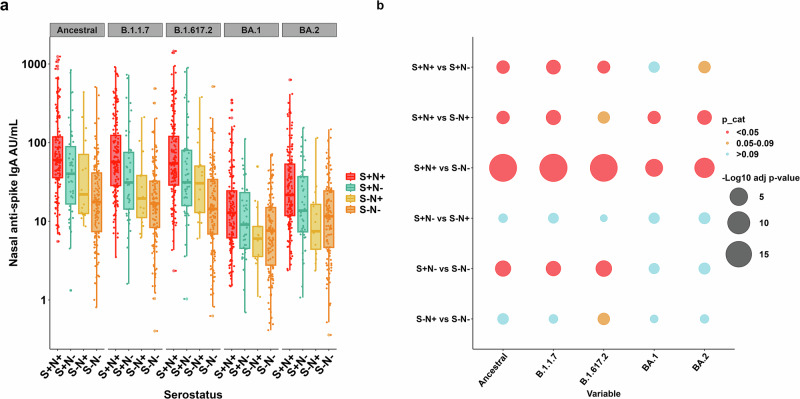
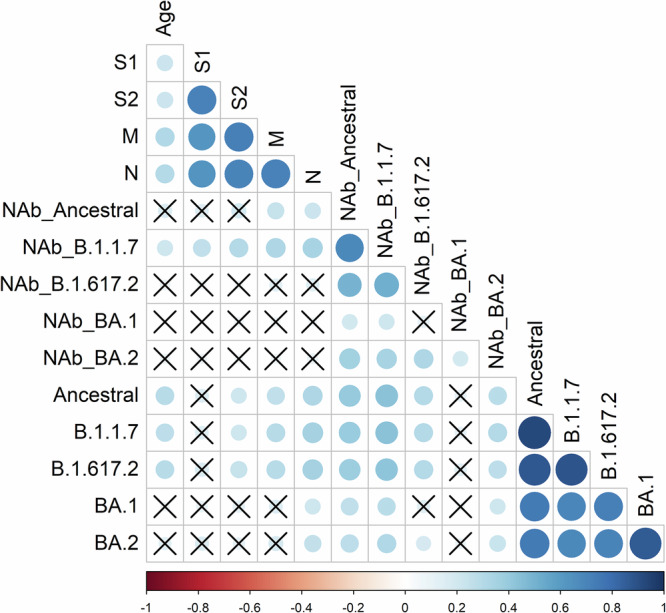
Methods: A cross-sectional assessment of SARS-CoV-2 immunity in 349 unvaccinated individuals from 52 Gambian households was performed between March-June 2021. SARS-CoV-2 spike (S) and nucleocapsid (N) specific binding antibodies were measured by ELISA, variant-specific serum neutralizing-antibodies (NAb) by viral pseudotype assays and nasal fluid IgA by mesoscale discovery assay. SARS-CoV-2 T-cell responses were evaluated using ELISpot assay.

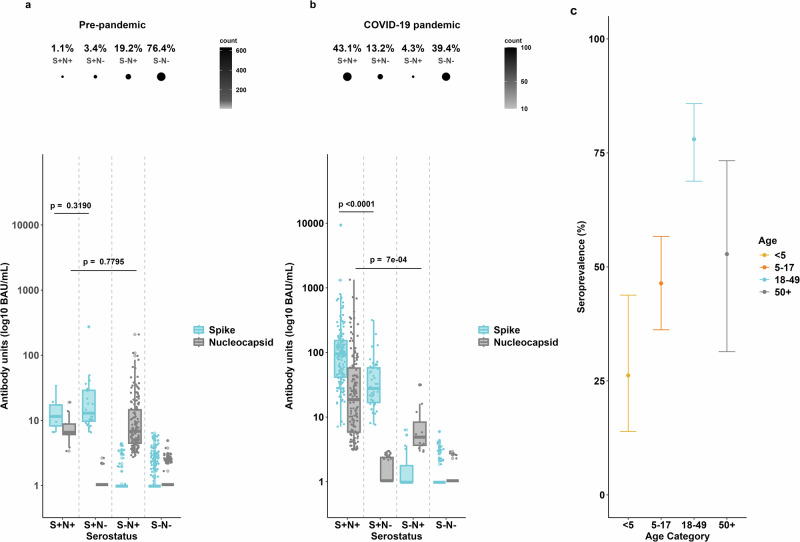
Results: We show that adjusted anti-Spike antibody seroprevalence is 56.7% (95% confidence interval (CI) 49.0-64.0), with lower rates in children <5 years (26.2%, 13.9-43.8) and 5-17 years (46.4%, 36.2-56.7) compared to adults 18-49 years (78.4%, 68.8-85.8). Among spike-seropositive individuals, NAb titres are highest against Alpha variant (median IC50 110), with 27% showing pre-existing Delta variant titres >1:50. T-cell responses are higher in spike-seropositive individuals, although 34% of spike-seronegative individuals show responses to at least one antigen pool. We observe strong correlations within SARS-CoV-2 T-cell, mucosal IgA, and serum NAb responses.

Conclusions: High SARS-CoV-2 seroprevalence in The-Gambia induce mucosal and blood immunity, reducing Delta and Omicron impact. Children are relatively protected from infection. T-cell responses in seronegative individuals may indicate either pre-pandemic cross-reactivity or individuals with a T-cell dominated response to SARS-CoV-2 infection with absent or poor humoral responses.

Plain language summary

The COVID-19 pandemic caused many illnesses and deaths worldwide. In Africa, the reported number of COVID-19 cases remained low and while under-reporting may have played a role, no increase in deaths was seen in The Gambia during the first year of the COVID-19 pandemic. There is limited data on how the immune system of Africans respond to COVID-19 infections. Our aim was to assess COVID-19 immune responses using blood and nasal swabs collected from the participants. Measurement of immune cell function and antibody levels, showed that COVID-19 infection activated different specialized cells of the immune system, including certain white blood cells (T cells) and antibodies. Antibodies are proteins made by the cells in our body, found in the blood and mucous membranes and protect against infection. We also found that COVID-19 infection rates were higher in adults compared to children and that the immune responses from an infection with earlier COVID-19 variants may have conferred protection against infection with later variants. These findings contribute to our understanding of how Africans of different ages responded to COVID-19 infection.


Conflict of interest statement

Competing interests: The authors declare no competing interests.

Figures

Fig. 1
Fig. 1. Antibody responses to SARS-CoV-2 spike (S) and nucleocapsid (N).
Participants are grouped by reactivity to both antigens (serostatus = S+N+, S+N−, S−N+ and S−N−). a The proportion of participants within each serostatus group (upper panel) and quantitative spike and binding nucleocapsid antibody (lower panel) in pre-pandemic sera (n = 825). b The proportion of participants within each serostatus group (upper panel) and quantitative spike and binding nucleocapsid antibody (lower panel) following the first two SARS-CoV-2 waves (n = 349). Boxplots depict means with 95% confidence intervals. BAU/mL = binding antibody units/mL. Wilcoxon rank sum test was used to compare responses between S antibody responses in S+N+ and S+N− groups, as well as N antibody responses in S+N+ and S−N+ groups. c Seroprevalence estimates for each age category based on spike reactivity, adjusted for household clustering. The vertical error bars indicate the 95% confidence intervals (CIs) of the estimates for the different age categories: <5 years, 5–17 years, 18–49 years and 50+ years.
Fig. 2
Fig. 2. Neutralising antibody (NAb) responses to SARS-CoV-2 variants.
a Reciprocal IC50 (log10) serum titres to Ancestral, Alpha (B.1.1.7), Delta (B.1.617.2), Omicron BA.1 and BA.2 variants are displayed for participants in each serogroup, defined by binding antibody reactivity to spike (S) and nucleocapsid (N). Boxplots denote median IC50, and interquartile range (IQR) and the dots represent individual responses. The dotted line denotes the 1:100 IC50 threshold above which neutralising activity was considered to be present for all variants (Ancestral, B.1.1.7, B.1.617.2, BA.1, B.A.2. b Negative log10 adjusted p values comparing NAb responses to each variant across serogroups (larger circles = smaller adjusted p values) using Kruskal–Wallis test. In cases in which Kruskal–Wallis testing indicated significant differences, post hoc testing using Dunn’s test was performed. Correction for multiple comparisons was performed using the Bonferroni–Holm method. Adjusted p values below 0.05 (red), 0.05−0.09 (orange) and >0.09 (blue) are highlighted. The lowest serum dilution screened for neutralisation was 1:50, with samples not neutralising at this concentration allocated random values between 1 and 49 for the purpose of statistical analysis and data visualisation, n = 342.
Fig. 3
Fig. 3. Mucosal IgA responses to SARS-CoV-2 variants.
a Binding antibody units (AU/mL) to Ancestral, Alpha (B.1.1.7), Delta (B.1.617.2), Omicron BA.1 and BA.2 variants is displayed for participants in each serogroup, defined by binding antibody reactivity in serum to spike (S) and nucleocapsid (N). Boxplots denote median AU/mL and interquartile range (IQR), and the dots represent individual responses. b Negative log10 adjusted p values comparing IgA responses to each variant across serogroups (larger circle = smaller adjusted p values) using Kruskal–Wallis test. In cases in which Kruskal–Wallis testing indicated significant differences, post hoc testing using Dunn’s test was performed. Correction for multiple comparisons was performed using the Bonferroni-Holm method. Adjusted p values below 0.05 (red), 0.05−0.09 (orange) and >0.09 (blue) are highlighted, n = 347.
Fig. 4
Fig. 4. T-cell responses to SARS-CoV-2 antigens.
Interferon-gamma ELISpot responses expressed as spot-forming units per million peripheral blood mononuclear cells (PBMC; SFU/mL). a T-cell responses to spike S1 and S2 subunits, membrane (M) and nucleocapsid (N) peptide pools are displayed for participants in each serogroup, defined by binding antibody reactivity in serum to spike (S) and nucleocapsid (N). Boxplots denote median SFU/ml PBMC responses and IQR, and the dots represent individual responses. b Negative log10 adjusted p values comparing T-cell responses to each antigen across serogroups (larger circles = smaller adjusted p values) using Kruskal–Wallis. In cases in which Kruskal–Wallis testing indicated significant differences, post hoc testing using Dunn’s test was performed. Correction for multiple comparisons was performed using the Bonferroni–Holm method. Adjusted p values below 0.05 (red), 0.06–0.09 (orange) and ≥0.1 (blue) are highlighted. c Proportion of participants within each serogroup with T-cell responses to 0, 1, 2, 3 or 4 peptide pools tested, n = 266.
Fig. 5
Fig. 5. Correlation between SARS-CoV-2 T-cell, serum neutralising antibody, and spike-specific mucosal IgA responses.
Correlation matrix depicting Spearman correlation coefficients (R) between each immune response, with adjusted p values using the Holm test. The size of the circle and the colour intensity relate to the absolute value of the Spearman rank correlation coefficient. The legend shows the correlation coefficients and the corresponding colours. Positive correlations are coloured blue. Correlations with p values > 0.05 are marked with an X. Compared are serum neutralising antibody (NAb) responses and mucosal IgA responses to Ancestral, Alpha (B.1.1.7), Delta (B.1.617.2), Omicron BA.1 and BA.2 variants, along with interferon-gamma T-cell responses to peptide pools representing spike S1 and S2 subunits, membrane (M) and nucleocapsid (N) proteins.

Similar articles

Cited by

  • SARS-CoV-2 antibody immunity across three continents: the West Africa, West Indies, West London Consortium.
    Greenwood D, Hague O, Kwesi-Maliepaard EM, Redman SA; Crick Serology Consortium; HERITAGE study team; Legacy Investigators; WINDFall Study Team; WWW Consortium Team; Scott F, Anzinger JJ, Awandare G, Bauer DL, Bediako Y, Carr EJ, Carrington CV, Kucharski A, Quashie P, Wall EC, Wu MY. Greenwood D, et al. medRxiv [Preprint]. 2025 Jun 14:2025.06.13.25329588. doi: 10.1101/2025.06.13.25329588. medRxiv. 2025. PMID: 40585115 Free PMC article. Preprint.

References

    1. World Health Organization. Data at WHO. https://data.who.int/dashboards/covid19/cases (2024).
    1. World Health Organization. COVID-19 response in the Gambia—documenting WHO’s support in the COVID19 response. 1–44 (2024).
    1. Kanteh, A. et al. Genomic epidemiology of SARS-CoV-2 infections in the Gambia: an analysis of routinely collected surveillance data between March, 2020, and January, 2022. Lancet Glob. Health11, e414–e424 (2023). - PMC - PubMed
    1. Abatan, B. et al. Intense and mild first epidemic wave of Coronavirus disease, the Gambia. Emerg. Infect. Dis.27, 2064–2072 (2021). - PMC - PubMed
    1. Mohammed, N. I. et al. Quantifying excess mortality during the COVID-19 pandemic in 2020 in the Gambia: a time-series analysis of three health and demographic surveillance systems. Int. J. Infect. Dis.128, 61–68 (2023). - PMC - PubMed

LinkOut - more resources