. 2025 May 16;23(1):549.
doi: 10.1186/s12967-025-06552-w.

Deciphering microbial and metabolic influences in gastrointestinal diseases-unveiling their roles in gastric cancer, colorectal cancer, and inflammatory bowel disease

Affiliations

Deciphering microbial and metabolic influences in gastrointestinal diseases-unveiling their roles in gastric cancer, colorectal cancer, and inflammatory bowel disease

Daryll Philip et al. J Transl Med. .

Abstract

Introduction: Gastrointestinal disorders (GIDs) affect nearly 40% of the global population, with gut microbiome-metabolome interactions playing a crucial role in gastric cancer (GC), colorectal cancer (CRC), and inflammatory bowel disease (IBD). This study aims to investigate how microbial and metabolic alterations contribute to disease development and assess whether biomarkers identified in one disease could potentially be used to predict another, highlighting cross-disease applicability.

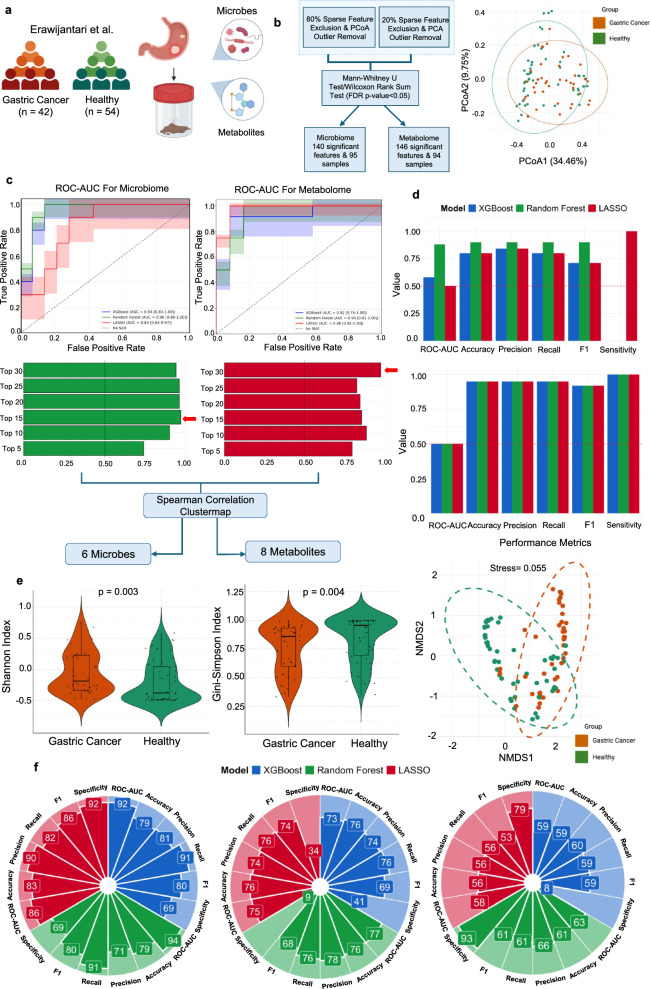
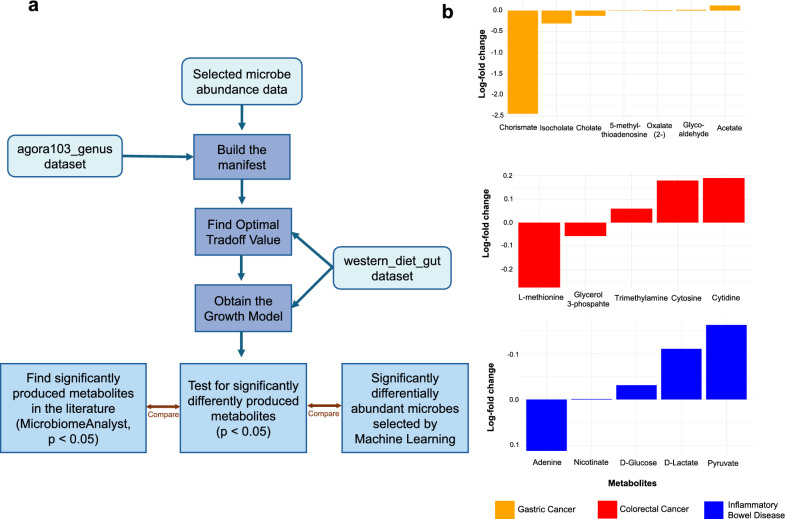
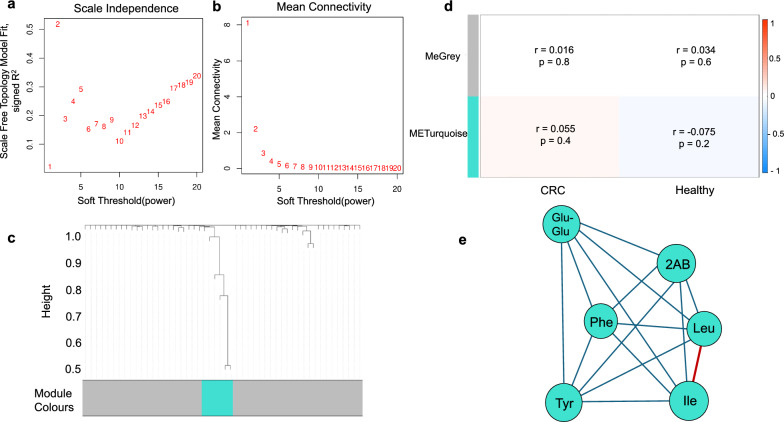
Methods: Microbiome and metabolome datasets from Erawijantari et al. (GC: n = 42, Healthy: n = 54), Franzosa et al. (IBD: n = 164, Healthy: n = 56), and Yachida et al. (CRC: n = 150, Healthy: n = 127) were subjected to three machine learning algorithms, eXtreme gradient boosting (XGBoost), Random Forest, and Least Absolute Shrinkage and Selection Operator (LASSO). Feature selection identified microbial and metabolite biomarkers unique to each disease and shared across conditions. A microbial community (MICOM) model simulated gut microbial growth and metabolite fluxes, revealing metabolic differences between healthy and diseased states. Finally, network analysis uncovered metabolite clusters associated with disease traits.

Results: Combined machine learning models demonstrated strong predictive performance, with Random Forest achieving the highest Area Under the Curve(AUC) scores for GC(0.94[0.83-1.00]), CRC (0.75[0.62-0.86]), and IBD (0.93[0.86-0.98]). These models were then employed for cross-disease analysis, revealing that models trained on GC data successfully predicted IBD biomarkers, while CRC models predicted GC biomarkers with optimal performance scores.

Conclusion: These findings emphasize the potential of microbial and metabolic profiling in cross-disease characterization particularly for GIDs, advancing biomarker discovery for improved diagnostics and targeted therapies.

Keywords: Biomarkers; Colorectal cancer; Gastric cancer; Inflammatory bowel disease; Machine learning; Metabolome; Microbiome.


Conflict of interest statement

Declarations. Ethics approval and consent to participate: Not applicable. Consent for publication: Not applicable. Competing interests: The authors declare that this research was conducted without any competing personal or financial relationships that could be considered potential influences on the work presented in this paper.

Figures

Fig. 1
Fig. 1
Microbiome-metabolome machine learning for cross-disease predictions in GC. a Fecal microbiome and metabolome data from GC patients (orange) and healthy individuals(green) obtained from Erawijantari et al. b Data preprocessing workflow highlighting the key microbes, metabolites, and samples selected for machine learning, alongside a principal coordinates analysis (PCoA) plot used for outlier removal. c The receiver operator curve – area under the curve (ROC-AUC) for microbiome and metabolome data across models: XGBoost (blue), Random Forest (green), and LASSO (red). Bar graph showing the best-performing model (microbiome-Random Forest, metabolome-LASSO) based on the highest AUC-ROC score, highlighting the optimal number of features. The selection includes 6 microbial and 8 metabolite features identified through Spearman cluster map analysis. d Validation performance metrics of the optimal features depicted by bar plots for microbiome and metabolome analysis were evaluated using the microbiome dataset from Jaeyun Sung et al. and the metabolome dataset from the UKBB. e Alpha diversity for microbes was visualised with violin plots comparing healthy and GC patients using the Shannon and Gini-Simpson indices. FDR-corrected p-values (p < 0.05) showed significant differences within both groups. Beta diversity was evaluated using non-metric multidimensional scaling (NMDS) based on Jaccard distances, with the stress value confirming statistical significance between healthy and diseased patients. f Circular bar plots illustrate the performance scores of the three models trained using combined microbiome and metabolome data from GC patients. Key biomarkers from the GC dataset were identified in the IBD and CRC datasets. GC-trained models were applied to predict IBD and CRC outcomes respectively
Fig. 2
Fig. 2
Microbial community model (MICOM) results overview. a A summary of the process used to obtain the results. b The significantly differentially produced metabolites (p < 0.05) for each disease and their log-fold change abundance, where a positive change represents an increase in cases vs controls (Diseased vs Healthy)
Fig. 3
Fig. 3
Weighted Gene Co-expression Network Analysis (WGCNA) for CRC. a This plot shows the scale-free topology model fit (R2) versus soft-thresholding power (β). The highest R2 is 0.1847 at β = 9, indicating a weak but improving fit to the scale-free topology as β increases. b This plot displays how the mean connectivity decreases with increasing β. At β = 9, the mean connectivity is low, reflecting network sparsification while retaining some structural connections. c Shows a hierarchical clustering dendrogram of metabolites, where branches represent clusters of similar elements based on their co-expression. The height (Y-axis) indicates the dissimilarity between clusters, with smaller heights representing higher similarity. The horizontal bar below the dendrogram represents module assignments. The turquoise color indicates elements grouped into a co-expression module, while grey represents elements that were not assigned to any module due to low correlation or lack of clustering. d This heatmap represents the correlation between module eigengenes and traits (Case and Control, where Case = CRC and Control = Healthy). Each cell contains the correlation coefficient and its p-value with color intensity indicating the correlation’s strength and direction (red for positive, blue for negative). The grey module, containing unassigned elements, shows a very weak positive correlation with CRC (r = 0.016, p = 0.8) and Healthy (r = 0.034, p = 0.6), both of which are statistically insignificant. The turquoise module, containing co-expressed elements, shows a weak positive correlation with CRC (r = 0.055, p = 0.4) and a weak negative correlation with Healthy (r = − 0.075, p = 0.2), neither of which are significant. This suggests no strong relationship between module expression and CRC. e The turquoise nodes in the network visualisation represent metabolites within the turquoise module, characterized by strong co-expression connections. The edges connecting turquoise nodes reflect the strength of co-expression: red edges represent higher strongly co-expression interactions, and blue edges indicate lower co-expression interactions. Metabolites like"Leu,"and"Ile"are central to this cluster, potentially functioning as hub metabolites coordinating module activity

Similar articles

References

    1. Ogobuiro I, Gonzales J, Shumway KR, et al. Physiology, gastrointestinal. Treasure Island: StatPearls; 2023. - PubMed
    1. Morgado-Diaz JA. Gastrointestinal cancers 2022. Brisbane: Exon Publications; 2022. 10.36255/EXON-PUBLICATIONS-GASTROINTESTINAL-CANCERS. - PubMed
    1. Ranjbar R, Ghasemian M, Maniati M, et al. Gastrointestinal disorder biomarkers. Clin Chim Acta. 2022;530:13–26. 10.1016/J.CCA.2022.02.013. - PubMed
    1. Wroblewski LE, Peek RM, Wilson KT. Helicobacterpylori and gastric cancer: factors that modulate disease risk. Clin Microbiol Rev. 2010;23:713. 10.1128/CMR.00011-10. - PMC - PubMed
    1. Bray F, Laversanne M, Sung H, et al. Global cancer statistics 2022: GLOBOCAN estimates of incidence and mortality worldwide for 36 cancers in 185 countries. CA Cancer J Clin. 2024;74:229–63. 10.3322/CAAC.21834. - PubMed

MeSH terms

LinkOut - more resources