. 2025 May 16;23(1):227.
doi: 10.1186/s12964-025-02222-y.

Dynamic changes in macrophage populations and resulting alterations in Prostaglandin E2 sensitivity in mice with diet-induced MASH

Affiliations

Dynamic changes in macrophage populations and resulting alterations in Prostaglandin E2 sensitivity in mice with diet-induced MASH

Madita Vahrenbrink et al. Cell Commun Signal. .

Abstract

Background: The transition from metabolic dysfunction-associated steatotic liver disease (MASLD) to steatohepatitis (MASH) is characterized by a chronic low-grade inflammation, involving activation of resident macrophages (Kupffer cells; KC) and recruitment of infiltrating macrophages. Macrophages produce cytokines and, after induction of Cyclooxygenase 2 (COX-2), the key enzyme of prostanoid synthesis, prostaglandin E2 (PGE2). PGE2 modulates cytokine production in an autocrine and paracrine manner, therefore playing a pivotal role in regulating inflammatory processes. Changes in the hepatic macrophage pool during MASLD progression to MASH could influence PGE2- and cytokine-mediated signaling processes. The aim of this study was to characterize these changes in mice with diet-induced MASH and further elucidate the role of COX-2-dependently formed PGE2 on the inflammatory response in different macrophage populations of mice with a macrophage-specific COX-2-deletion.

Methods: Male, 6-7-week-old wildtype mice were fed either a Standard or high-fat, high-cholesterol MASH-inducing diet for 4, 12 and 20 weeks. Liver macrophages were isolated and analyzed by flow cytometry. For in vitro experiments primary KC, peritoneal macrophages (PM) and Bone-marrow-derived macrophages (BMDM) were isolated from macrophage-specific COX-2-deficient and wildtype mice and treated with lipopolysaccharide (LPS) and/or PGE2.

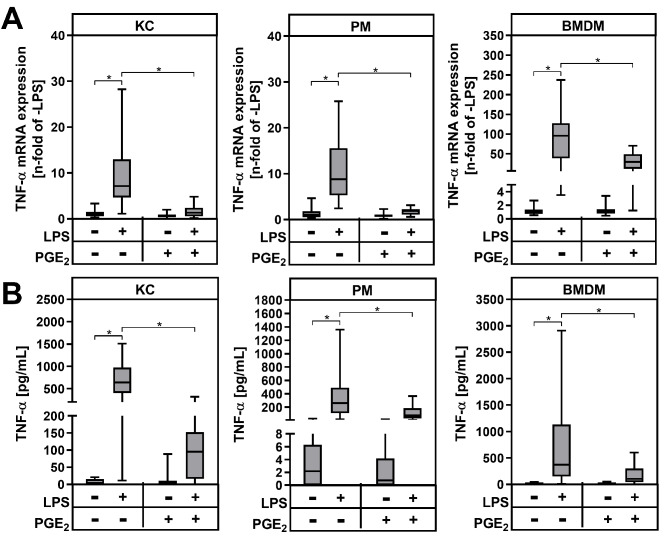
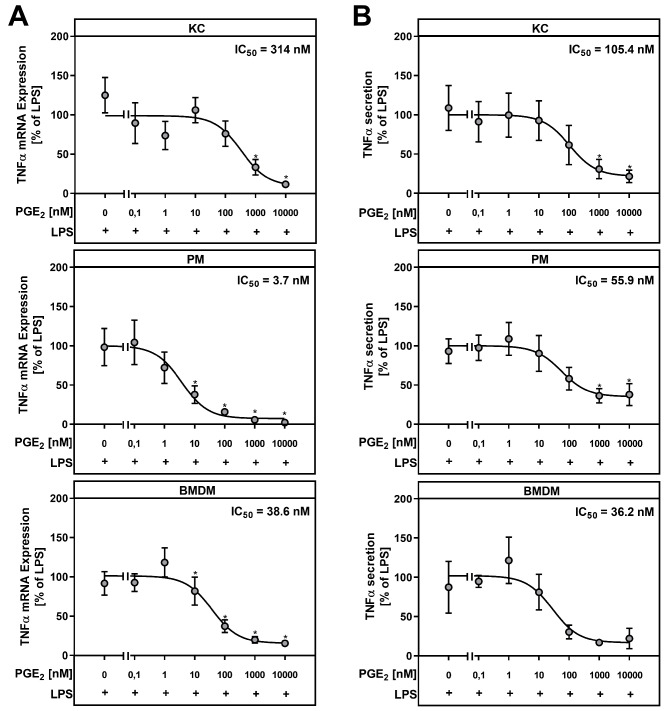
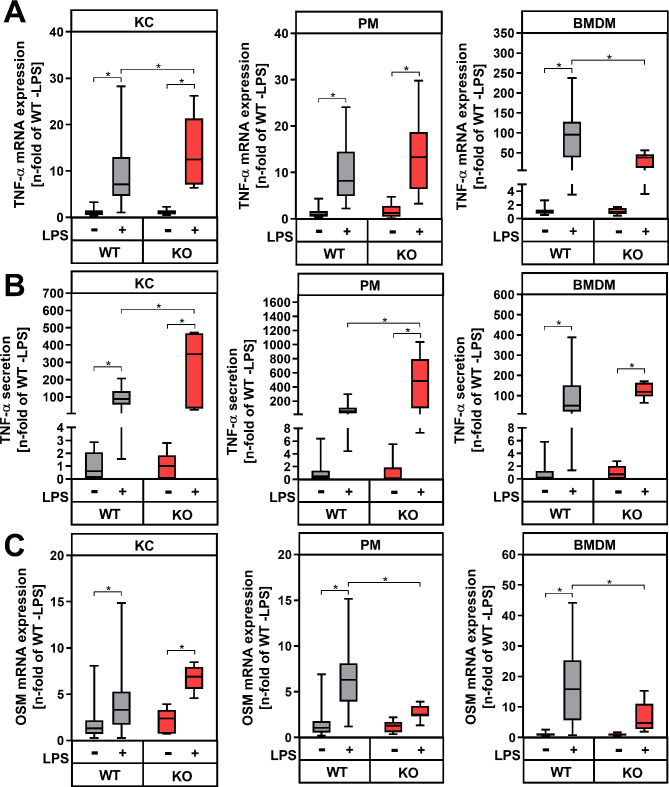
Results: During MASH-development, the proportion of KC (Clec4F+Tim4+) decreased, while the proportion of monocyte-derived macrophages (Clec4F-Tim4-) and monocyte-derived cells exhibiting a phenotype similar to KC (Clec4F+Tim4-) significantly increased over time. In vitro experiments showed that exogenous PGE2 completely abrogated the LPS-induced mRNA expression and secretion of tumor necrosis factor-alpha (TNF-α) in primary KC, PM and BMDM from wildtype mice. PM and BMDM, as in vitro models for infiltrating macrophages, were more sensitive to PGE2 compared to KC. Deletion of COX-2 in all macrophage populations led to an impaired PGE2-dependent feedback inhibition of TNF-α production. LPSinduced TNF-α mRNA expression was higher compared to the respective wildtype macrophage population.

Conclusion: The current study, using a murine MASH model, indicates that PGE2 may have a protective, anti-inflammatory effect, especially by inhibiting the expression of pro-inflammatory cytokines such as TNFα in infiltrating monocyte-derived macrophages. An inhibition of endogenous PGE2 synthesis in macrophages by pharmacological inhibition of COX-2 could potentially increase inflammation and promote the progression of MASH.

Keywords: Cyclooxygenase; Infiltrating macrophages; Inflammation; Kupffer cells; MASH; Prostaglandin E2; TNF-α.


Conflict of interest statement

Declarations. Ethics approval and consent to participate: Not applicable. Consent for publication: Not applicable. Competing interests: The authors declare no competing interests.

Figures

Fig. 1
Fig. 1
Dynamic changes in hepatic macrophage populations of mice with diet-induced MASH. (A) Representative density plots of liver macrophage populations at indicated feeding periods. After gating on CD45+, live and singlet cells, macrophages were identified as F4/80+ cells (top panel) and further analysed for expression of Tim4 and Clec4F (bottom panel). (B) Quantification of F4/80+ cells per milligram liver tissue. (C) Proportion of Clec4F+Tim4+ Kupffer cells (KC), Clec4FTim4 monocyte-derived macrophages (MoMF), and Clec4F+Tim4 monocyte-derived Kupffer cells (MoKC) as fractions of F4/80+ cells. Values are median (line), upper- and lower quartile (box) and extremes (whiskers) of n = 4–8 (STD), n = 8–11 (4 W MASH-D), n = 8–13 (12 W MASH-D), n = 9–11 (20 W MASH-D) mice. Statistics: One-way-ANOVA with Tukey´s post hoc test for multiple comparison. *p < 0.05
Fig. 2
Fig. 2
Modulation of TNF-α mRNA and protein expression by exogenous PGE2. Primary Kupffer cells (KC), peritoneal macrophages (PM) and bone marrow-derived macrophages (BMDM) were stimulated for 24 h with LPS and/or PGE2. (A) Relative mRNA expression of TNF-α was determined by RT-qPCR with Hprt as the reference gene. (B) TNF-α protein levels were quantified by ELISA in cell culture supernatants. Values are median (line), upper- and lower quartile (box) and extremes (whiskers) of (A) n = 33 (KC), n = 26 (PM) or n = 29 (BMDM) or (B) n = 27 (KC), n = 26 (PM) or n = 26 (BMDM) independent experiments. Statistics: Two-way-ANOVA with Tukey´s post hoc test for multiple comparison. *p < 0.05
Fig. 3
Fig. 3
PGE2 inhibits TNF-α mRNA and protein expression in a dose-dependent manner. Primary Kupffer cells (KC), peritoneal macrophages (PM) and bone marrow-derived macrophages (BMDM) were stimulated for 24 h with LPS and indicated concentrations of PGE2. (A) Relative mRNA expression of TNF-α was determined by RT-qPCR with Hprt as the reference gene. (B) TNF-α protein levels were determined by ELISA in cell culture supernatants. Values are mean ± SEM of n = 5 independent experiments. Statistics: Student´s t-test for unpaired samples. * vs. w/o PGE2 with p < 0.05
Fig. 4
Fig. 4
Modulation of OSM mRNA expression by exogenous PGE2. Primary Kupffer cells (KC), peritoneal macrophages (PM) and bone marrow-derived macrophages (BMDM) were stimulated for 24 h with LPS and/or PGE2. Relative mRNA expression of OSM was determined by RT-qPCR with Hprt as the reference gene. Values are median (line), upper- and lower quartile (box) and extremes (whiskers) of n = 28 (KC), n = 26 (PM) or n = 30 (BMDM) independent experiments. Statistics: Two-way-ANOVA with Tukey´s post hoc test for multiple comparison. *p < 0.05
Fig. 5
Fig. 5
Modulation of LPS-mediated expression of cyclooxygenase 2 (COX-2) and secretion of prostaglandin E2 (PGE2) in macrophages from wildtype controls (WT) and COX-2-deficient mice (KO). Primary Kupffer cells (KC), peritoneal macrophages (PM) and bone marrow-derived macrophages (BMDM) were stimulated for 24 h with LPS. (A) Relative mRNA expression of COX-2 (gene name Ptges2) was determined by RT-qPCR with Hprt as the reference gene. (B) Protein lysates were analyzed by immunoblotting for COX-2 protein expression, with β-Actin serving as the loading control. All original blots are provided in Supplementary figure S5-7. (C) PGE2 level were determined by ELISA in cell culture supernatants. Values are median (line), upper- and lower quartile (box) and extremes (whiskers) of n = 26–32 (WT) or n = 5–10 (KO) independent experiments. Statistics: Two-way-ANOVA with Tukey´s post hoc test for multiple comparison. *p < 0.05. n.d.: not detectable
Fig. 6
Fig. 6
Modulation of cytokine mRNA and protein expression in macrophages from wildtype controls (WT) and COX-2-deficient mice (KO). Primary Kupffer cells (KC), peritoneal macrophages (PM) and bone marrow-derived macrophages (BMDM) were stimulated for 24 h with LPS. Relative mRNA expression of TNF-α (A) and OSM (C) were determined by RT-qPCR with Hprt as the reference gene. (B) TNF-α protein levels were determined by ELISA in cell culture supernatants. Values are median (line), upper- and lower quartile (box) and extremes (whiskers) of n = 26–32 (WT) or n = 5–10 (KO) independent experiments. Statistics: Two-way-ANOVA with Tukey´s post hoc test for multiple comparison. *p < 0.05

References

    1. Rinella ME, Lazarus JV, Ratziu V, Francque SM, Sanyal AJ, Kanwal F, et al. A multisociety Delphi consensus statement on new fatty liver disease nomenclature. Hepatology. 2023;78(6):1966–86. 10.1097/HEP.0000000000000520. - PMC - PubMed
    1. Younossi ZM, Koenig AB, Abdelatif D, Fazel Y, Henry L, Wymer M. Global epidemiology of nonalcoholic fatty liver disease-Meta-analytic assessment of prevalence, incidence, and outcomes. Hepatology. 2016;64(1):73–84. 10.1002/hep.28431. - PubMed
    1. Grander C, Grabherr F, Tilg H. Non-alcoholic fatty liver disease: pathophysiological concepts and treatment options. Cardiovasc Res. 2023;119(9):1787–98. 10.1093/cvr/cvad095. - PMC - PubMed
    1. Dowman JK, Tomlinson JW, Newsome PN. Pathogenesis of non-alcoholic fatty liver disease. Int J Med. 2010;103(2):71–83. 10.1093/qjmed/hcp158. - PMC - PubMed
    1. Chalasani N, Younossi Z, Lavine JE, Charlton M, Cusi K, Rinella M, et al. The diagnosis and management of nonalcoholic fatty liver disease: practice guidance from the American association for the study of liver diseases. Hepatology. 2018;67(1):328–57. 10.1002/hep.29367. - PubMed

LinkOut - more resources