. 2025 May 16;23(1):554.
doi: 10.1186/s12967-025-06346-0.

Single-cell transcriptomics reveals metabolic remodeling and functional specialization in the immune microenvironment of bone tumors

Affiliations

Single-cell transcriptomics reveals metabolic remodeling and functional specialization in the immune microenvironment of bone tumors

Jun Chen et al. J Transl Med. .

Abstract

Objective: To investigate the metabolic remodeling and functional specialization of immune cells within the tumor microenvironment (TME) of bone tumors, including Ewing's sarcoma, osteosarcoma, and giant cell tumor of bone, through high-resolution single-cell RNA sequencing (scRNA-seq) analysis.

Methods: Immune cells were isolated from 13 bone tumor samples and profiled via scRNA-seq to delineate cellular compositions, metabolic adaptations, and intercellular communication networks. Differential gene expression analysis, metabolic pathway enrichment, and pseudotime trajectory inference were employed to characterize functional states and differentiation processes of immune cell subsets.

Results: We identified 12 major immune cell clusters with distinct functional and metabolic characteristics. Naïve T cells exhibited amino acid metabolism-dependent activation potential, whereas NK cells relied on lipid metabolism and the TCA cycle for cytotoxic activity. Macrophage subsets demonstrated functional divergence: C06 macrophages adopted lipid metabolism to facilitate immunosuppression and tissue repair, while C04 macrophages displayed pro-inflammatory characteristics associated with complement activation. Intercellular signaling analysis revealed FN1 as a central regulator of immune coordination, governing cell adhesion, migration, and homeostasis within the TME.

Conclusion: This study provides novel insights into the metabolic and functional plasticity of immune cells in bone tumor TMEs, underscoring the critical role of metabolic remodeling in immune regulation. Our findings highlight potential therapeutic targets for modulating immune cell function and offering new avenues to improve treatment outcomes for patients with bone tumors.

Keywords: Bone tumors; Immune microenvironment; Metabolic remodeling; ScRNA-seq.


Conflict of interest statement

Declarations. Ethics approval and consent to participate: Not applicable. Consent for publication: The authors have consent for publication. Competing interests: No potential conflict of interest was reported by the authors.

Figures
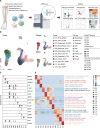
Fig. 1
Fig. 1
Workflow and single-cell RNA sequencing analysis reveal the immune microenvironment of bone tumors. A Schematic representation of the single-cell RNA sequencing workflow. B UMAP plot illustrating the clustering of immune cells from 13 tumor samples. The figure uses color coding to represent immune cell clusters, cell types, and sample origin. C Violin plots showing the expression of marker genes used to identify cell types and characteristic genes for each immune cell cluster. D Heatmap displaying the top 10 differentially expressed genes (DEGs) for each immune cell cluster
Fig. 2
Fig. 2
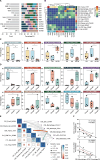
Immune cell composition and functional correlation in bone tumor samples. A Bar plot showing the distribution of immune cell clusters across individual tumor samples. B Cluster dendrogram displaying the similarity between tumor samples. Based on immune cell composition, samples are categorized into three groups. C Boxplots grouped by tumor type (OS, ES, and GCTB) showing the distribution of immune cell clusters with significant differences. D Boxplots grouped by the immune classification identified in B. E Matrix plot showing Mantel’s test results for pairwise correlation between immune cell clusters based on gene expression profiles. The correlation strength (r value) and statistical significance (P-value) are represented by color intensity. F Scatter plots showing the correlation of C06_Macrophage_APOE with C09_Tnaive_TCF7 and C11_NK_KLRD1. The X-axis represents the percentage of C06_Macrophage_APOE, while the Y-axis shows the percentage of the respective clusters
Fig. 3
Fig. 3
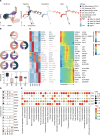
Trajectory analysis and functional features of T and NK cells in bone tumors. A UMAP plot and pseudotime trajectory of T and NK cells. The trajectory is colored by pseudotime (from low to high) and state transitions (State 1 to State 5). B The upper panel shows the developmental tree of T and NK cells, with each node represented as a pie chart displaying the composition of cell types from different states along the trajectory. The lower panel consists of boxplots depicting the pseudotime distribution of each cluster. C Violin plots showing the expression of functional genes in T and NK cells. D Violin plots displaying naïve, cytotoxic, exhausted, and proliferation scores for each cluster. E Heatmap presenting the top 10 DEGs for each T and NK cell cluster. F Volcano plot identifying upregulated genes in C09_Tnaive_TCF7 and C11_NK_KLRD1. Genes with significant fold changes and adjusted P-values are highlighted. G Clustering heatmap showing the enriched metabolic pathways for each cluster
Fig. 4
Fig. 4
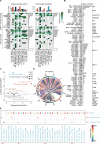
Pseudotime trajectory and metabolic specialization of myeloid cells. A UMAP and trajectory plot illustrating the pseudotime of myeloid cells. B Developmental tree and pseudotime boxplots of myeloid cells. C Heatmaps showing the DEGs for myeloid cell clusters. The left panel highlights the DEGs for each cluster, while the right panel visualizes the dynamic expression of these DEGs along the pseudotime trajectory. D Violin plots illustrating the expression levels of functional genes across myeloid cell clusters. E Dot plot depicting the enriched metabolic pathways for each myeloid cell cluster
Fig. 5
Fig. 5
Intercellular communication and signaling networks in bone tumor microenvironment. A Heatmap of outgoing and incoming signaling patterns for each immune cell cluster. B Bar plots summarizing the overall communication strength of major pathways across immune cell clusters. C Scatter plot showing the relative contribution of different immune cell clusters to shaping the immune microenvironment (outgoing signaling strength) and receiving environmental signals (incoming signaling strength). D Circle plots displaying the detailed intercellular communication network for FN1 signaling pathways. E Dot plot illustrating the specific interaction mechanisms within the FN1 signaling pathway

Similar articles

References

    1. Nik-Ahd M, Agrawal AK, Zimel M. Diagnosis and management of pediatric primary bone tumors in the emergency department. Pediatr Emerg Med Pract. 2021;18(7):1–20. - PubMed
    1. Folkert IW, et al. Primary bone tumors: challenges and opportunities for CAR-T therapies. J Bone Miner Res. 2019;34(10):1780–8. - PubMed
    1. Ogilvie CM, Cheng EY. What’s new in primary bone tumors. J Bone Joint Surg Am. 2016;98(24):2109–13. - PubMed
    1. Bădilă AE, et al. Recent advances in the treatment of bone metastases and primary bone tumors: an up-to-date review. Cancers (Basel). 2021;13(16):4229. - PMC - PubMed
    1. Panagi M, et al. Immunotherapy in soft tissue and bone sarcoma: unraveling the barriers to effectiveness. Theranostics. 2022;12(14):6106–29. - PMC - PubMed

LinkOut - more resources