. 2025 May 16;14(1):74.
doi: 10.1186/s40164-025-00661-4.

Unravelling neutropenic enterocolitis: insights from gut microbiota, and intestinal barrier analyses

Affiliations

Unravelling neutropenic enterocolitis: insights from gut microbiota, and intestinal barrier analyses

Natacha Kapandji et al. Exp Hematol Oncol. .

Abstract

Background: Neutropenic enterocolitis (NE) is a severe digestive complication of chemotherapy, primarily affecting patients with acute myeloid leukemia (AML). We hypothesized that NE is linked to intestinal barrier dysfunction and gut dysbiosis.

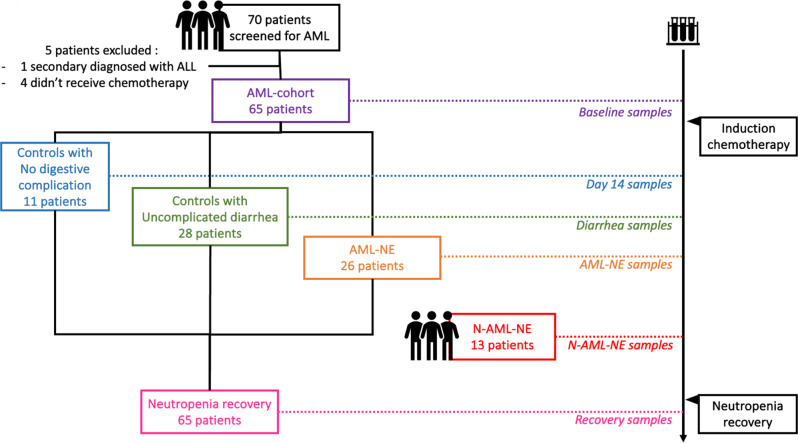
Methods: Sixty-five AML patients undergoing induction chemotherapy were included in this prospective monocentric cohort. Among them, 26 patients (40%) were diagnosed with NE. Stool samples were subjected to bacterial load quantification (all bacteria quantitative PCR), 16s rRNA metagenomic analysis, and short-chain-fatty-acids quantification. Additionally, fecal calprotectin and human 𝛃-defensin 2 along with plasmatic inflammatory cytokines, and citrulline levels were measured. Human transcriptomic analysis was conducted on samples obtained from anatomical specimens of colectomies of NE patients.

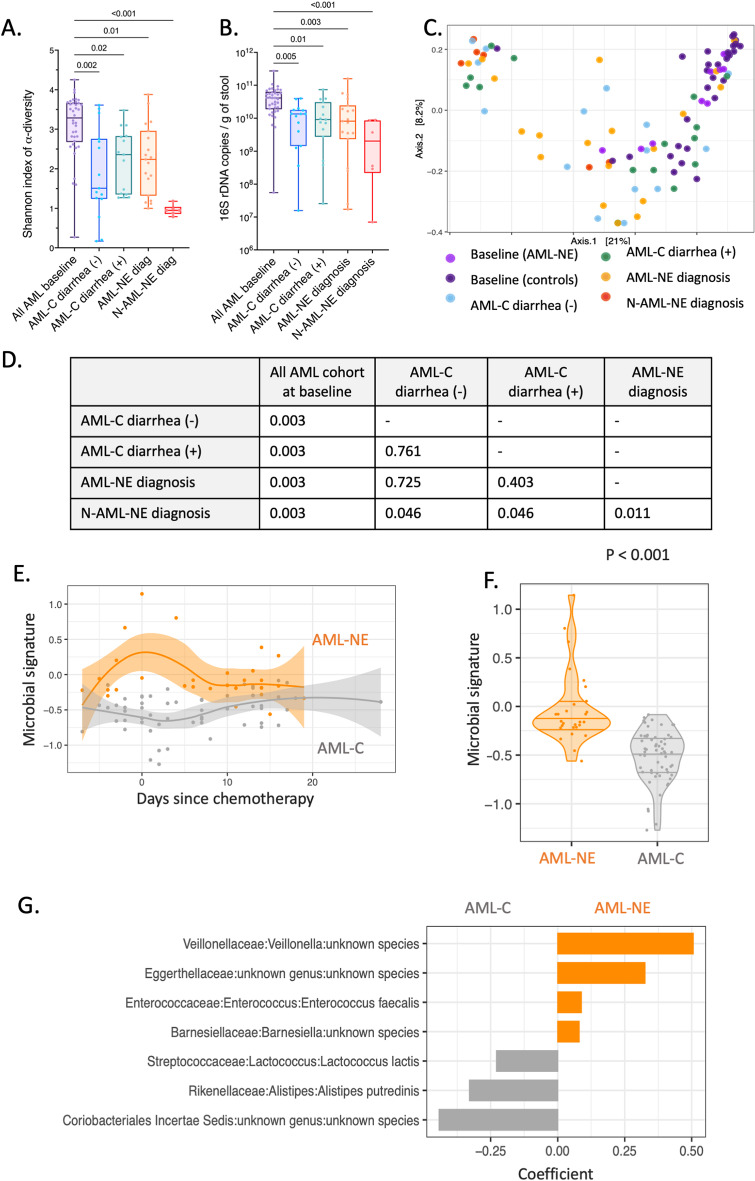
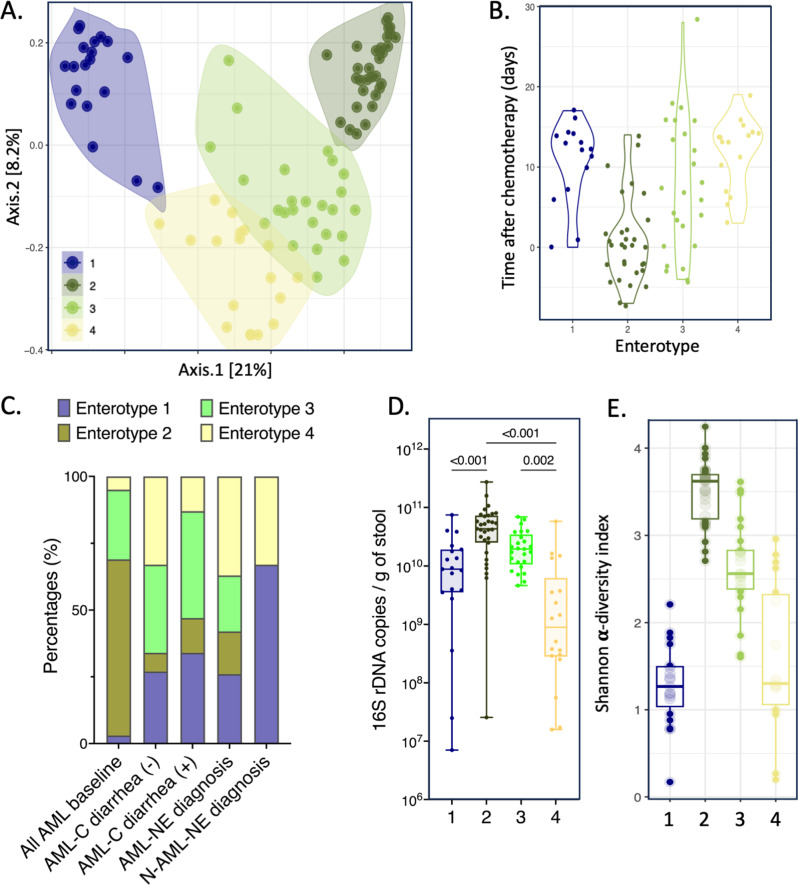
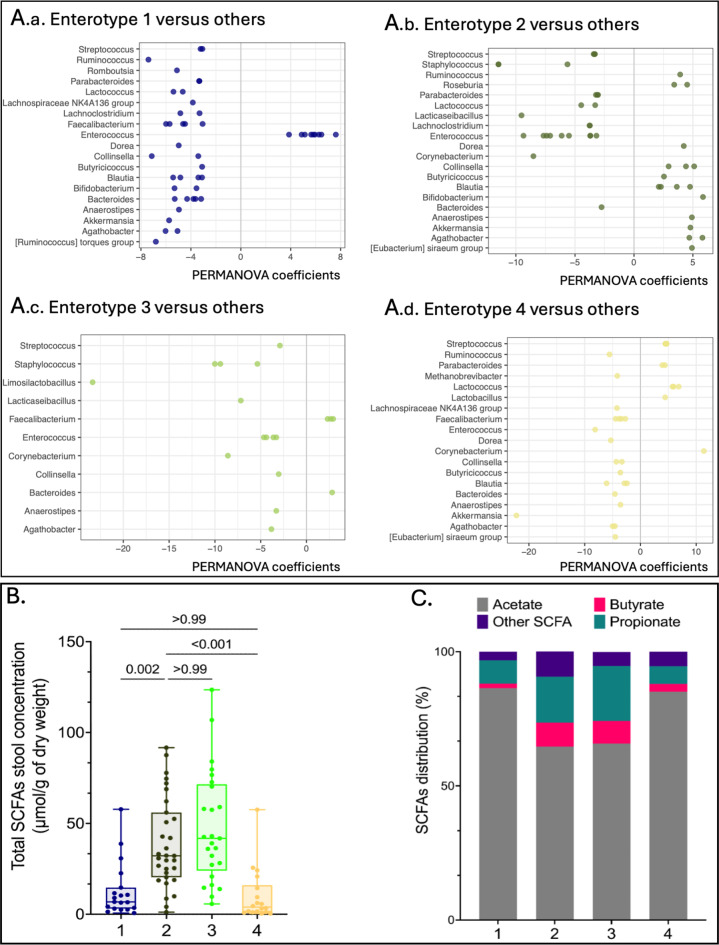
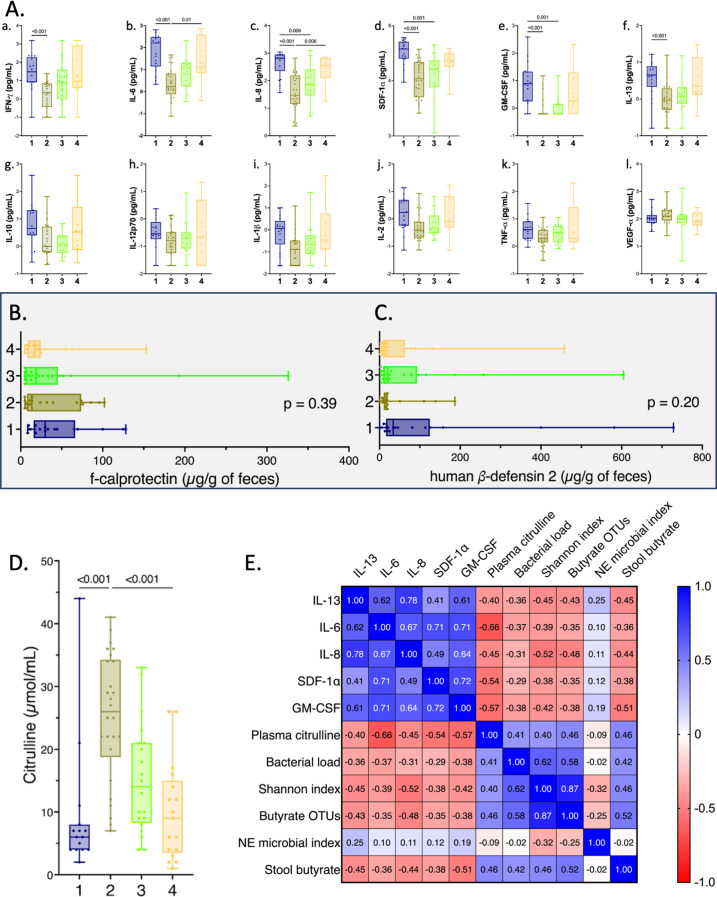
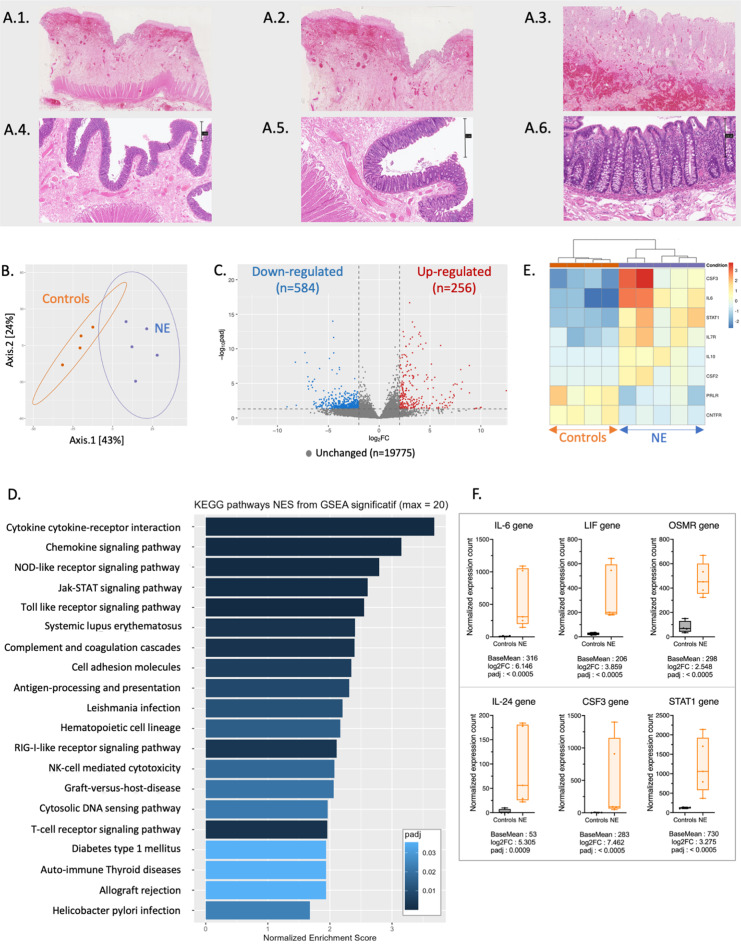
Results: Gut microbiota underwent significant alterations after chemotherapy, transitioning from a diverse and balanced enterotype to enterotypes exhibiting a reduced α-diversity, an increased abundance of Enterococcus faecalis, and a decreased abundance of butyrate-producing genera, which correlated with a decreased fecal concentration of butyrate. Simultaneously, post-chemotherapy, plasma citrulline concentrations decreased indicating enterocyte damages. Finally, human transcriptomic analysis found a significant upregulation of the JAK-STAT signaling KEGG pathway in the colons of NE patients encompassing cytokines (IL-6, OSM-OSMR) that play a pivotal role in sustaining local inflammation within the digestive tract.

Conclusions: This work reaffirms the significant influence of chemotherapy on the gut microbiota and the integrity of the enterocyte barrier. Severe NE is marked by the development of a local inflammatory response that may be induced by the reduction in butyrate levels.

Trial registration: The study was registered on Clinicaltrials.gov (identifier: NCT04438278).

Keywords: Butyrate; Citrulline; Gut microbiota; Interleukin-6 family; Neutropenic enterocolitis.


Conflict of interest statement

Declarations. Ethics approval: The study was approved by the ethics committee “Comité de Protection des Personnes Ile de France VII” (N° ID-RCB: 2019-A02172-55). Patient’s informed consent was waived according to the French law. Consent for publication: Patient’s consent was waived according to the French law for histopathological observations. Competing interests: The authors declare no competing interests.

Figures

Fig. 1
Fig. 1
Flow-chart and samples collection. The underlying hematological diseases of the 13 N-AML-NE patients was aggressive lymphomas for 11, multiple myeloma for 1, and acute lymphoblastic Philadelphia-chromosome leukemia for 1
Fig. 2
Fig. 2
Targeted 16s rRNA metagenomic analysis of gut microbiome (α and β-diversity). Box plots presenting levels of (A) Shannon α -diversity index and (B) bacterial load (expressed as number of bacteria / g of feces) between the 4 different clinical timepoints: before chemotherapy in all AML patients (n = 38), at day 14 for AML-controls diarrhea (-) (n = 15), at diagnosis of diarrhea for AML-controls diarrhea (+) (n = 15), at diagnosis of NE for AML-NE (n = 19), and N-AML-NE (n = 6). p-values were calculated using a non-parametric two-sided Kruskal-Wallis test with Dunn’s multiple comparisons tests. A p-value < 0.01 was considered statistically significant. (C) Dot plot illustrating the coordinates of the Bray-Curtis matrix distances of each sample on Principal Coordinates Analysis (PCoA). Dots were colored based on their associated clinical timepoint. (D) Permutated Multivariate Analysis of Variance (PERMANOVA) analysis of Bray-Curtis distances. A p-value < 0.001 was considered statistically significant. (E) Violin plot and (F) regression curve with 95%CI comparing the dynamic modifications in the AML-NE group (n = 26) to the rest of the AML controls (n = 39). (G) Bar plot describing taxa contributing to the dynamic microbial signature of NE
Fig. 3
Fig. 3
Unsupervised analysis of 16s rRNA data identified 4 distinct enterotypes. (A) Dot plot depicting coordinates of each sample on the principal co-ordinate analysis (PCoA) performed using the Bray-Curtis matrix distance. Samples were clustered using hierarchical k-means, with each cluster representing an enterotype. (B) Comparison of the time elapsed from the initiation of chemotherapy in the AML-cohort between the enterotypes. p-value was computed with bilateral Wilcoxon test. (C) Bar plot showing the distribution of the 4 enterotypes among the different clinical timepoints (All AML baseline, AML-C diarrhea (-) at Day 14, AML-C diarrhea (+), AML-NE, and N-AML-NE at diagnosis). Box plots depicting the comparisons of (D) bacterial load (bacteria / g of feces), and (E) Shannon α -diversity index between the 4 enterotypes [enterotype 1 (n = 19), enterotype 2 (n = 31), enterotype 3 (n = 25) and enterotype 4 (n = 18)]. Two tailed p-values were performed using Kruskal-Wallis test with Dunn’s multiple comparisons tests. p-value < 0.01 was considered statistically significant
Fig. 4
Fig. 4
Enterotypes 1 and 4 demonstrated a reduced production of fecal short-chain fatty acids. (A) Bar plots presenting for each enterotype (A.a to A.d) the differential abundance of the significant genera (adjusted p-value < 0.01). (B) Box plots comparing the total SCFAs fecal concentrations expressed in µmol / g of dry feces weight among the 4 enterotypes [enterotype 1 (n = 19), enterotype 2 (n = 31), enterotype 3 (n = 25) and enterotype 4 (n = 18)]. (C) Bar plot showing the distribution in percentages of the majority SCFAs namely acetate, butyrate, and propionate for each enterotype. “Other SCFAs” gathered valerate, isovalerate, isobutyrate, caproate, and isocaproate
Fig. 5
Fig. 5
Enterotype 1 and 4 exhibited decreased enteral mass and significant systemic inflammation. (A) Box plots comparing the plasmatic concentrations of the following cytokines and chemokines among the 4 enterotypes: IFN- 𝛾 (a), IL-6 (b), IL-8 (c), SDF-1 (d), GM-CSF (4), IL-13 (f), IL-10 (g), IL-12p70 (h), IL-1 β (i), IL-2 (j), TNF-α (k), VEGF (l). Cytokine concentrations were expressed on a base-10 logarithmic scale (pg/mL). (B) Box plots comparing f-calprotectin among the 4 enterotypes [enterotype 1 (n = 18), enterotype 2 (n = 19), enterotype 3 (n = 20) and enterotype 4 (n = 16)]. (C) Box plots comparing the fecal concentration of human β-defensin 2 among the 4 enterotypes [enterotype 1 (n = 19), enterotype 2 (n = 19), enterotype 3 (n = 20) and enterotype 4 (n = 16)]. (D) Box plots presenting levels of plasma citrulline among the 4 enterotypes [enterotype 1 (n = 15), enterotype 2 (n = 26), enterotype 3 (n = 20) and enterotype 4 (n = 17)]. p-values were calculated using a non-parametric two-sided Kruskal-Wallis test with Dunn’s multiple comparisons tests. (E) Heatmap presenting the matrix of Spearman’s correlation coefficients between IL-6, IL-8, SDF-1, GM-CSF, IL-13, plasma citrulline, bacterial load, Shannon α-diversity index, the number of observed OTUs of butyrate producers, the NE’s bacterial signature coefficient, and the fecal concentrations of butyrate. p-value < 0.01 was considered statistically significant
Fig. 6
Fig. 6
Human transcriptomic and histopathological analysis. (A) Histopathological observations of NE specimen (A1 to A3) and control (A4 to A6) using Hematoxylin and eosin stain with X1, X2, and X10 scanning magnifications. Observations A1 to A3 reveal ulcerated mucosa with fibrino-leukocytic exudate, edema, and vascular congestion. Scales are reported on the right of the control images (B) Dot plot illustrating the principal transcriptomic coordinates of the 5 NE samples and 4 controls. (C) Volcano plot illustrating the down-regulated and up-regulated genes in NE colic samples compared to the controls. Genes were considered unchanged when padj was > 0.05 and L2FC < ⎟2⎜. (D) Bar plot of the normalized enrichment scores of the 20 most significative up-regulated KEGG-pathways in the NE’s human transcriptomic analysis compared to the controls. (E) Heatmap of the Jak-STAT signaling KEGG pathway (hsa04630). (F) Bow plots comparing between NE samples and controls the normalized expression count for the most significant genes of the Jak-STAT pathway: STAT1, IL-24, CSF3, and genes from the IL-6 family (IL-6, LIF, OSMR). Specific Mann-Whitney comparison of padj < 0.001 was considered statistically significant

References

    1. Badgwell BD, Cormier JN, Wray CJ, Borthakur G, Qiao W, Rolston KV, et al. Challenges in surgical management of abdominal pain in the neutropenic Cancer patient. Ann Surg. 2008;248(1):104–9. - PubMed
    1. Duceau B, Picard M, Pirracchio R, Wanquet A, Pène F, Merceron S, et al. Neutropenic Enterocolitis in critically ill patients: spectrum of the disease and risk of invasive fungal disease. Crit Care Med. 2019;47(5):668–76. - PubMed
    1. Saillard C, Zafrani L, Darmon M, Bisbal M, Chow-Chine L, Sannini A et al. The prognostic impact of abdominal surgery in cancer patients with neutropenic enterocolitis: a systematic review and meta-analysis, on behalf the Groupe de Recherche en Réanimation Respiratoire du patient d’Onco-Hématologie (GRRR-OH). Annals of Intensive Care [Internet]. 2018 Dec [cited 2019 Apr 5];8(1). Available from: https://annalsofintensivecare.springeropen.com/articles/10.1186/s13613-018-0394-6 - PMC - PubMed
    1. Nesher L, Rolston KVI. Neutropenic Enterocolitis, a growing concern in the era of widespread use of aggressive chemotherapy. Clin Infect Dis. 2013;56(5):711–7. - PubMed
    1. Kapandji N, Azoulay E, Zafrani L. Recent advances in neutropenic Enterocolitis: insights into the role of gut microbiota. Blood Rev. 2022;54:100944. - PubMed

Associated data

LinkOut - more resources