. 2025 May 27;44(5):115728.
doi: 10.1016/j.celrep.2025.115728. Epub 2025 May 15.

An integrated proteomics approach identifies phosphorylation sites on viral and host proteins that regulate West Nile virus infection

Affiliations

An integrated proteomics approach identifies phosphorylation sites on viral and host proteins that regulate West Nile virus infection

Zachary Walter et al. Cell Rep. .

Abstract

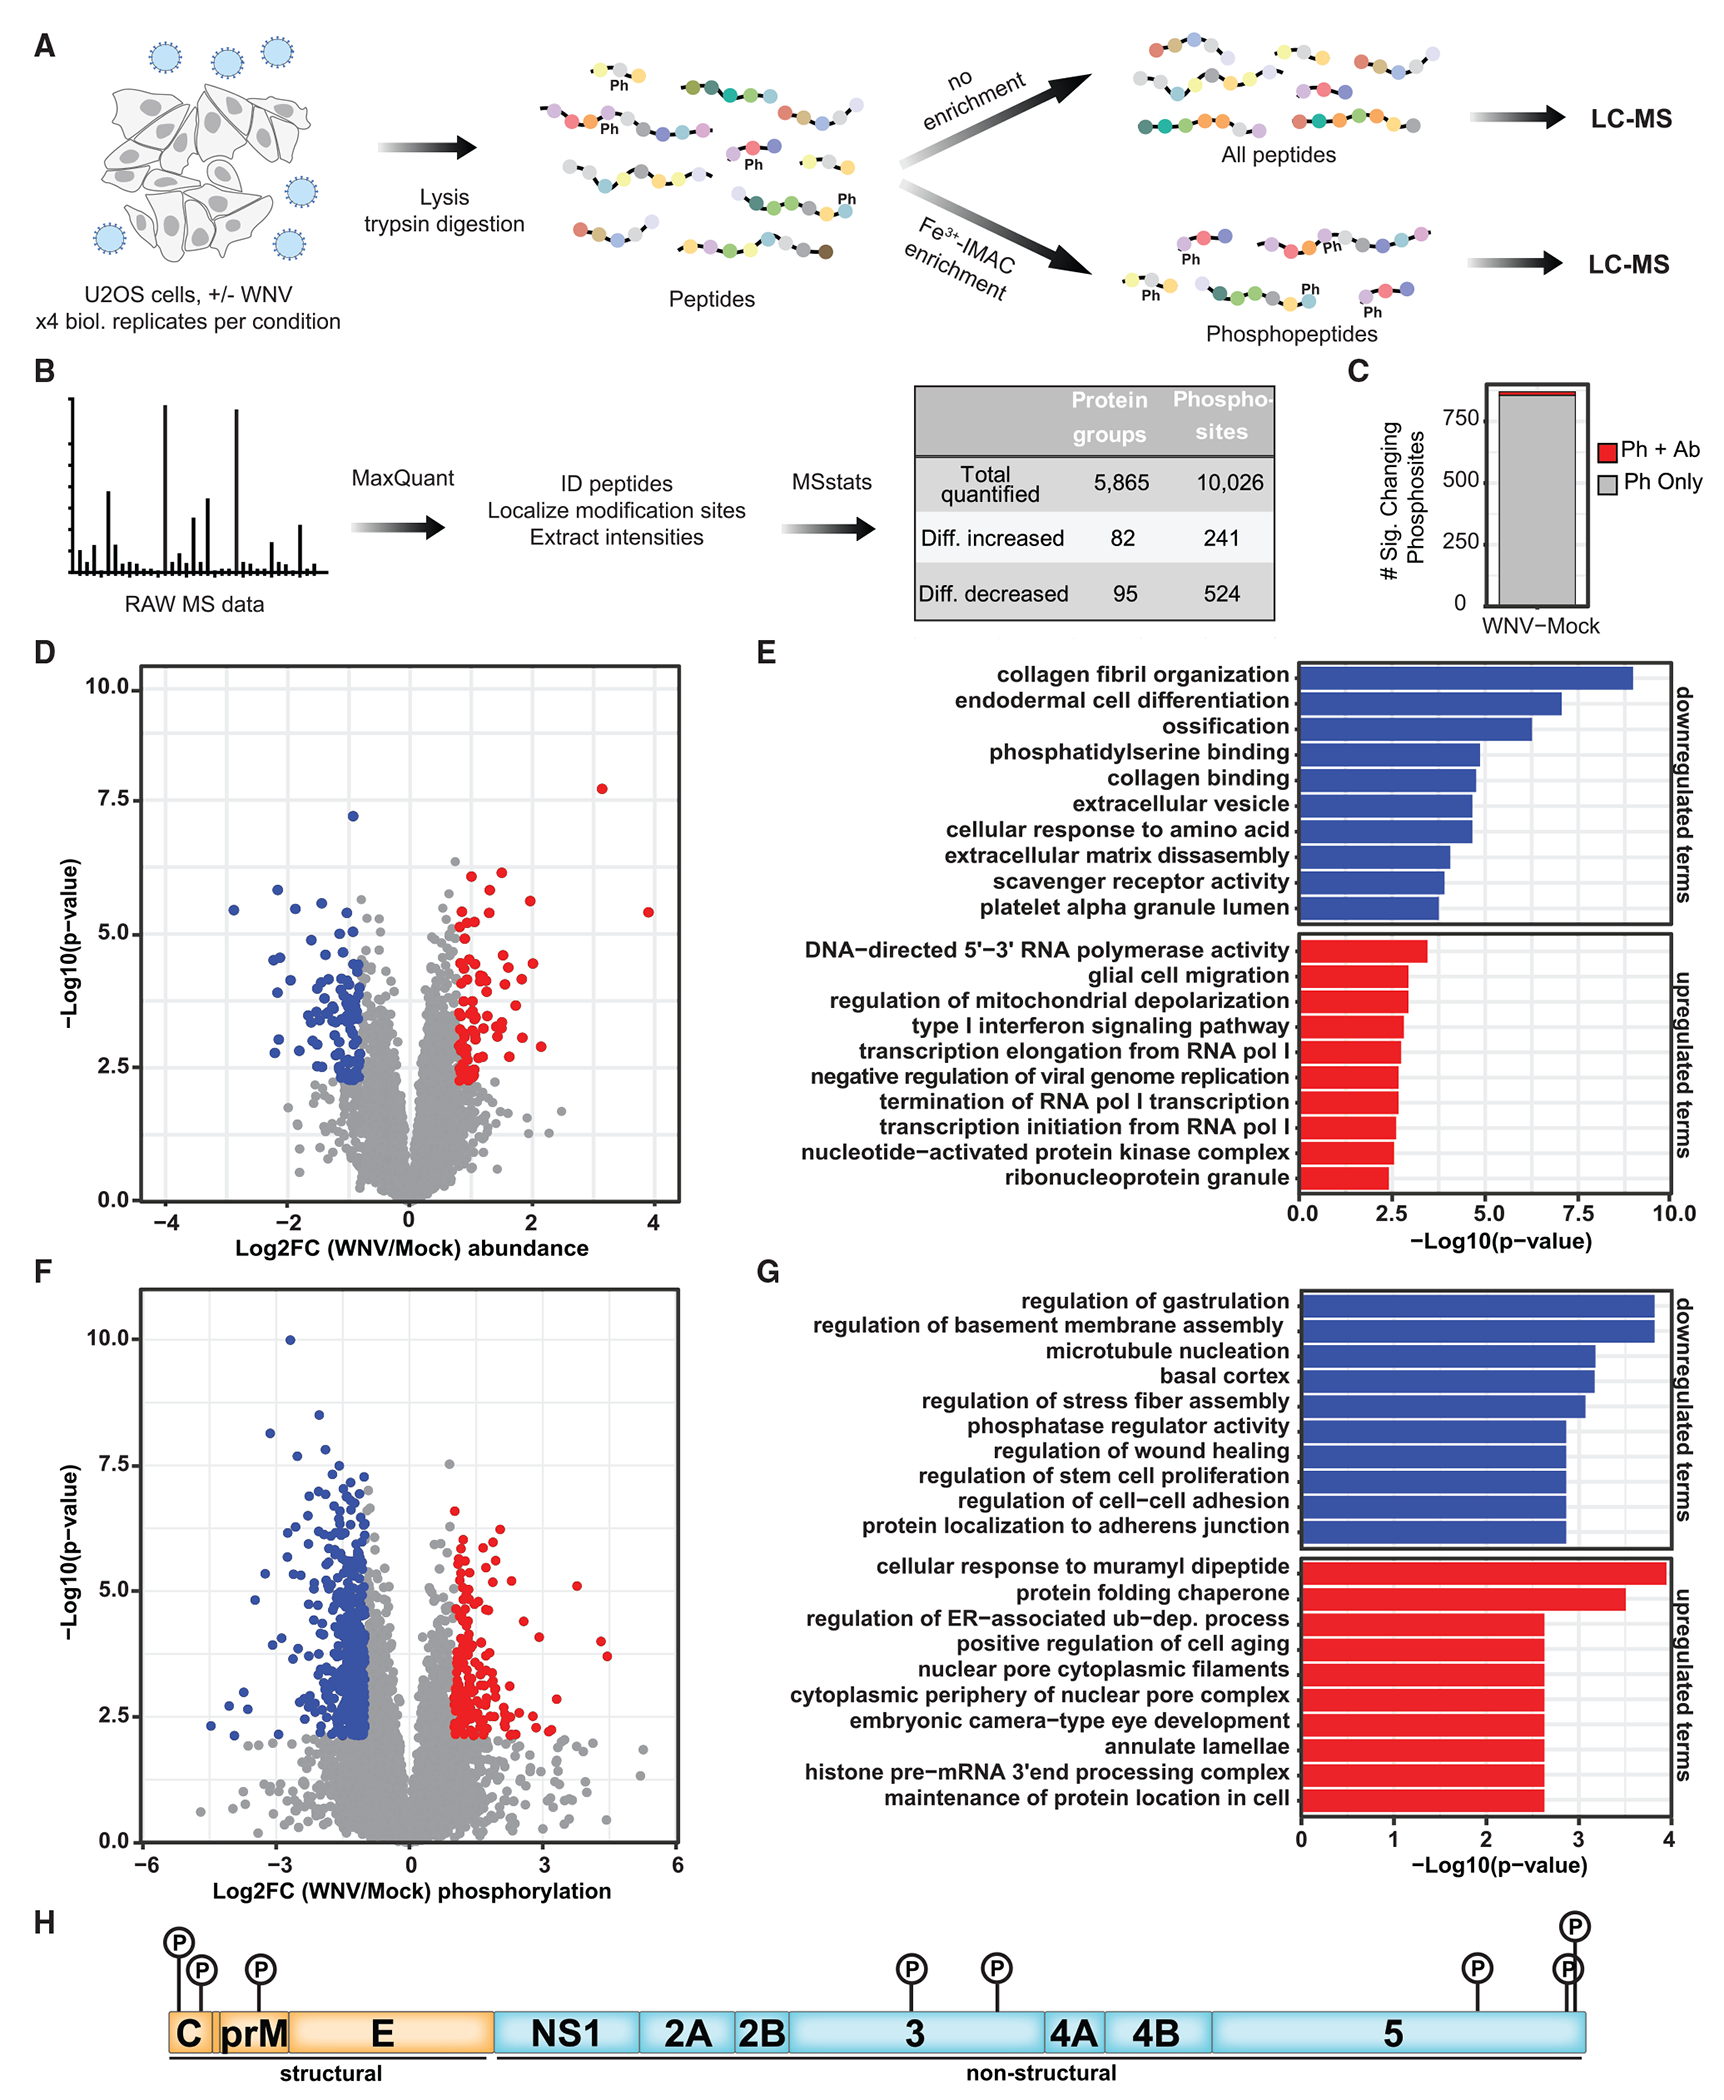
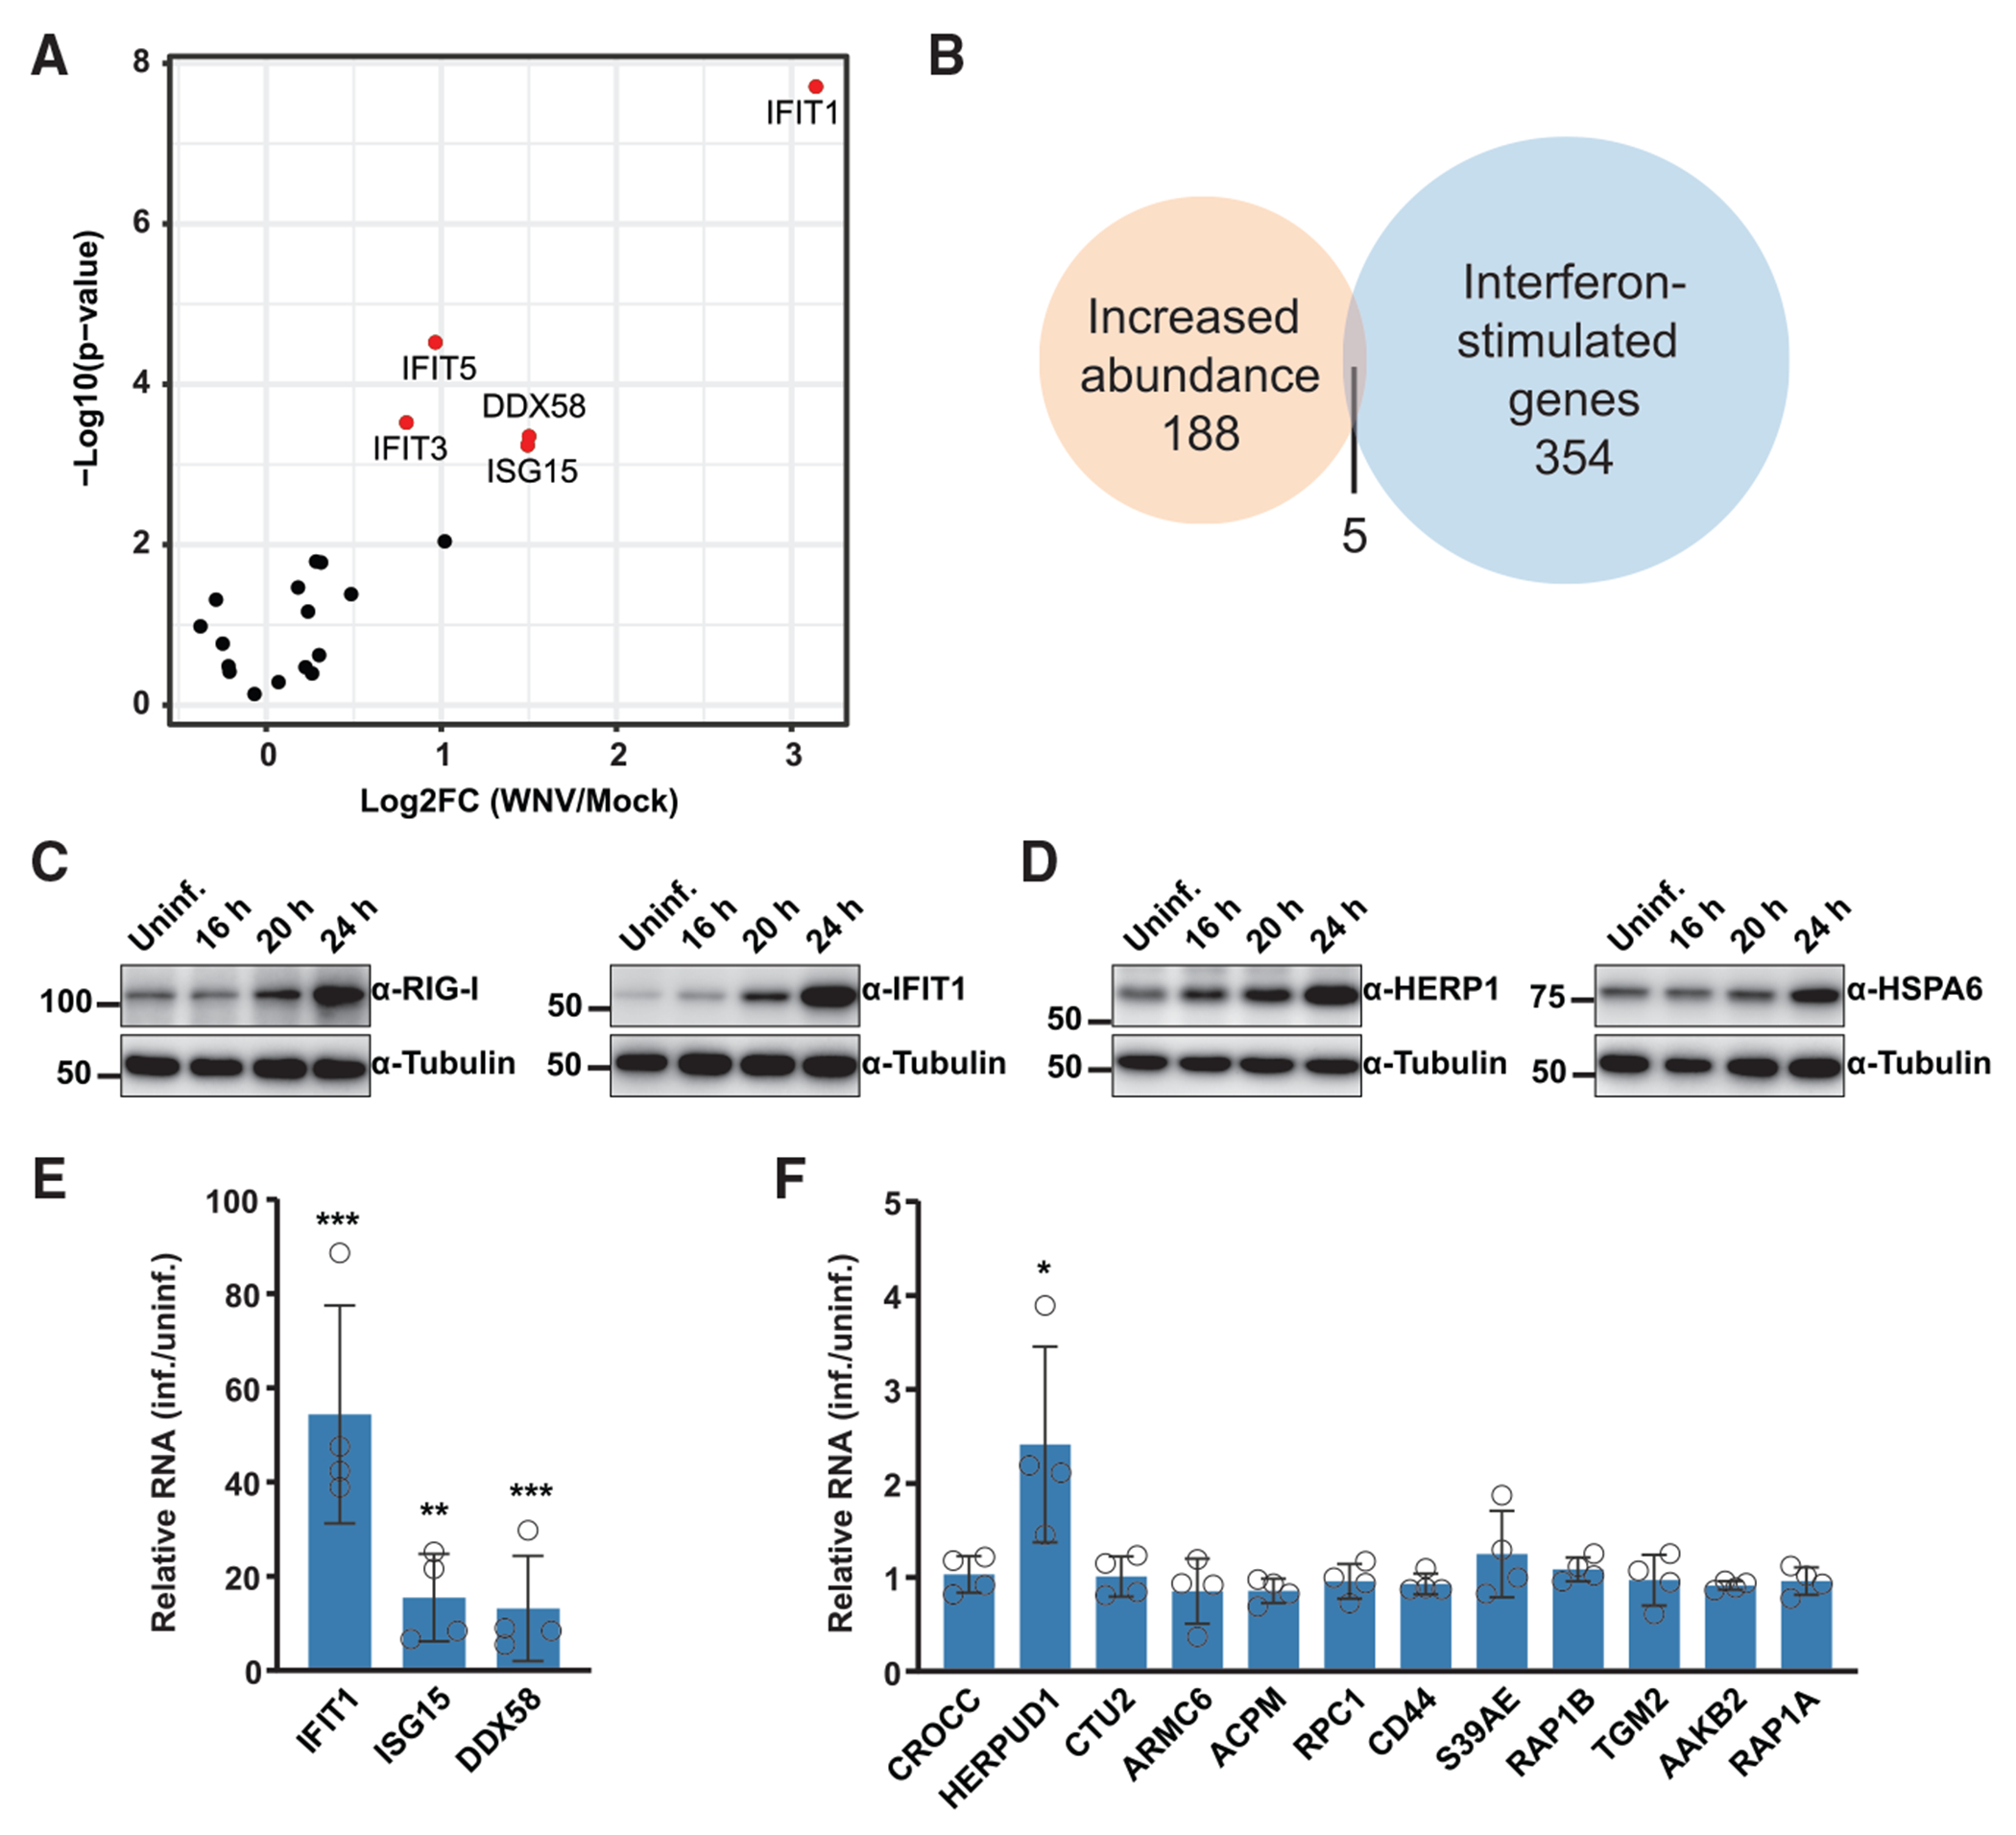
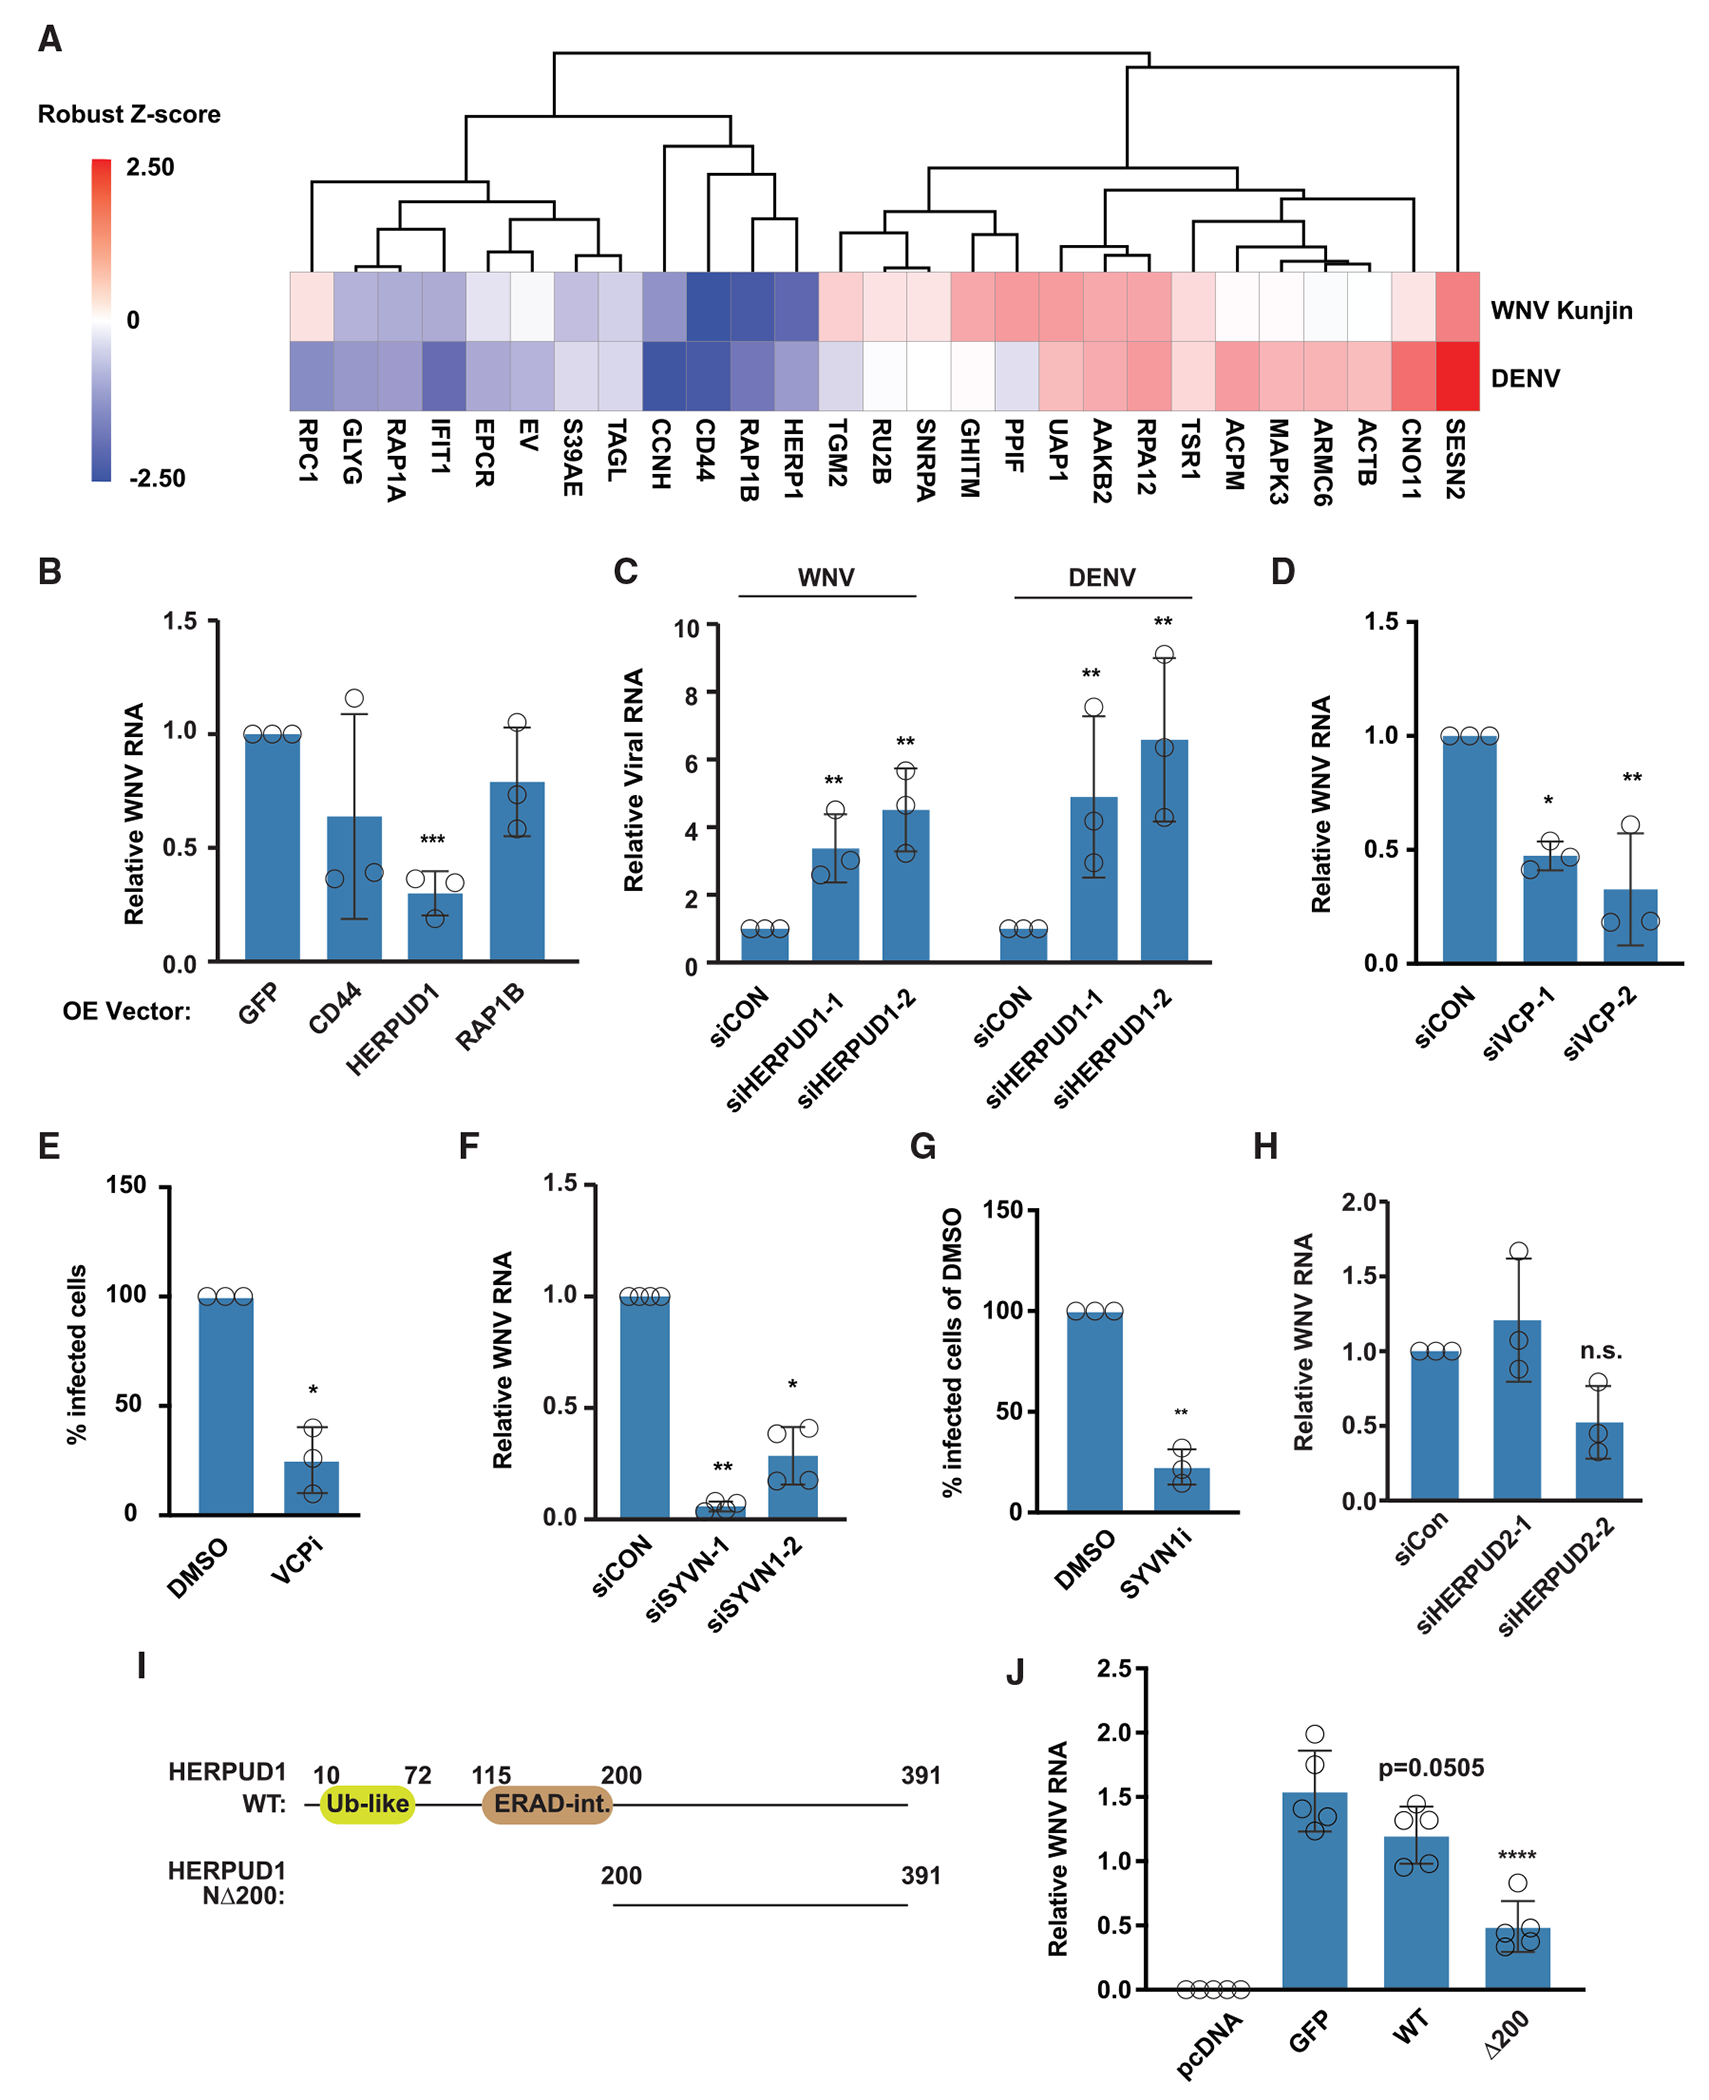
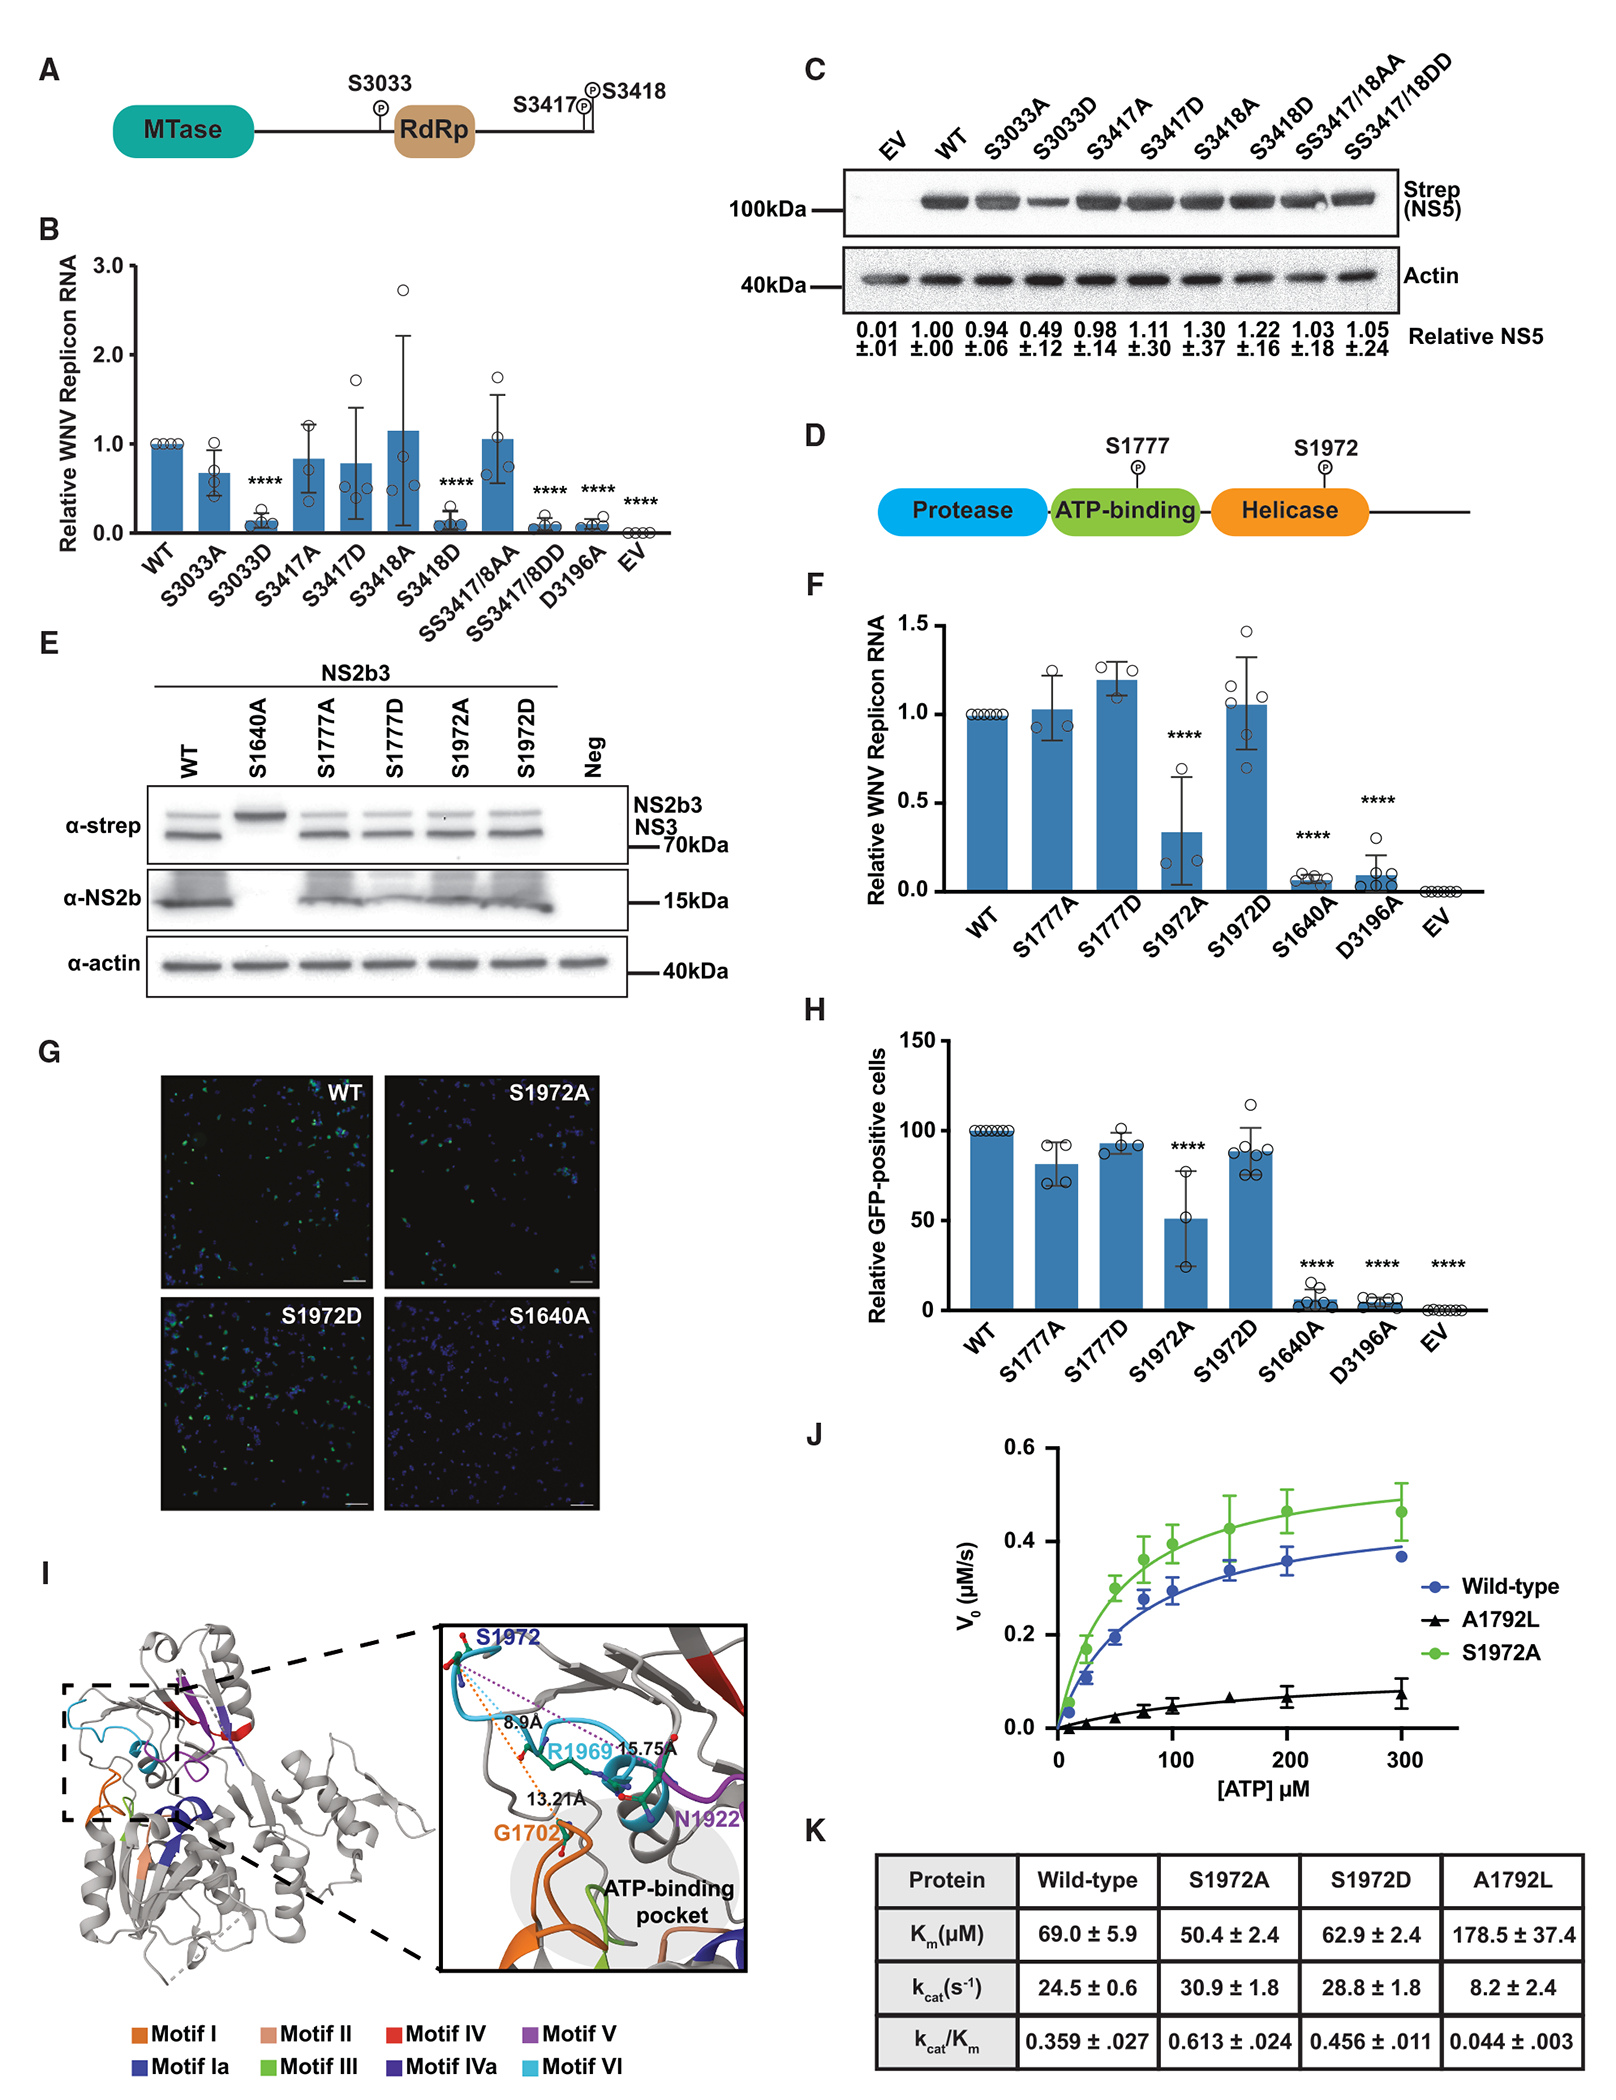
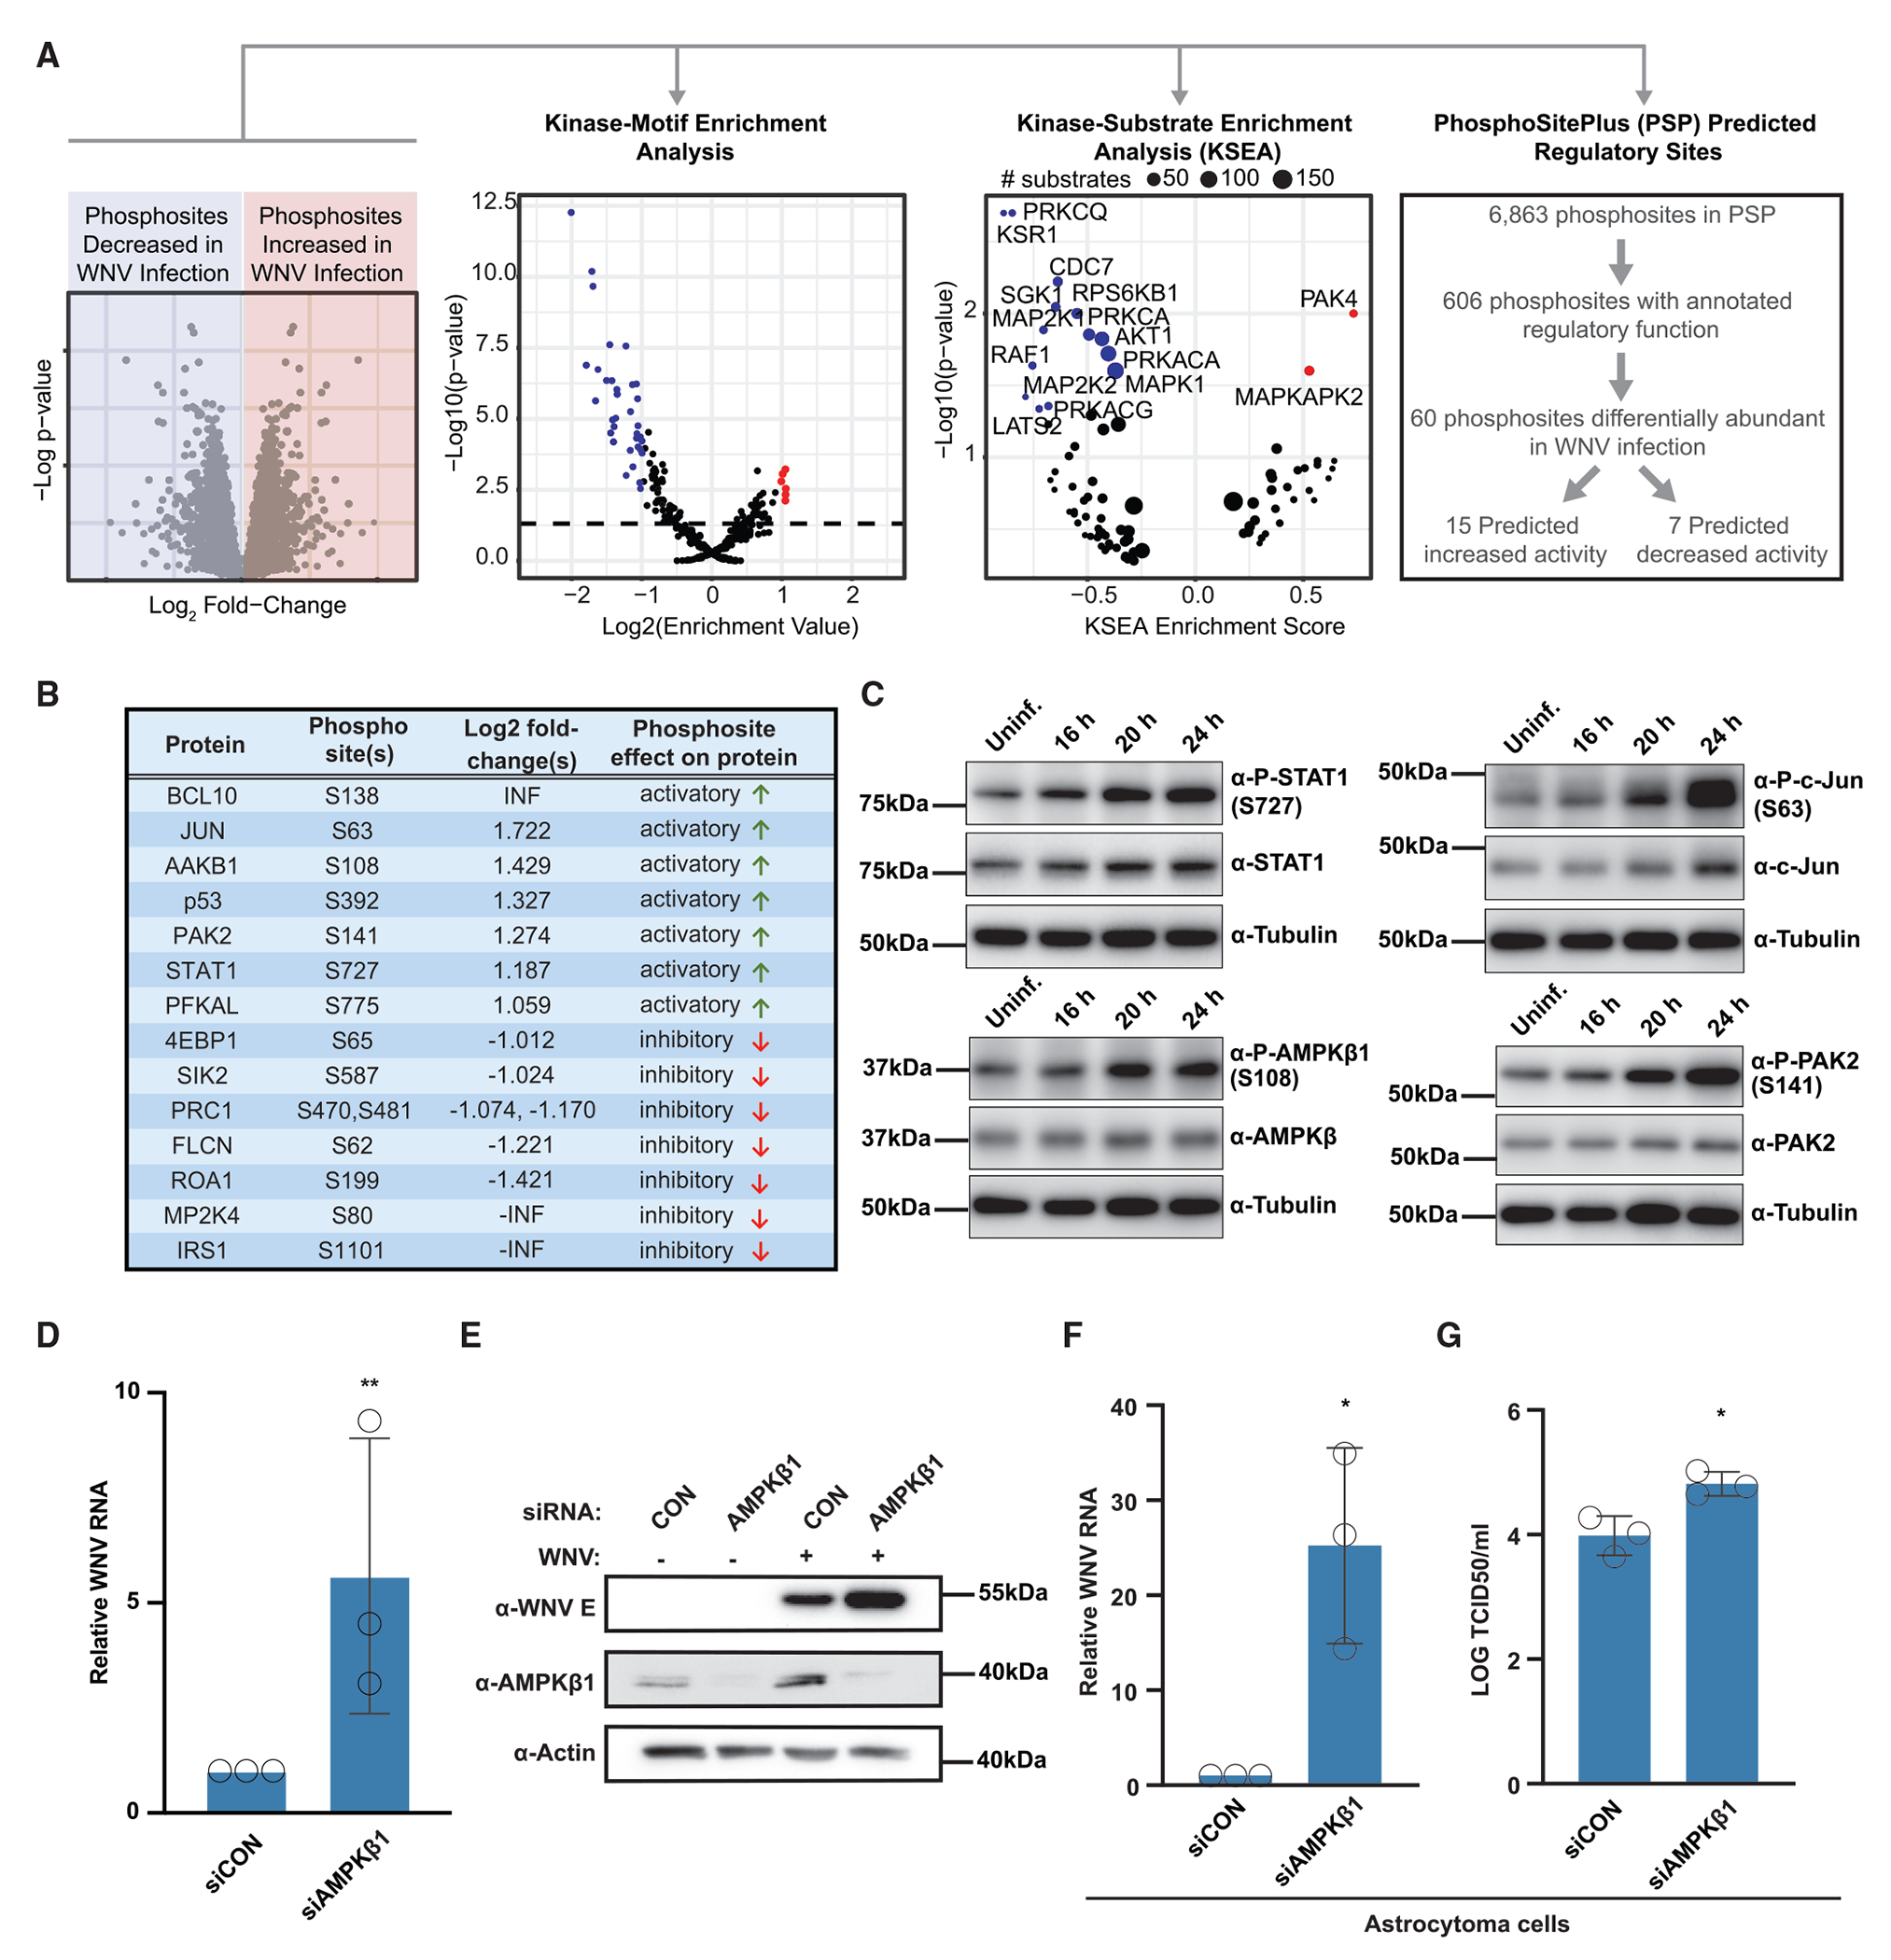
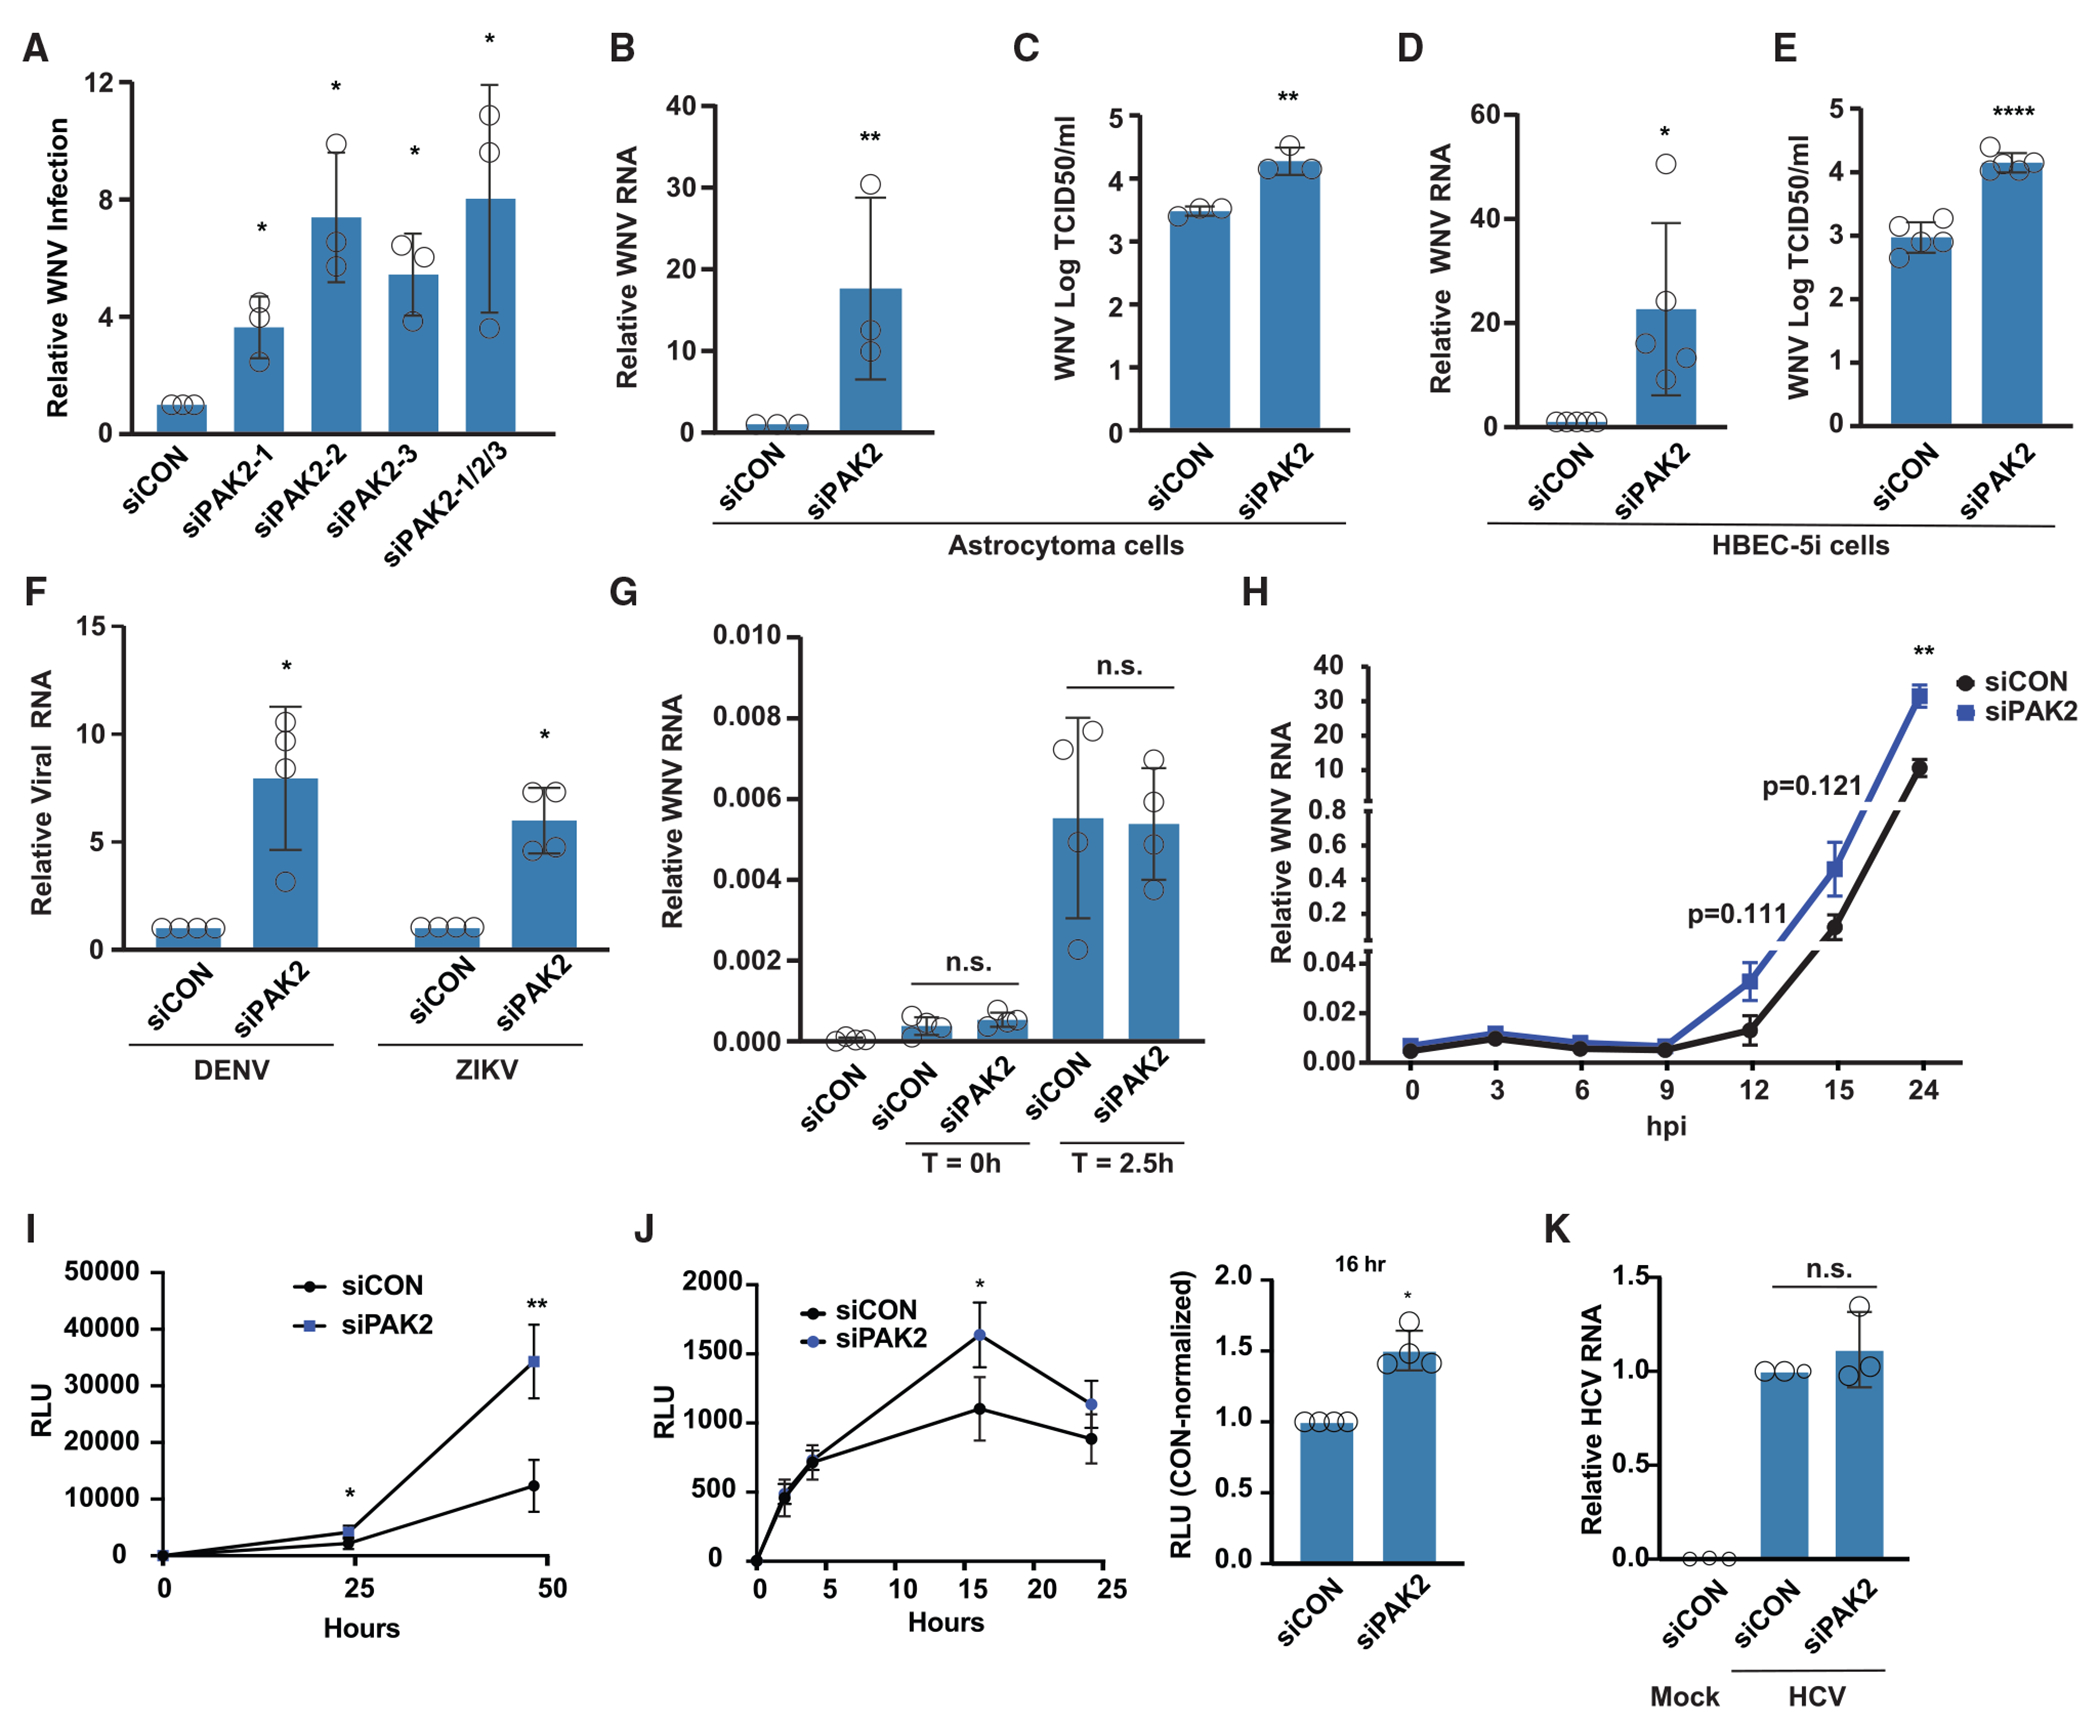
Upon infection, viruses alter the proteome, creating a hospitable environment for infection. Cells respond to limit viral replication, including through protein regulation by post-translational modifications. We use mass spectrometry to define proteome alterations during West Nile virus (WNV) infection. Our studies identify upregulation of HERPUD1, which restricts WNV replication through a mechanism independent of its role in endoplasmic reticulum (ER)-associated degradation (ERAD). We also identify modifications on viral proteins, including a WNV NS3 phosphorylation site that impacts viral replication. Finally, we reveal activation of two host kinases with antiviral activity. We identify phosphorylation at S108 of AMPKβ1, a non-catalytic subunit that regulates activity of the AMPK complex. We also show activation of PAK2 by phosphorylation at S141, which restricts translation of the viral genome. This work contributes to our understanding of the interplay between host and virus while providing a resource to define the changes to the proteome that regulate viral infection.

Keywords: CP: Microbiology; Orthoflaviviruses; West Nile virus; innate immunity; phosphorylation; post-translational modifications; viral helicase; viral translation; virus-host interactions.


Conflict of interest statement

Declaration of interests The authors declare no competing interests.

Figures

Figure 1.
Figure 1.. Quantification of protein changes during WNV infection
(A and B) Strategy to generate proteomic samples (A) and quantify changes in protein abundance and phosphorylation (B). (C) Proteins with significant phosphosites and abundance changes (red) vs. proteins with only significant changes in phosphosites (gray). (D) Volcano plot depicting upregulated (red) or downregulated (blue) peptides. Shown is log2 fold change of protein abundance (x axis) vs. −log10 adjusted p value (y axis). (E) Enriched terms for proteins with increased (red) or decreased abundance (blue) upon WNV infection. The magnitude represents statistical significance (−log(p value)). (F) Volcano plot depicting protein phosphorylation changes as in (D). (G) Enriched terms for increased or decreased phosphorylation as in (E). (H) WNV polyprotein with indicated phosphorylated residues. For all MS data, n = 4. See also Figures S1 and S2; Tables S1, S2, S3, and S4; and Data S1.
Figure 2.
Figure 2.. Protein abundance changes during WNV infection
(A) Volcano plot showing expression of known antiviral ISGs. (B) Overlap of proteins with increased abundance with known antiviral ISGs. (C and D) U2OS cells were infected with WNV NY2000 (MOI 1) and lysates were probed with the indicated antibodies. (E) Relative RNA of indicated ISGs with increased protein abundance from WNV-infected cells. (F) Relative RNA of indicated transcripts with increased protein abundance from WNV-infected cells. For all data, the mean ± SD is shown; n = 4. Western blot data are representative of ≥2 independent experiments. Significance is indicated by *p < 0.05, **p < 0.005, or ***p < 0.0005; two-tailed Student’s t test. See also Table S5.
Figure 3.
Figure 3.. Overexpression screen for upregulated proteins
(A) Heatmap of average robust Z scores for WNV Kunjin or DENV infection upon cDNA overexpression (n = 2; Table S6) with rows clustered by Euclidean distance. (B) Relative RNA of WNV NY2000 in HEK293T cells transfected with cDNA constructs, normalized to a control GFP-expressing vector. n = 3. (C) Relative WNV NY2000 or DENV viral RNA upon HERPUD1 silencing, normalized to siControl (siCON). n = 3. (D) Relative WNV RNA in U2OS cells transfected with control or VCP siRNAs, normalized as in (C). n = 3. (E) Cells were treated with VCP inhibitor Eey1 (VCPi; 5 μM) or DMSO and infected with WNV Kunjin for 24 h. Infection was quantified using immunofluorescence microscopy and normalized to DMSO control. n = 3. (F) Relative viral RNA following infection with WNV NY2000 upon silencing of SYVN1, normalized as in (C). n = 4. (G) Relative percentage infection of WNV Kunjin in cells treated with an SYVN1 inhibitor (LS102, 10 μM) or DMSO. Shown is the DMSO-normalized percentage infection. n = 3. (H) Relative viral RNA following infection with WNV NY2000 upon HERPUD2 knockdown. Infections are normalized as in (C). n = 3. (I) The ubiquitin-like (Ub-like) and the ERAD protein (UBQLN1 and SYVN1)-interacting (ERAD-int.) domains of HERPUD1. (J) Relative WNV replicon RNA from cells co-transfected with the indicated vectors. n = 5. For all data, the mean ± SD is shown. Significance is indicated by *p < 0.05, **p < 0.005, or ***p < 0.0005; two-tailed Student’s t test or Welch’s ANOVA with Bonferroni post hoc correction. See also Figure S3; Table S6.
Figure 4.
Figure 4.. Characterization of phosphorylation sites on WNV NS3 and NS5 proteins
(A) WNV NS5 schematic with phosphorylated residues indicated. (B) Wild-type (WT) or mutant WNV replicon constructs were transfected into HEK293T cells; relative WNV replicon RNA is normalized to the WT control. The RdRp-dead D3196A and empty vector (EV) are included as controls. n = 4. (C) Representative western blot of strep-tagged WT and phospho-mutant WNV NS5 with actin loading control. Relative protein expression (Alphaview) is indicated underneath each lane, mean ± SE. n = 4. (D) WNV NS3 schematic with phosphorylated residues indicated. (E) Western blot demonstrating self-cleavage of strep-tagged NS2b/3 constructs with actin as a loading control. The NS3 protease-dead (S1640A) construct is included as a control. (F) A replicon assay was performed as described in (B). The S1640A mutant is included as a control. n = 3–6. (G) Representative immunofluorescence images from data quantified in (H). Hoechst (DNA) is shown in blue, GFP in green, scale bar indicates 150 μm. (H) Quantification of WT-normalized GFP+ HEK293T cells following transfection of the indicated WNV replicons. S1640A, D3196A, and EV are included as controls. n = 3–7. (I) Structure of the WNV NS3 helicase domain (PDB: 2QEQ) with motifs false colored and ATP-binding pocket in gray. (J) Michaelis-Menten kinetic curves for WT, A1792L, and S1972A NS3h. (K) Km and kcat ± SE and catalytic efficiency (kcat/Km) ± SE for each mutant. n = 3–5. Unless indicated, the mean ± SD is shown for all data. Western blot data are representative of ≥2 independent experiments. Statistics are one-way ANOVA with corrections for multiple comparisons; ****p < 0.0001. See also Figures S4 and S5.
Figure 5.
Figure 5.. Protein phosphorylation during WNV infection
(A) Significantly changed phosphorylated peptides were analyzed by: (left) Kinase Library analysis with volcano plot showing increased (red) or decreased (blue) consensus motifs in WNV-infected cells for indicated kinases; (middle) kinase-substrate enrichment analysis (KSEA), with increased (red) or decreased (blue) kinase substrates during infection; and (right) differentially abundant phosphosites in WNV infection with an annotated regulatory function (PhosphoSitePlus). (B) Regulatory phosphosites predicted to increase activity during infection. (C) Validation of phosphorylation by western blot in WNV-infected U2OS cells (NY2000, MOI 1), with tubulin shown as a loading control. (D) Relative WNV RNA following infection upon AMPKβ1 depletion in U2OS cells, normalized to siControl (siCON). (E) Silenced U2OS cells were infected with WNV NY2000 (MOI 10) and lysates were probed with the indicated antibodies. (F) Relative WNV NY2000 RNA from silenced CCF-STTG1 astrocytoma cells. Infections are normalized as in (D). (G) TCID50 assays were performed on supernatants from (F). Data are presented as log10(TCID50/mL). For all data, the mean ± SD is shown. n = 3. Western blot data are representative of ≥2 independent experiments. Significance is indicated by *p < 0.05 or **p < 0.005, two-tailed Student’s t test. See also Figure S6; Tables S7, S8, and S9.
Figure 6.
Figure 6.. PAK2 restricts WNV by inhibiting viral RNA translation
(A) U2OS cells were transfected with PAK2 siRNAs and infected with WNV NY2000. Relative WNV RNA is normalized to cells treated with siControl (siCON). n = 3. (B) Relative WNV RNA from PAK2-silenced CCF-STTG1 cells. Data are normalized as in (A). n = 3. (C) Supernatant from (B) was used to perform TCID50 assays. Data shown are the mean ± SD log10(TCID50/mL). n = 3. (D) Relative WNV RNA from infected HBEC-5i cells transfected as in (B), normalized to siCON samples. n = 5. (E) TCID50 assays were performed on supernatants from (D). Data shown are the mean ± SD log10(TCID50/mL). n = 5. (F) Relative DENV and ZIKV RNA from U2OS cells transfected with PAK2 siRNAs. Data are normalized as in (A). n = 4. (G) Viral entry of WNV NY2000 in PAK2-silenced U2OS cells. n = 4. (H) Relative viral RNA from PAK2-silenced U2OS cells at indicated time points. n = 4. (I) PAK2-silenced HEK293T cells were transfected with Renilla luciferase DENV replicon RNA. n = 4. (J) PAK2-silenced HEK293T cells were transfected with a capped polymerase-dead DENV replicon RNA. n = 4. (K) Relative viral RNA from PAK2-silenced Huh7.5 cells infected with hepatitis C virus (HCV) for 24 h, normalized to siCON. n = 3. For all data, the mean ± SD is shown. All analyses are either two-tailed unpaired Student’s t test or one-way ANOVA with corrections for multiple comparisons. n.s. indicates p > 0.05; *p < 0.05, **p < 0.01, and ****p < 0.0001. See also Figure S7.

Similar articles

Cited by

References

    1. Colpitts TM, Conway MJ, Montgomery RR, and Fikrig E (2012). West Nile Virus: biology, transmission, and human infection. Clin. Microbiol. Rev 25, 635–648. 10.1128/CMR.00045-12. - DOI - PMC - PubMed
    1. Nash D, Mostashari F, Fine A, Miller J, O’Leary D, Murray K, Huang A, Rosenberg A, Greenberg A, Sherman M, et al. (2001). The outbreak of West Nile virus infection in the New York City area in 1999. N. Engl. J. Med 344, 1807–1814. 10.1056/NEJM200106143442401. - DOI - PubMed
    1. Suthar MS, Diamond MS, and Gale M Jr. (2013). West Nile virus infection and immunity. Nat. Rev. Microbiol 11, 115–128. 10.1038/nrmicro2950. - DOI - PubMed
    1. Li M, Johnson JR, Truong B, Kim G, Weinbren N, Dittmar M, Shah PS, Von Dollen J, Newton BW, Jang GM, et al. (2019). Identification of antiviral roles for the exon-junction complex and nonsense-mediated decay in flaviviral infection. Nat. Microbiol 4, 985–995. 10.1038/s41564-019-0375-z. - DOI - PMC - PubMed
    1. Besson B, Basset J, Gatellier S, Chabrolles H, Chaze T, Hourdel V, Matondo M, Pardigon N, and Choumet V (2020). Comparison of a human neuronal model proteome upon Japanese encephalitis or West Nile Virus infection and potential role of mosquito saliva in neuropathogenesis. PLoS One 15, e0232585. 10.1371/journal.pone.0232585. - DOI - PMC - PubMed

LinkOut - more resources