. 2025 Jul:84:103665.
doi: 10.1016/j.redox.2025.103665. Epub 2025 May 11.

Targeting MYOF suppresses pancreatic ductal adenocarcinoma progression by inhibiting ILF3-LCN2 signaling through disrupting OTUB1-mediated deubiquitination of ILF3

Affiliations

Targeting MYOF suppresses pancreatic ductal adenocarcinoma progression by inhibiting ILF3-LCN2 signaling through disrupting OTUB1-mediated deubiquitination of ILF3

Zhihui Li et al. Redox Biol. 2025 Jul.

Abstract

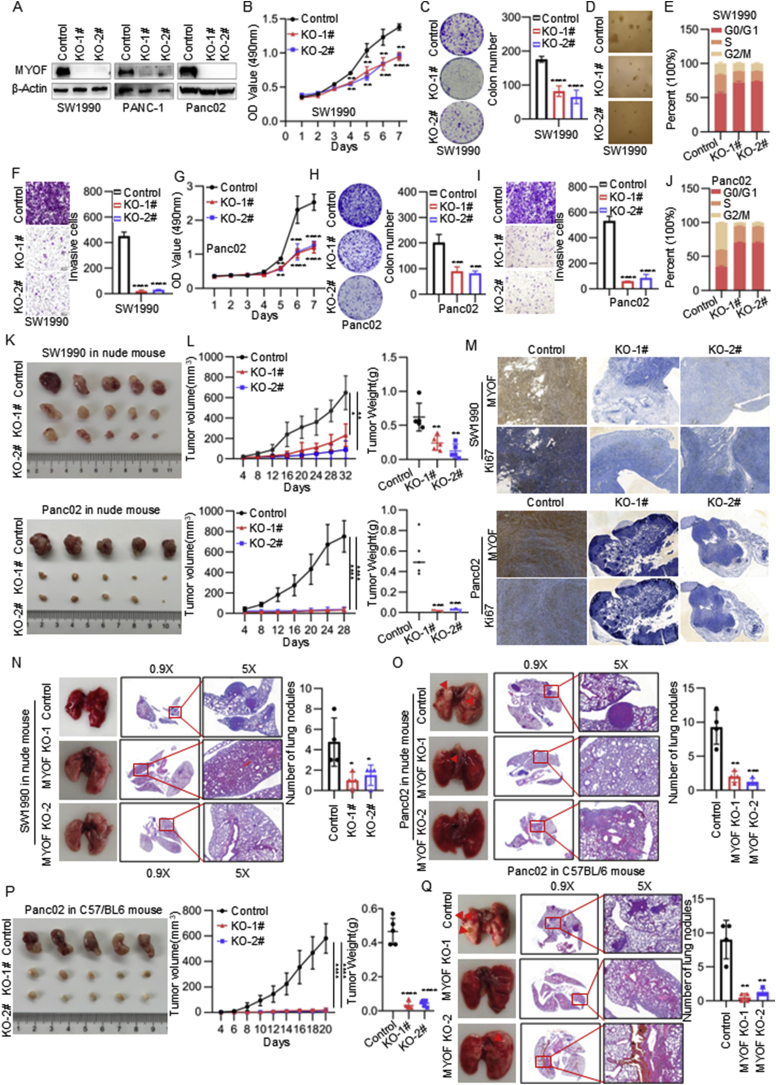
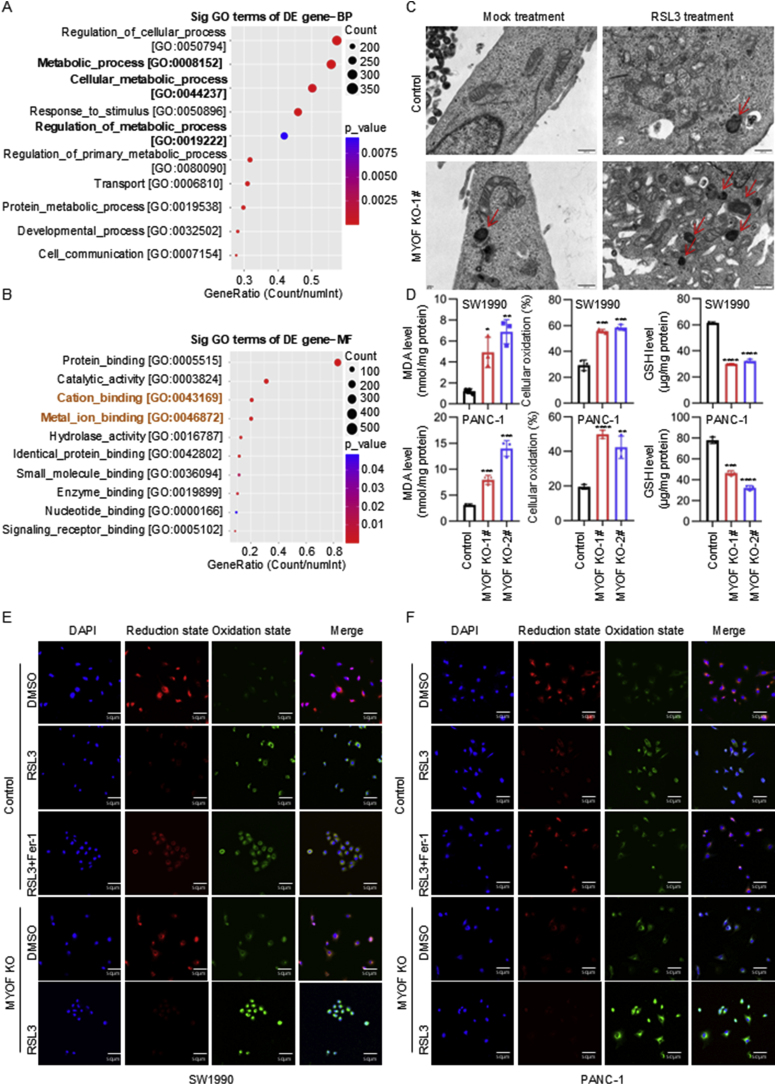
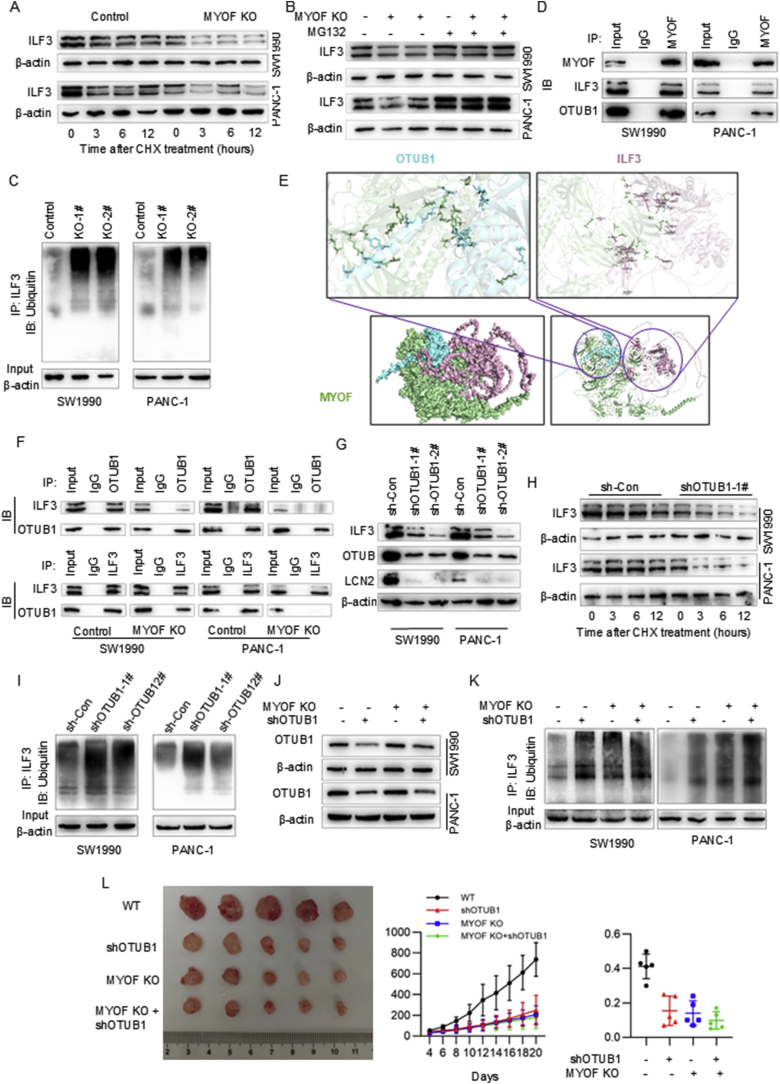
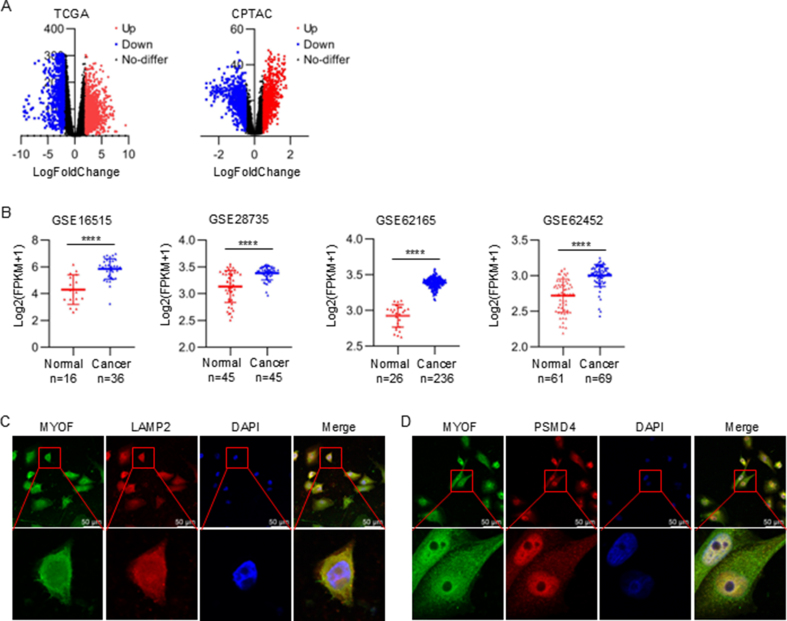
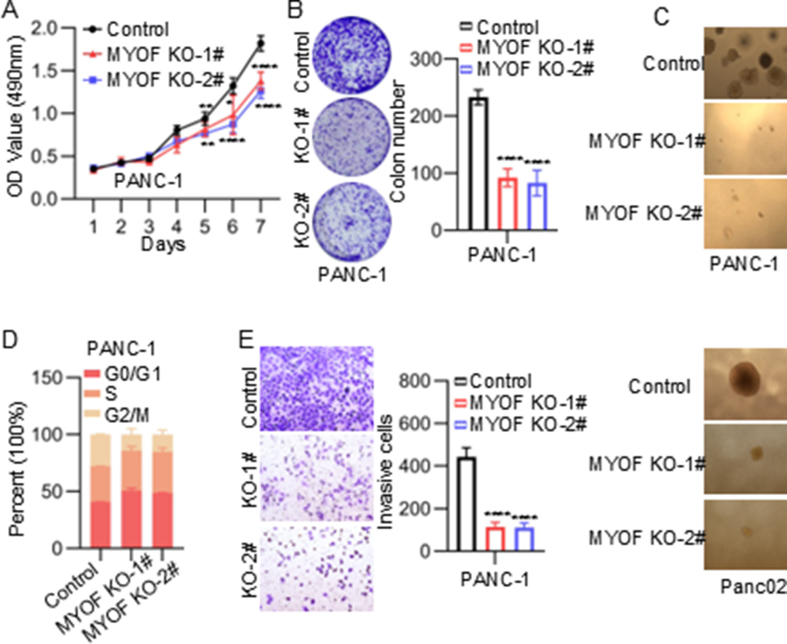
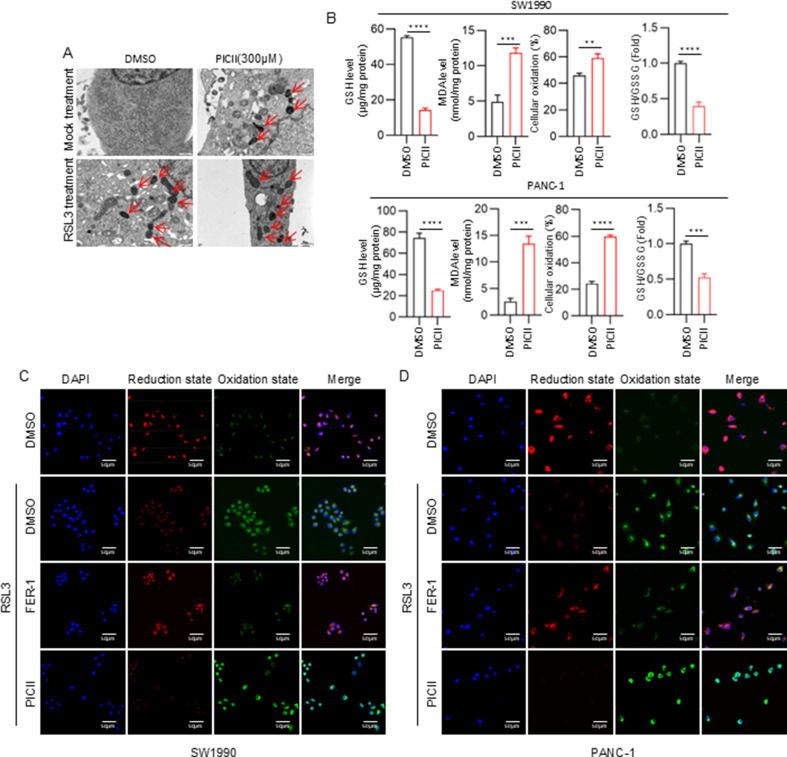
Pancreatic ductal adenocarcinoma (PDAC) is still a highly aggressive and fatal disease. The molecular mechanisms for PDAC progression are still not fully understood. Here, we demonstrated the overexpression of MYOF in PDAC in multiple sample sets, which is significantly associated with poor outcome of PDAC patients. MYOF knockout suppresses PDAC progression in vitro and in vivo. MYOF knockout exerts its effects by promoting ferroptosis via downregulating LCN2 expression. Ectopic LCN2 expression overcame the effects of MYOF knockout in PDAC cells. Mechanistically, MYOF respectively recruits OTUB1 and ILF3 to enhance their interaction and relieves ILF3 protein ubiquitination and degradtion. MYOF maintains ILF3 protein stability, thereby enhances ILF3 interacting with and improving LCN2 mRNA stability. Moreover, we screened and identified natural compound Picroside II potentially targets MYOF to suppress PDAC progression. These findings uncover the biological roles and mechanisms of MYOF and preliminarily indicate the potential of targeting MYOF in PDAC progression, highlighting a novel therapeutic strategy for PDAC.

Keywords: Ferroptosis; ILF3; LCN2; MYOF; OTUB1; Pancreatic cancer.


Conflict of interest statement

Declaration of competing interest The authors declare that they have no known competing financial interests or personal relationships that could have appeared to influence the work reported in this paper.

Figures

Image 1
Graphical abstract
Fig. 1
Fig. 1
MYOF is up-regulated in PDAC tissues and is associated with a poor prognosis. A Venn diagram of TCGA and CPTAC dataset showing 320 co-upregulated gene. B The expression of MYOF in TCGA-PAAD dataset and CPTAC-PDAC dataset. C In the TCGA and CPTAC database, the expression of MYOF in pancreatic cancer histological grades G2, G3 and G4 was higher than that in G1, and the difference was statistically significant. D The tSNE mapping of MYOF in different cellular taxa based on the public single-cell dataset GSE165399. E Violin plot of MYOF distribution across cellular subpopulations. F IHC staining was performed using an antibody against MYOF and representative photographs of MYOF in PDAC patients. G MYOF protein and mRNA expression levels in a normal pancreatic cell line and PC cell lines. H Immunofluorescence between MYOF (red) and LAMP2 (green) in pancreatic cancer tissue. I Immunofluorescence between MYOF (green) and PSMD4 (red) in pancreatic cancer tissue. J Immunofluorescence between MYOF (red) and LAMP2 (green) in pancreatic cancer cell line SW1990. K Immunofluorescence between MYOF (red) and PSMD4 (green) in pancreatic cancer cell line SW1990. L The overall survival and the disease-free survival of PDAC patient in MYOF-low or MYOF-high expression group. ∗p < 0.05, ∗∗p < 0.01, ∗∗∗p < 0.001, ∗∗∗∗p < 0.001.
Fig. 2
Fig. 2
MYOF promotes PDAC progression. A Western blot analysis of SW1990 PANC-1 and Panc02 stably transfected with MYOF knockdout lentiviruses and control lentiviruses. Total β-actin was used as a loading control. B The proliferation rate of SW1990 measured by MTS assay. C The colony formation assay. Left panel: representative images, right panel: quantification analysis. D Soft agar assays of PDAC cells. E Cell cycle changes were demonstrated by flow cytometry in SW1990 cell lines following the knockout of MYOF. F Transwell migration assays were performed to assess migration ability of MYOF-knockout stable cell lines. Representative images (left panel) and quantification (right panel) are shown as indicated. Data from independent experiments are presented as the mean ± SD. G The proliferation rate of Panc02 measured by MTS assay. H The colony formation assay. Left panel: representative images, right panel: quantification analysis. I Transwell migration assays. J Cell cycle assay. K Images of subcutaneous xenografts from mice in the MYOF KO and NC groups. n = 5. L Tumor volume growth curve and tumor weight scatter plot of subcutaneous xenograft. M The IHC staining of Ki67, MYOF in xenografted tumors. N Left: corresponding images of the lungs after injection of SW1990 cells by tail vein; images taken 10 weeks after injection. Right: statistical significance of the metastasis nodules number assessed by paired t-test. O Left: corresponding images of the lungs after injection of Panc02 cells by tail vein; images taken 3 months after injection. Right: statistical significance of the metastasis nodules number assessed by paired t-test. P The xenografted PDAC tumors in C57BL/6 mice. n = 5; The tumor volume quantification; The tumor weight quantification. Q Left: corresponding images of the lungs after injection of Panc02 cells by tail vein; images taken 3 months after injection. Right: statistical significance of the metastasis nodules number assessed by paired t-test. ∗p < 0.05, ∗∗p < 0.01, ∗∗∗p < 0.001, ∗∗∗∗p < 0.0001.
Fig. 3
Fig. 3
MYOF knockout induces ferroptosis in PDAC cells. A GO enrichment analysis was performed to predict the downstream biological processes of MYOF. B GO enrichment analysis was performed to predict the downstream molecular function of MYOF. C Transmission electron microscopy images. D Levels of malondialdehyde (MDA), cellular oxidation (%) and glutathione (GSH) in control and MYOF knockout PDAC cells. n = 3. E-F The confocal laser scanning microscopy images of C11-BODIPY581/591-stained SW1990 and PANC-1 cells after treatment with different formulations. Scale bar = 50 μm ∗p < 0.05, ∗∗p < 0.01, ∗∗∗p < 0.001, ∗∗∗∗p < 0.0001.
Fig. 4
Fig. 4
MYOF knockout exerts effects via inhibiting LCN2 epxression in PDAC cells. A Gene abundance and protein levels of LCN2 after knockdown of MYOF. B The IHC staining of LCN2 in xenografted tumors. C Western blot analysis of LCN2 overexpression in stable knockout MYOF cell lines. D The proliferation rate of PDAC cells measured by MTS assay. E The colony formation assay. Left panel: representative images, right panel: quantification analysis. F Transwell migration assays. G Cell cycle assay. H Transmission electron microscopy images. I Malondialdehyde (MDA), cellular oxidation (%), Glutathione (GSH) levels and Ratio of GSH/GSSG in cells. n = 3. J Images of subcutaneous xenografts from Nude mice. n = 5; Tumor volume growth curves; Tumor weight scatter plot for subcutaneous xenografts. ∗p < 0.05, ∗∗p < 0.01, ∗∗∗p < 0.001, ∗∗∗∗p < 0.0001.
Fig. 5
Fig. 5
MYOF knockout exerts effects via inhibiting LCN2 epxression in PDAC cells. A RT-PCR of LCN2 in PDAC cells from MYOF-knockout group and control groups by actinomycin D treatment (5 μg/mL) over time. B Silver staining of IP cell lysates. C Wayne diagram of RBPs and MYOF-interacting proteins; D Fold-out plots showing the binding scores of ILF3 protein to each fragment of LCN2 mRNA. E Research reveals that ILF3 interacts with LCN2 mRNA, as evidenced by RNA immunoprecipitation (RIP) experiments conducted in SW1990 and PANC-1 cells. Anti-ILF3 antibodies were employed for targeted detection, while anti-SNRNP70 (positive control) and anti-IgG (negative control) were used as comparative controls. Following this, RT-qPCR was carried out with primers designed for the specific mRNA. The relative enrichment of RIP-isolated mRNA compared to input samples was quantified, with outcomes expressed as mean ± SD. F Through ChIRP experiments, the enrichment of LCN2 mRNA and the pull-down efficiency of ILF3 protein in SW1990 cells were detected using an LCN2-targeting probe compared to a negative control LacZ probe. G QRCR to verify the transcript levels of LCN2 after interference with ILF3. H WB to verify the expression of relevant genes after interference with ILF3 in pancreatic cancer cell lines. I RT-PCR results of LCN2 changes over time in PDAC cells before and after interference with ILF3 by actinomycin D treatment (10 μg/mL). Data were expressed as mean ± SD. J, K WB and qPCR verified the transcription and translation levels of ILF3 after MYOF knockout. ∗p < 0.05, ∗∗p < 0.01, ∗∗∗p < 0.001, ∗∗∗∗p < 0.0001.
Fig. 6
Fig. 6
MYOF recruits OTUB1 to inhibit ILF3 ubiquitination degradation. A Degradation of ILF3 protein was detected in PDAC cells after treatment of CHX at the indicated time points; B Western blot analysis of ILF3 expression after 6h treatment with 10 μM MG132; C ILF3 ubiquitylation was analyzed by immunoprecipitation using an anti-ILF3 antibody and immunoblotting was carried out with anti-Ub antibody; D Immunoprecipitation by using anti-MYOF antibody and immunoblotting with anti ILF3 and anti-OTUB1 antibodies; E Predicting binding complex models for MYOF, OTUB1 and ILF3 using the GRAMM online protein docking tool; F Immunoprecipitation was performed and detected by immunoblotting using anti-ILF3 or anti-OTUB1 antibodies; G After interfering with OTUB1, Western blot analysis of ILF3 expression after 6h treatment with 10 μM MG132. H. After interfering with OTUB1, degradation of ILF3 protein was detected after treatment of CHX at the indicated time points. I Cells from both the interfering OTUB1 and control groups were immunoprecipitated using an anti-ILF3 antibody. The resulting samples were analyzed for ILF3 ubiquitination and then immunoblotted with an anti-Ub antibody. J The Western blotting analysis identified the expression levels of OTUB1 in SW1990 and PANC-1 cells following OTUB1 knockdown. K The cells in each group were immunoprecipitated with anti-ILF3 antibody. The samples were then analyzed for ILF3 ubiquitination by Western blotting with anti-UB antibodies. L Images of subcutaneous xenografts from Nude mice. n = 5; Tumor volume growth curves; Tumor weight scatter plot for subcutaneous xenografts. ∗p < 0.05, ∗∗p < 0.01, ∗∗∗p < 0.001, ∗∗∗∗p < 0.0001.
Fig. 7
Fig. 7
Targeting MYOF by Picroside II suppresses PDAC progression. A AutoDock Vina software was applied to predict the molecular docking of MYOF with Picroside II; B The binding affinity of MYOF with Picroside II was evaluated and verified by the CETSA method, and the melting curves were fitted with Boltzmann stype GraphPad. C MTS proliferation assay to detect the proliferative ability of cells in Picroside II-treated and untreated groups; D Transwell migration assay. E Images of subcutaneous xenografts from mice in Picroside II-treated and untreated groups. F Tumour growth curves of mice in Picroside II-treated and untreated groups; Tumour weights of Picroside II-treated and untreated groups of mice. G Expression of MYOF, ILF3, OTUB1, LCN2 after Picroside II treatment. H WB assay to detect whether Bafa1 or MG132 can reverse Picroside II's effect on MYOF effect of Picroside II. ∗p < 0.05, ∗∗p < 0.01, ∗∗∗p < 0.001, ∗∗∗∗p < 0.0001.
Fig. S1
Fig. S1
(A) Volcano plot of pancreatic cancer differential gene expression in the TCGA and CPTAC databases. (B) Higher expression of MYOF was found in PDAC samples than the matched normal tissues (based on GSE16515, GSE62452, GSE62165 and GSE28735 databases). (C) Immunofluorescence between MYOF (green) and LAMP2 (red) in pancreatic cancer cell line PANC-1. (D) Immunofluorescence between MYOF (green) and PSMD4 (red) in pancreatic cancer cell line PANC-1. ∗p < 0.05, ∗∗p < 0.01, ∗∗∗p < 0.001, ∗∗∗∗p < 0.0001.
Fig. S2
Fig. S2
(A) The proliferation rate of PANC-1 measured by MTS assay. (B) The colony formation assay. Left panel: representative images, right panel: quantification analysis. (C) Soft agar assays of PANC-1 cells and Panc02 cells. (D) Flow cytometry showed cell cycle changes after knockdown of the MYOF gene in the PANC-1 cell line. (E) Transwell migration assays were performed to assess migration ability of MYOF-knockout stable cell lines. Representative images (left panel) and quantification (right panel) are shown as indicated. Data from independent experiments are presented as the mean ± SD. ∗p < 0.05, ∗∗p < 0.01, ∗∗∗p < 0.001, ∗∗∗∗p < 0.001.
Fig. S3
Fig. S3
(A) Scatter plots of up- and down-regulated differentially expressed genes after knockdown of MYOF compared to controls. (B) Pie chart showing the results of enrichment analyses of biological processes. (C) Pie chart showing the results of enrichment analyses of molecular function. (D) Levels of malondialdehyde (MDA), cellular oxidation (%) and glutathione (GSH) in control and MYOF knockout Panc02 cells. (E) Ratio of GSH/GSSG in Control and MYOF knockout PAAD cells. (F) The confocal laser scanning microscopy images of C11-BODIPY581/591-stained Panc02 cells after treatment with different formulations. Scale bar = 50 μm ∗p < 0.05, ∗∗p < 0.01, ∗∗∗p < 0.001, ∗∗∗∗p < 0.001.
Fig. S4
Fig. S4
(A) The mRNA and protein expression of LCN2 were detected in shCtrl and shLCN2 groups by PCR analysis and western blotting. (B) Measurement of cell proliferative capacity by MTS method (C) The colony formation assay. Left panel: Quantitative analysis of plate clones. Data from independent experiments are presented as the mean ± SD (n = 5). (D) Transwell migration assays were performed to assess migration ability of LCN2-knockdown stable cell lines. (E) Cell cycle changes were demonstrated by flow cytometry in both cell lines following the knockdown of LCN. (F) Transmission electron microscopy images. (G) Levels of malondialdehyde (MDA), Cellular oxidation (%), glutathione (GSH) and Ratio of GSH/GSSG in control and LCN2 knockdown PDAC cells. n = 3. (H, I) The confocal laser scanning microscopy images of C11-BODIPY581/591-stained SW1990 and PANC-1 cells after treatment with different formulations. Scale bar = 50 μm. (J) Western blot analysis of LCN2 overexpression in the Panc02 cell line with stable knockdown of MYOF. (K) The colony formation assay. Left panel: representative images, right panel: quantification analysis. (M) The MTS proliferation assay. (N) Cell cycle assay. (O-Q) The confocal laser scanning microscopy images of C11-BODIPY581/591-stained SW1990, PANC-1, and Panc02 cells after treatment with different formulations. Scale bar = 50 μm. (R, S) Images of subcutaneous xenografts from C57BL/6 mice. n = 5; Tumor volume growth curves and tumor weight change for subcutaneous xenografts. ∗p < 0.05, ∗∗p < 0.01, ∗∗∗p < 0.001, ∗∗∗∗p < 0.0001.
Fig. S4
Fig. S4
(A) The mRNA and protein expression of LCN2 were detected in shCtrl and shLCN2 groups by PCR analysis and western blotting. (B) Measurement of cell proliferative capacity by MTS method (C) The colony formation assay. Left panel: Quantitative analysis of plate clones. Data from independent experiments are presented as the mean ± SD (n = 5). (D) Transwell migration assays were performed to assess migration ability of LCN2-knockdown stable cell lines. (E) Cell cycle changes were demonstrated by flow cytometry in both cell lines following the knockdown of LCN. (F) Transmission electron microscopy images. (G) Levels of malondialdehyde (MDA), Cellular oxidation (%), glutathione (GSH) and Ratio of GSH/GSSG in control and LCN2 knockdown PDAC cells. n = 3. (H, I) The confocal laser scanning microscopy images of C11-BODIPY581/591-stained SW1990 and PANC-1 cells after treatment with different formulations. Scale bar = 50 μm. (J) Western blot analysis of LCN2 overexpression in the Panc02 cell line with stable knockdown of MYOF. (K) The colony formation assay. Left panel: representative images, right panel: quantification analysis. (M) The MTS proliferation assay. (N) Cell cycle assay. (O-Q) The confocal laser scanning microscopy images of C11-BODIPY581/591-stained SW1990, PANC-1, and Panc02 cells after treatment with different formulations. Scale bar = 50 μm. (R, S) Images of subcutaneous xenografts from C57BL/6 mice. n = 5; Tumor volume growth curves and tumor weight change for subcutaneous xenografts. ∗p < 0.05, ∗∗p < 0.01, ∗∗∗p < 0.001, ∗∗∗∗p < 0.0001.
Fig. S5
Fig. S5
(A) RT-PCR results of LCN2 changes over time in MYOF and control Panc02 cells knocked down by actinomycin D treatment (10 μg/mL). (B) LCN2 mRNA-binding protein display map; (C) The GEPIA website predicts correlation coefficients for LCN2 and ILF3; (D, E) WB and qPCR verified the transcription and translation levels of ILF3 after MYOF knockout in the Panc02 cells. (F) The IHC staining of ILF3 in xenografted tumors. ∗p < 0.05, ∗∗p < 0.01, ∗∗∗p < 0.001, ∗∗∗∗p < 0.0001.
Fig. S6
Fig. S6
(A) Degradation of ILF3 protein was detected in PDAC cells after treatment of CHX at the indicated time points; (B) Western blot analysis of ILF3 expression after 6h treatment with 10 μM MG132 (C) The 3D spatial structures of MYOF, OTUB1 and ILF3 were obtained from the Alphafold database; (D) The interfacial areas and free energies of the predicted complexes were analyzed and shown. A larger interfacial area means that the proteins bind to each other more easily. Higher absolute values of free energy mean that the proteins are more capable of binding. (E) “Eyelash figure” of protein-protein interactions, the protein docking regions between MYOF, OTUB1 and ILF3 were shown.
Fig. S7
Fig. S7
(A) Transmission electron microscope image. (B) Levels of malondialdehyde (MDA), cellular oxidation (%) glutathione (GSH) and Ratio of GSH/GSSG in PDAC cells of control group and drug treatment group. (C, D) The confocal laser scanning microscopy images of C11-BODIPY581/591-stained SW1990 and PANC-1 cells after treatment with different formulations. Scale bar = 50 μm∗p < 0.05, ∗∗p < 0.01, ∗∗∗p < 0.001, ∗∗∗∗p < 0.0001.

Similar articles

References

    1. Sung H., et al. Global cancer statistics 2020: GLOBOCAN estimates of incidence and mortality worldwide for 36 cancers in 185 countries. CA Cancer J. Clin. 2021;71:209–249. - PubMed
    1. Wood L.D., Canto M.I., Jaffee E.M., Simeone D.M. Pancreatic cancer: pathogenesis, screening, diagnosis, and treatment. Gastroenterology. 2022;163:386–402. e381. - PMC - PubMed
    1. Cai J., et al. Advances in the epidemiology of pancreatic cancer: trends, risk factors, screening, and prognosis. Cancer Lett. 2021;520:1–11. - PubMed
    1. Midha S., Chawla S., Garg P.K. Modifiable and non-modifiable risk factors for pancreatic cancer: a review. Cancer Lett. 2016;381:269–277. - PubMed
    1. Klein A.P. Pancreatic cancer epidemiology: understanding the role of lifestyle and inherited risk factors. Nat. Rev. Gastroenterol. Hepatol. 2021;18:493–502. - PMC - PubMed