

Assessment of changes in synaptic density in the zQ175DN mouse model of Huntington's disease: a [18F]SynVesT-1 study
- PMID: 40381377
- PMCID: PMC12143836
- DOI: 10.1016/j.nicl.2025.103800
Assessment of changes in synaptic density in the zQ175DN mouse model of Huntington's disease: a [18F]SynVesT-1 study
Abstract
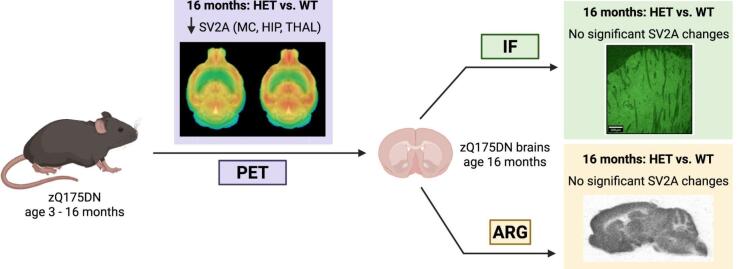
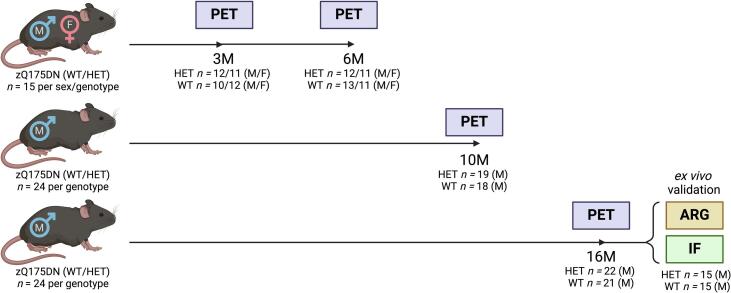
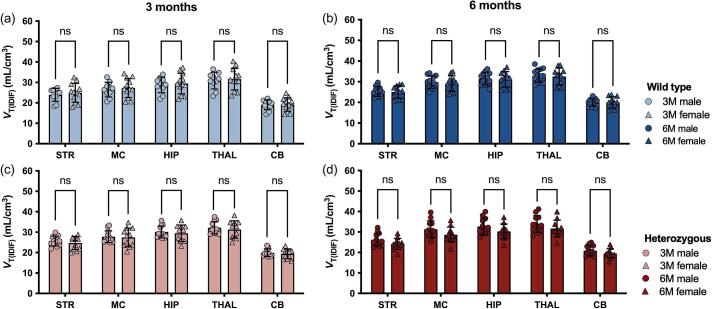
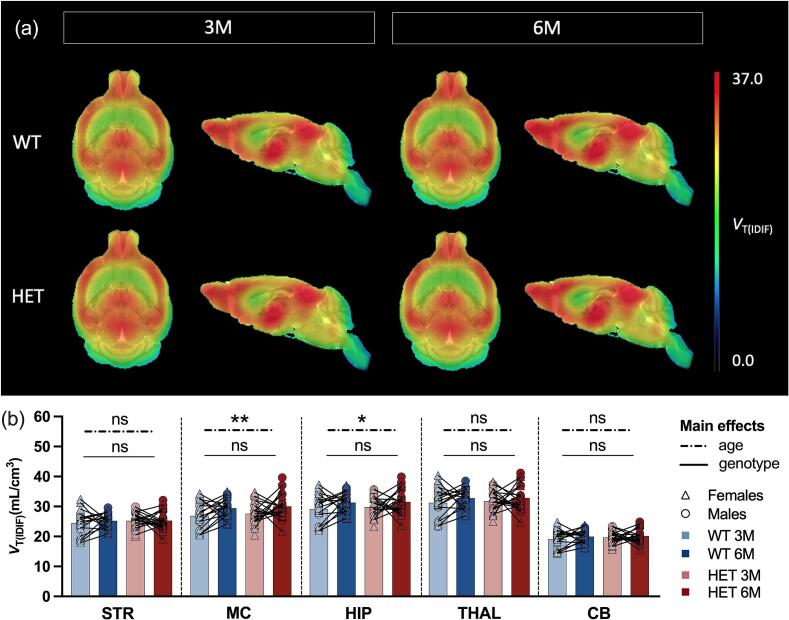
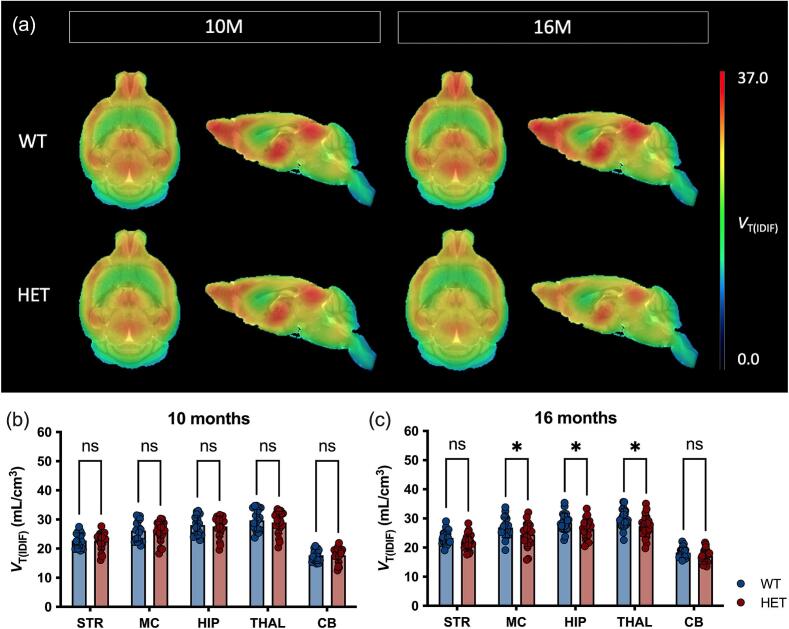
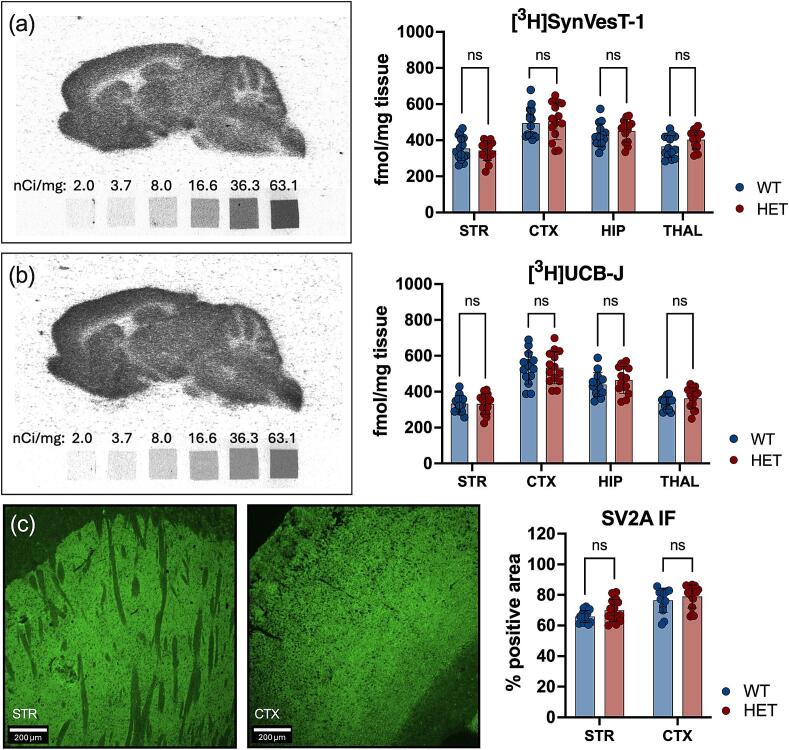
Huntington's disease (HD) is a neurodegenerative disorder characterized by involuntary movements, cognitive decline and psychiatric problems. HD has been associated with synaptic dysfunction and loss of the synaptic vesicle protein 2A (SV2A). SV2A can readily be quantified via positron emission tomography (PET) using the selective and high affinity SV2A radiotracer [18F]SynVesT-1 that we previously characterized in C57BL/6J mice. Here, we performed dynamic [18F]SynVesT-1 PET to characterize SV2A levels at various disease stages in another HD mouse model, zQ175DN, at 3 and 6 months (M) (longitudinal) and 10 M and 16 M (cross-sectional). We also conducted ex vivo SV2A immunofluorescent staining and [3H]UCB-J and [3H]SynVesT-1 autoradiography at 16 M. Dynamic [18F]SynVesT-1 PET revealed comparable VT(IDIF) values between male and female 3 M and 6 M old zQ175DN mice. A significant age effect was found in the motor cortex and hippocampus between 3 M and 6 M. From 3 M to 10 M, no significant difference was found between heterozygous and wild-type mice. At 16 M, however, significant VT(IDIF) differences were observed between genotypes in the motor cortex (-9.1 ± 3.5 %, p = 0.038), hippocampus (-7.5 ± 3.3, p = 0.036) and thalamus (-8.9 ± 3.1 %, p = 0.016). Ex vivo analyses did not confirm the observed deficits at 16 M, likely due to the decreased sensitivity compared to PET. However, [3H]SynVesT-1 and [3H]UCB-J autoradiography displayed the same outcome, ruling out a radioligand-specific effect. [18F]SynVesT-1 PET identified mild SV2A deficits in the zQ175DN model of HD at 16 M, whereas no significant SV2A deficits were detected at younger ages.
Keywords: Huntington’s disease; Mouse model; Positron emission tomography; Synapse; Synaptic density; Synaptic vesicle protein 2A.
Copyright © 2025 The Authors. Published by Elsevier Inc. All rights reserved.
Conflict of interest statement
Declaration of competing interest The authors declare the following financial interests/personal relationships which may be considered as potential competing interests: Longbin Liu reports financial support was provided by CHDI Foundation Inc Princeton. Jonathan Bard reports financial support was provided by CHDI Foundation Inc Princeton. If there are other authors, they declare that they have no known competing financial interests or personal relationships that could have appeared to influence the work reported in this paper.
Figures
Similar articles
-
Synaptic Vesicle Glycoprotein 2A Is Affected in the Central Nervous System of Mice with Huntington Disease and in the Brain of a Human with Huntington Disease Postmortem.J Nucl Med. 2022 Jun;63(6):942-947. doi: 10.2967/jnumed.121.262709. Epub 2021 Sep 16. J Nucl Med. 2022. PMID: 34531262 Free PMC article.
-
Assessing non-invasive quantitative methods for [18F]SynVesT-1 PET imaging of synaptic vesicle glycoprotein 2A in the rat brain.Eur J Nucl Med Mol Imaging. 2025 Jul;52(9):3433-3443. doi: 10.1007/s00259-025-07170-w. Epub 2025 Mar 4. Eur J Nucl Med Mol Imaging. 2025. PMID: 40032689 Free PMC article.
-
Preclinical In Vitro and In Vivo Characterization of Synaptic Vesicle 2A-Targeting Compounds Amenable to F-18 Labeling as Potential PET Radioligands for Imaging of Synapse Integrity.Mol Imaging Biol. 2020 Aug;22(4):832-841. doi: 10.1007/s11307-019-01428-0. Mol Imaging Biol. 2020. PMID: 31728839
-
Imaging of Synaptic Density in Neurodegenerative Disorders.J Nucl Med. 2022 Jun;63(Suppl 1):60S-67S. doi: 10.2967/jnumed.121.263201. J Nucl Med. 2022. PMID: 35649655 Review.
-
PET imaging of synaptic density: A new tool for investigation of neuropsychiatric diseases.Neurosci Lett. 2019 Jan 19;691:44-50. doi: 10.1016/j.neulet.2018.07.038. Epub 2018 Jul 31. Neurosci Lett. 2019. PMID: 30075287 Free PMC article. Review.
References
-
- Glass M., Dragunow M., Faull R.L. The pattern of neurodegeneration in Huntington's disease: a comparative study of cannabinoid, dopamine, adenosine and GABA(A) receptor alterations in the human basal ganglia in Huntington's disease. Neurosci. 2000;97:505–519. doi: 10.1016/s0306-4522(00)00008-7. - DOI - PubMed
MeSH terms
Substances
LinkOut - more resources
Full Text Sources
Medical
