. 2025 Jun;66(6):100825.
doi: 10.1016/j.jlr.2025.100825. Epub 2025 May 15.

Glucosylated cholesterol accumulates in atherosclerotic lesions and impacts macrophage immune response

Affiliations

Glucosylated cholesterol accumulates in atherosclerotic lesions and impacts macrophage immune response

André R A Marques et al. J Lipid Res. 2025 Jun.

Abstract

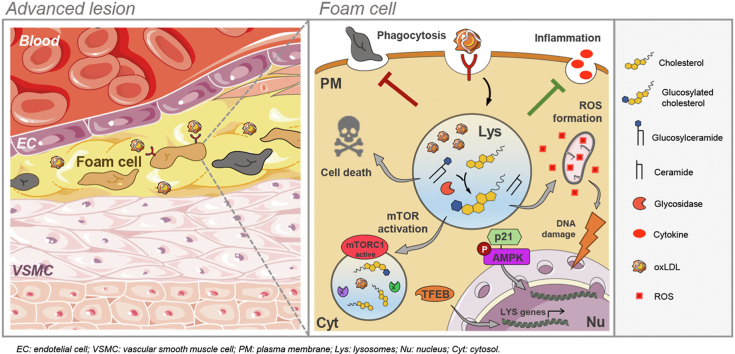
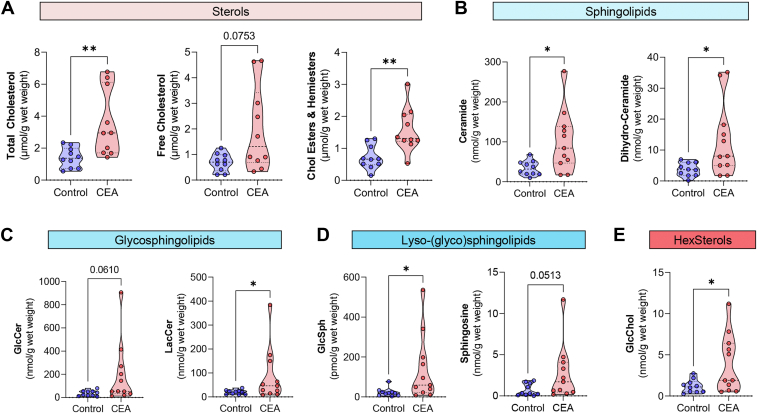
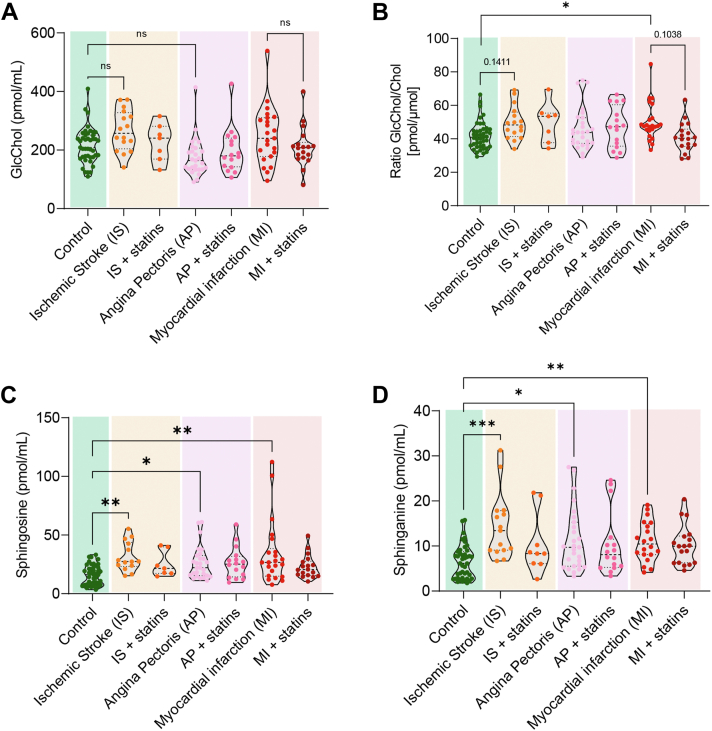
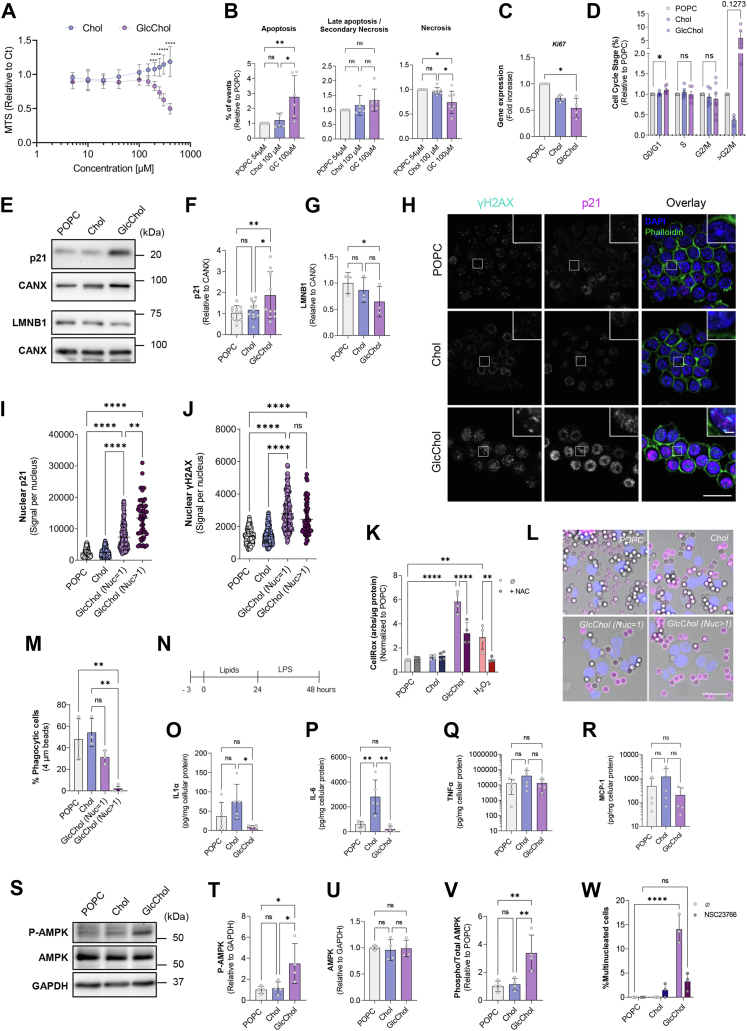
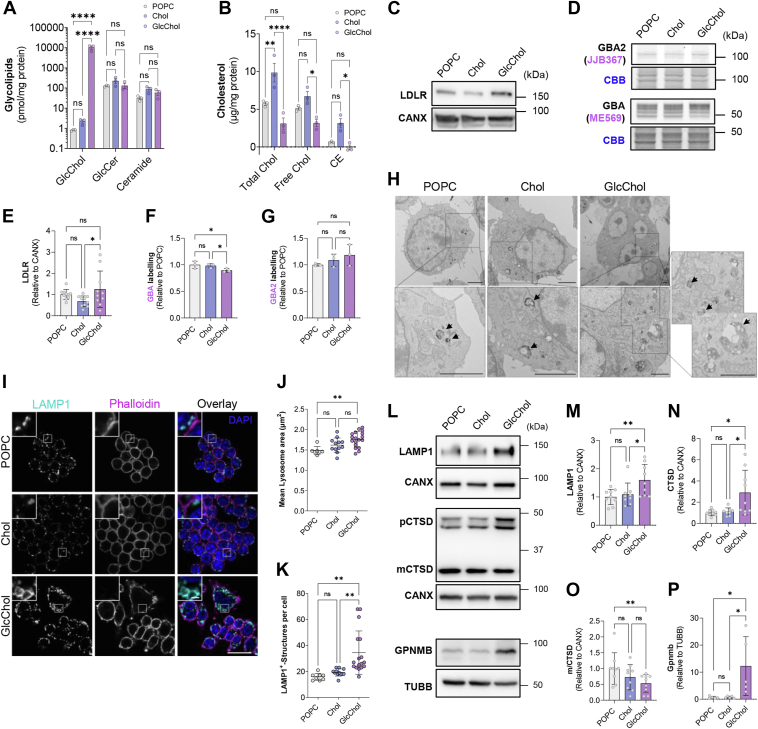
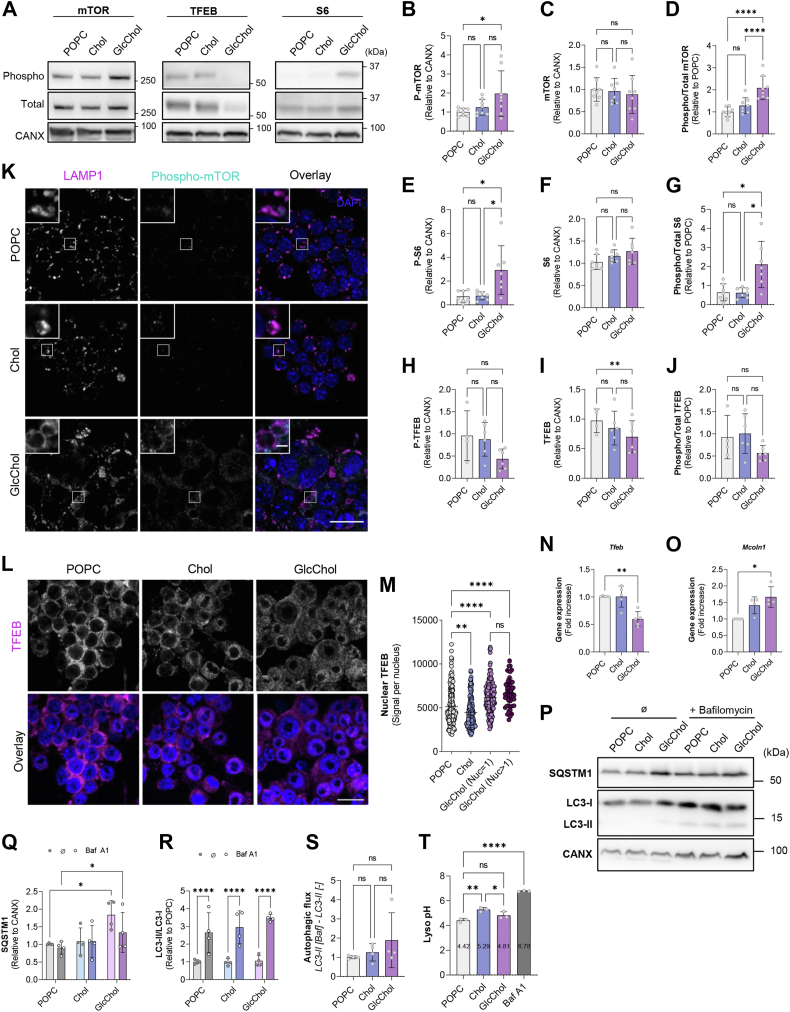
Atherosclerosis can be described as a local acquired lysosomal storage disorder (LSD), resulting from the build-up of undegraded material in lysosomes. Atherosclerotic foam cells accumulate cholesterol (Chol) and glycosphingolipids (GSLs) within lysosomes. This constitutes the ideal milieu for the formation of a side product of lysosomal storage: glucosylated cholesterol (GlcChol), previously found in several LSDs. Using LC-MS/MS, we demonstrated that GlcChol is abundant in atherosclerotic lesions. Patients suffering from cardiovascular diseases presented unaltered plasma GlcChol levels but slightly elevated GlcChol/Chol ratios. Furthermore, we mimicked GlcChol formation in vitro by exposing macrophages (Mφ) to a pro-atherogenic oxidized cholesteryl ester, an atherosclerosis foam cell model. Additionally, Mφ exposed to GlcChol exhibited an enlarged and multinucleated phenotype. These Mφ present signs of decreased proliferation and reduced pro-inflammatory capacity. Mechanistically, the process seems to be associated with activating the AMPK signaling pathway and the cyclin-dependent kinase inhibitor 1 (CDKN1A/p21), in response to DNA damage inflicted by reactive oxygen species (ROS). At the organelle level, exposure to GlcChol impacted the lysosomal compartment, resulting in the activation of the mTOR signaling pathway and lysosomal biogenesis mediated by the transcription factor EB (TFEB). This suggests that high concentrations of GlcChol impact cellular homeostasis. In contrast, under this threshold, GlcChol formation most likely represents a relatively innocuous compensatory mechanism to cope with Chol and GSL build-up within lesions. Our findings demonstrate that glycosidase-mediated lipid modifications may play a role in the etiology of genetic and acquired LSDs, warranting further investigation.

Keywords: glucosylated cholesterol; glycosphingolipids; lysosome; macrophage; multinucleated cells.


Conflict of interest statement

Conflict of interests The authors declare that they have no conflicts of interest with the contents of this article.

Figures

None
Graphical abstract
Fig. 1
Fig. 1
Glycosphingolipids and glucosylated-cholesterol accumulate in the core of human atherosclerotic lesions. Lipid levels in human CEA specimens and control (surrounding) tissue determined by LC-MS/MS or fluorescent enzymatic assay (cholesterol). A: Levels of total cholesterol, free cholesterol, and cholesteryl esters and hemiesters (indistinguishable with this technique) (micromole per gram of wet weight). B: Levels of the sphingolipids ceramide and dihydro-ceramide (nanomole per gram of wet weight) in human CEA samples. C: Levels of the glycosphingolipids glucosylceramide (GlcCer) and lactosylceramide (LacCer) in CAE samples (nanomole per gram of wet weight). D: Lyso-glycosphingolipid glucosylsphingosine (GlcSph, picomole per gram of wet weight) and sphingosine (nanomole per gram of wet weight) in CEA samples. (E) Hexosylated sterol (HexSterol) – glucosylated-cholesterol levels (GlcChol, nanomole per gram of wet weight), confirmed by HILIC chromatography. Data = violin blot of 6–11 samples. The P values were obtained by Mann-Whitney test; ∗∗P < 0.01; ∗P < 0.05.
Fig. 2
Fig. 2
The ratio glucosylated/total cholesterol is increased in the plasma of patients that suffered myocardial infarction. A: GlcChol (picomole per millilitre) levels, B: glucosylated/total cholesterol ratio (picomole per micromole), C: sphingosine, and D: sphinganine levels (picomole per millilitre) in the plasma of patients that suffered from ischemic stroke, angina pectoris and myocardial infarction, and healthy age- and gender-matched individuals (N = 22–40). Patients were divided according to the prescription or not of statins at the date of sample collection. Data mean ± SD analyzed by Kruskal-Wallis followed by Dunn’s multiple comparison test; ns = nonsignificant; ∗P < 0.05, ∗∗P < 0.01, ∗∗∗P < 0.001.
Fig. 3
Fig. 3
Macrophages exposed to cholesteryl hemiazelate (foam cell model) accumulate GlcChol. A: Fluorometric quantification of total cholesterol (microgram per milligram of protein) in lysates of macrophages exposed for 72 h to 807 μM POPC (vehicle) or 1500 μM cholesteryl hemiazelate (ChA). The results are mean ± SD of 6 independent experiments. The P values were obtained by unpaired t test; ∗∗∗∗P < 0.0001. B: Levels of GlcChol determined by LC-MS/MS (picomole per milligram of protein) in lysates of RAW 264.7 cells exposed to ChA or POPC for 72 h. The results are mean ± SD of 6 independent experiments. The P values were obtained by unpaired t test; ∗∗P < 0.01. C: Fluorescent labeling and quantification of active GBA with the ABP ME569 (D) and GBA2 with the ABP JJB367 (E) in lysates of cells exposed to POPC or ChA for 72 h. Gels were stained with Coomassie Brilliant Blue (CBB) as loading control. Data = mean ± SD of 3 independent experiments, ∗P < 0.05 (unpaired t test). Immunoblot (C) and densiometric quantification of the protein levels of gpNMB (F) in lysates of cells treated with POPC (vehicle) or ChA for 72 h. Protein levels were normalized to tubulin (TUBB) levels. Data = mean ± SD of 4 independent experiments; ns = nonsignificant; ∗P < 0.05 (unpaired t test). G: Schematic of the cellular metabolism of GlcChol. Under physiological conditions the glucosidase GBA2 localized in the ER/Golgi catalyzes the formation of GlcChol using free cholesterol (Chol) and the glucose from glucosylceramide (GlcCer) as substrates. GlcCer is also formed in the Golgi. Under these conditions GlcChol is degraded in the lysosome through the action of the glucosidase GBA, yielding free Chol and glucose. Cholesteryl esters and hemiesters are degraded in the lysosome by the lysosomal acid lipase (LAL), causing the release of free Chol, which may in turn be used for the synthesis of GlcChol taking place in the lysosome under conditions of local Chol accumulation. Heatmaps representing GlcChol levels (picomole per milligram of protein) (H), total Chol levels (microgram per milligram of protein) (I), GBA activity (relative to POPC) (J) and GBA2 activity (relative to POPC) (K) in RAW 264.7 cells exposed to POPC or ChA for 72 h in simultaneous with CBE (GBA inhibitor), MZ21 (GBA2 inhibitor), cyclodextrin (CD) (lysosomal cholesterol exporter), Eliglustat (GCS inhibitor) or Lalistat2 (LAL inhibitor). Data = mean ± SD of 3–12 independent experiments, ∗P < 0.05, ∗∗P < 0.01, ∗∗∗P < 0.001, ∗∗∗∗P < 0.0001 (ANOVA-Tukey test relative to control POPC).
Fig. 4
Fig. 4
GlcChol impairs the proliferation and inflammatory response of Mϕ. A: Effect of GlcChol:POPC liposomes on RAW 264.7 cell viability. Chol:POPC liposomes were used for comparison. Mϕ were incubated with liposomes for 72 h and cell viability was evaluated with the MTS assay. The results are presented as mean ± SD of 6 independent experiments. The P values were obtained by two-way ANOVA-Šidák test; ∗∗P < 0.01; ∗∗∗∗P < 0.0001. B: Percentage of apoptotic cells (annexin V positive) after 72 h of treatment (Chol:POPC or GlcChol:POPC) normalized to POPC-vehicle control. Results represent the mean ± SD of 6 independent experiments. More than 10k cells were analyzed per experiment. C: mRNA expression levels of Ki67 in RAW 264.7 cells exposed to POPC (54 μM), Chol (100 μM) and GlcChol (100 μM) for 72 h. mRNA levels were assessed by qRT-PCR. Data were normalized to the endogenous Gapdh and Pgk1 genes. The values are mean ± SD of 4 independent experiments. The P values were obtained paired t test; ∗P < 0.05. D: Flow cytometric analysis of DNA cell cycle after propidium iodide (PI) staining in RAW 264.7 cells after treatment with liposomes for 72 h. Data represents the percentage of cells on a given cell cycle stage. The values are mean ± SD of 4–6 independent experiments. The P values were obtained paired t test; ∗P < 0.05. Immunoblots (E) and densiometric quantification of the protein levels of p21 (CIP1/WAF1) (F) and Lamin B1 (LMNB1) (G) in lysates of cells treated with POPC, Chol or GlcChol for 72 h. Data = mean ± SD of 3–10 independent experiments; ∗P < 0.05; ∗∗P < 0.01 (two-way ANOVA-Tukey test). H: Representative images of γH2AX and p21 in RAW 264.7 Mϕ incubated with 100 μM GlcChol or with control liposomes for 72 h. Nuclei were labeled with DAPI and F-actin with Phalloidin 488. Confocal single-slice images. The insets are enlargements of the areas outlined with the white boxes. Scale bars, 10 and 2 μm in the insets. Quantification of γH2AX (I) and p21 (J) nuclear signal intensity in RAW 264.7 cells exposed to POPC, Chol and GlcChol for 72 h. The results are mean ± SD of 3 independent experiments. At least, 15 cells were analyzed per experiment. The P values were obtained by Kruskal-Wallis with Tukey post test; ∗∗P < 0.01; ∗∗∗∗P < 0.0001. K: Levels of ROS in RAW cells exposed to the different liposomes assessed by fluorometric assay with the CellRox probe in a 96 well format. H2O2 and N-acetylcysteine (NAC) were used as positive and negative controls, respectively. Data = mean ± SD of 3–4 independent experiments; ∗P < 0.05; ∗∗P < 0.01 (Two-way ANOVA-Tukey test). L: Representative images of RAW 264.7 Mϕ exposed to the liposomes (POPC, Chol, or GlcChol) for 72 h and then fed with IgG-opsonized beads for 30 min. Nuclei were stained with DAPI (blue) and non-internalized beads stained with an anti-human IgG antibody (magenta). Confocal single-slice and bright field images are overlayed. Scale bar, 10 μm. M: Quantification of the percentage of cells that present at least one IgG-opsonized particle. The values are means ± SD of 3 independent experiments. 15 cells were analyzed per condition. ANOVA-Tukey test; ∗∗P < 0.01. N: Experimental set-up for cytokine assessment. Three hours after seeding the cells were exposed to liposomes (POPC, Chol e GlcChol) for 24 h. The media was then replaced by fresh media with 100 ng/ml LPS for an additional 24 h. Cytokine IL-1α (O), IL-6 (P), TNF-α (Q), and chemokine MCP-1 (R) levels (picogram per milligram of cellular protein) in the media of Mϕ pre-conditioned with liposomes for 24 h and then exposed to LPS (100 ng/ml) for 24 h. Cytokine and chemokine levels were assessed by flow cytometry multiplex assay. Data = mean ± SD of 5 independent experiments; ns = nonsignificant; ∗P < 0.05; ∗∗P < 0.01; (Two-way ANOVA-Tukey test). Immunoblots (S) and densiometric quantification of the protein levels of phosphorylated-AMPK (Thr172) (T), AMPK (U), phosphorylated/total AMPK ratio (V) in lysates of cells treated with POPC, Chol or GlcChol for 72 h. Data = mean ± SD of 4 independent experiments, ∗P < 0.05, ∗∗P < 0.01 (ANOVA-Tukey test). (W) Percentage of polyploid cells after a 72 h treatment with liposomes alone or in combination with 50 μM Rac1 inhibitor NSC23766. Data = mean ± SD of 3–10 independent experiments. At least 50 cells were counted per condition. ∗∗∗∗P < 0.0001 (Two-way ANOVA-Tukey test).
Fig. 5
Fig. 5
GlcChol impacts the late endosome/lysosome compartment. A: Levels of GlcChol, glucosylceramide and ceramide determined by LC-MS/MS (picomole per milligram of protein) in lysates of RAW 264.7 cells exposed POPC, Chol or GlcChol for 72 h. The results are mean ± SD of 3 independent experiments. B: Fluorometric quantification of total Chol, unesterified (free) Chol levels and esterified cholesterol (microgram per milligram of protein) in lysates of Mϕ exposed for 72 h to 54 μM POPC (vehicle), 100 μM Chol or 100 μM GlcChol. The results are mean ± SD of 3 independent experiments. The P values were obtained by two-way ANOVA-Tukey test; ∗P < 0.05; ∗∗P < 0.01; ∗∗∗∗P < 0.0001. Immunoblot (C) and densiometric quantification (E) of LDLR protein levels in lysates of cells treated with POPC, Chol or GlcChol for 72 h. Protein levels were normalized to calnexin (CANX) levels. Data = mean ± SD of 10 independent experiments, ∗P < 0.05 (ANOVA-Tukey test). Fluorescent labeling (D) and quantification of active GBA with the ABP ME569 (F) and GBA2 with the ABP JJB367 (G) in lysates of cells exposed to POPC, Chol or GlcChol for 72 h. Gels were stained with Coomassie Brilliant Blue (CBB) as loading control. Data = mean ± SD of 3 independent experiments, ∗P < 0.05 (ANOVA-Tukey test). H: Transmission electron microscopy of RAW 264.7 cells treated for 72 h with POPC, Chol or GlcChol liposomes. GlcChol-treated cells exhibit larger lysosomes as confirmed by BSA-gold labeling (bottom row). Dark arrows indicate gold-containing endolysosomes. Scale bars: 2 μm in all images. I: Representative images of LAMP1 in RAW 264.7 Mϕ incubated with 100 μM GlcChol, POPC or Chol liposomes for 72 h. Nuclei were labeled with DAPI and F-actin with Phalloidin 633. Confocal single-slice images. The insets are enlargements of the areas outlined with the white boxes. Scale bars: 10 and 2 μm in the insets. Quantification of mean lysosome area (J) and lysosome number of lysosomes (K) (LAMP-1 positive structures) in Mϕ pulsed for 72 h with POPC, Chol or GlcChol. Quantification was performed using a CellProfiler script. The results are mean ± SD of 3 independent experiments. At least 3 fields cells were analyzed per experiment (>10 cells per field). The P values were obtained by ANOVA-Tukey test. ∗∗P < 0.01. Immunoblots (L) and densiometric quantification of the protein levels of LAMP1 (M), CTSD (N), mature/total CTSD ratio (O) and gpNMB (P) in lysates of cells treated with POPC, Chol or GlcChol for 72 h. Protein levels were normalized to calnexin (CANX) or tubulin (TUBB) levels. Data = mean ± SD of 5–9 independent experiments, ∗P < 0.05; ∗∗P < 0.01 (Two-way ANOVA-Tukey test).
Fig. 6
Fig. 6
Exposure to GlcChol activates the mTOR signaling pathway in murine Mϕ. Immunoblots (A) and densiometric quantification of the protein levels of phosphorylated-mTOR (Ser2448) (B), mTOR (C), phosphorylated/total mTOR ratio (D), phospho-S6 Ribosomal Protein (Ser235/236) (E), S6 (F), phosphorylated/total S6 ratio (G), phosphorylated TFEB (Ser211) (H), TFEB (I), phosphorylated/total TFEB ratio (J), in lysates of cells treated with POPC, Chol or GlcChol liposomes for 72 h. Protein levels were normalized to calnexin (CANX) or GAPDH levels. Data = mean ± SD of 6–8 independent experiments, ∗P < 0.05, ∗∗P < 0.01, ∗∗∗∗P < 0.0001 (ANOVA-Tukey test). K: representative images of LAMP1 and phosphorylated-mTOR (Ser2448) in RAW 264.7 Mϕ incubated with 100 μM GlcChol or with control (POPC or Chol) liposomes for 72 h. (L) Representative images of TFEB in GlcChol-treated cells and controls. Nuclei were labeled with DAPI. Confocal single-slice images. The insets are enlargements of the areas outlined with the white boxes. Scale bars, 10 and 2 μm in the insets. (M) Quantification of TFEB nuclear signal intensity in RAW 264.7 (72 h treatment). The results are mean ± SD of 3 independent experiments. At least, 15 cells were analyzed per experiment. The P values were obtained by one-way Kruskal-Wallis with Tukey post-test; ∗∗P < 0.01; ∗∗∗∗P < 0.0001. mRNA expression levels of Tfeb (N) and Mcoln1 (O) genes. mRNA levels were assessed by qRT-PCR. Data were normalized to the endogenous Gapdh and Pgk1 genes. The values are mean ± SD of 5 independent experiments. The P values were obtained by paired t test; ∗P < 0.05; ∗∗P < 0.01. P: immunoblot of LC3B and p62/SQSTM1 in cell lysates of control and GlcChol-treated cells for 72 h, without or with Bafilomycin A1 (Baf A1) treatment (2 h). Q: Quantification of the p62/SQSTM1 levels (normalized to CANX) in cell lysates of POPC, Chol and GlcChol-treated cells at 72 h. R: Quantification of the LC3-II/LC3-I ratio at 72 h (relative to POPC). S: Autophagic flux (calculated as the difference between LC3-II levels in the presence and absence of Baf A1) in RAW cells treated with GlcChol and 72 h (relative to POPC). Data = mean ± SD of 4 independent experiments, ∗∗P < 0.01; ∗P < 0.05 (ANOVA-Tukey test). T: Quantification of lysosomal pH in live cells measured by ratiometric fluorescence. Baf A1 was used as positive control. Three independent experiments were performed and each time 20 lysosomes were analyzed. Error bars represent SD of 3 independent experiments. ∗P < 0.05, ∗∗P < 0.01 (two-way ANOVA-Tukey test).

Similar articles

References

    1. Roth G.A., Abate D., Abate K.H., Abay S.M., Abbafati C., Abbasi N., et al. Global, regional, and national age-sex-specific mortality for 282 causes of death in 195 countries and territories, 1980–2017: a systematic analysis for the Global Burden of Disease Study 2017. Lancet. 2018;392:1736–1788. - PMC - PubMed
    1. Gibson M.S., Domingues N., Vieira O.V. Lipid and non-lipid factors affecting macrophage dysfunction and inflammation in atherosclerosis. Front. Physiol. 2018;9:654. - PMC - PubMed
    1. Alves L.S., Marques A.R.A., Padrão N., Carvalho F.A., Ramalho J., Lopes C.S., et al. Cholesteryl hemiazelate causes lysosome dysfunction impacting vascular smooth muscle cell homeostasis. J. Cell Sci. 2022;135 - PubMed
    1. Domingues N., Gaifem J., Matthiesen R., Saraiva D.P., Bento L., Marques A.R.A., et al. Cholesteryl hemiazelate identified in CVD patients causes in vitro and in vivo inflammation. J. Lipid Res. 2023;64 - PMC - PubMed
    1. Domingues N., Marques A.R.A., Calado R.D.A., Ferreira I.S., Ramos C., Ramalho J., et al. Oxidized cholesteryl ester induces exocytosis of dysfunctional lysosomes in lipidotic macrophages. Traffic. 2023;24:284–307. - PubMed

LinkOut - more resources