

Neoadjuvant with low-dose radiotherapy, tislelizumab, albumin-bound paclitaxel, and cisplatin for resectable locally advanced head and neck squamous cell carcinoma: phase II single-arm trial
- PMID: 40382318
- PMCID: PMC12085655
- DOI: 10.1038/s41467-025-59865-1
Neoadjuvant with low-dose radiotherapy, tislelizumab, albumin-bound paclitaxel, and cisplatin for resectable locally advanced head and neck squamous cell carcinoma: phase II single-arm trial
Abstract
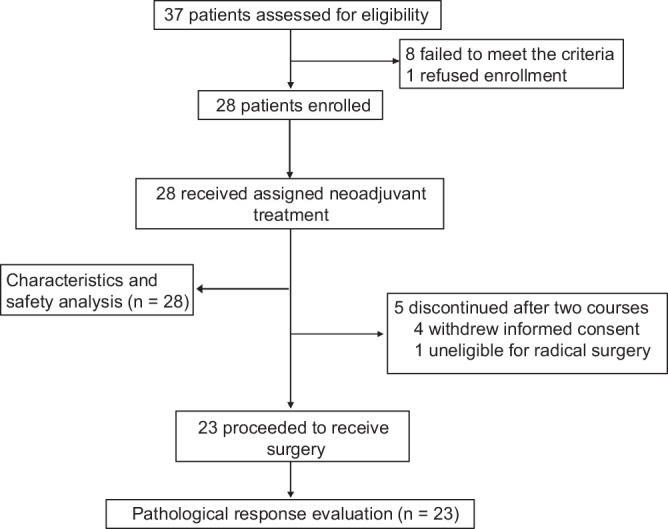
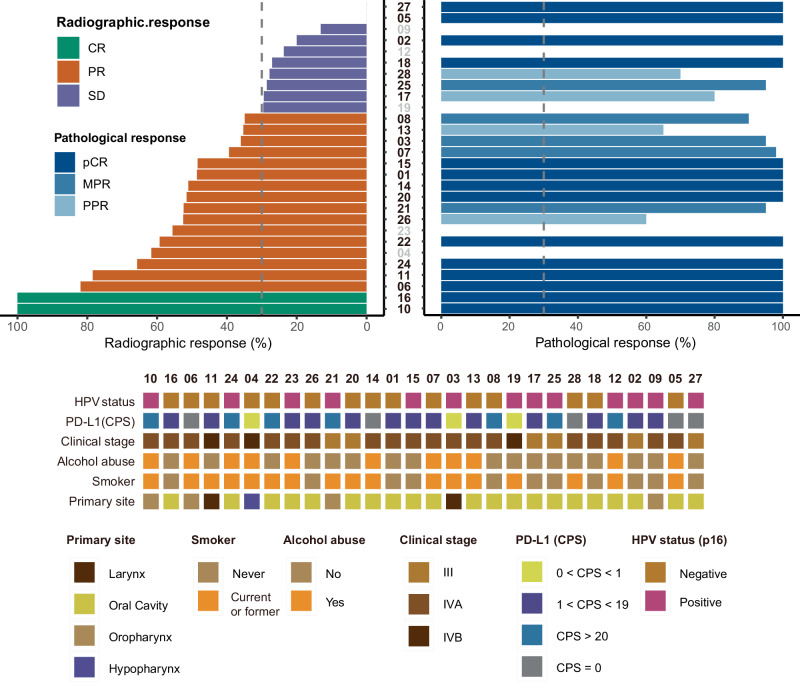
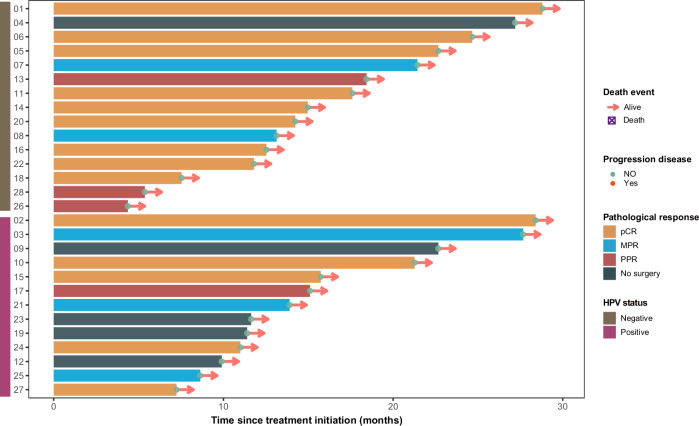
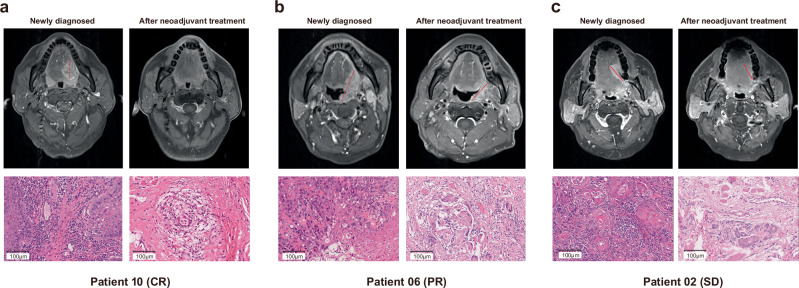
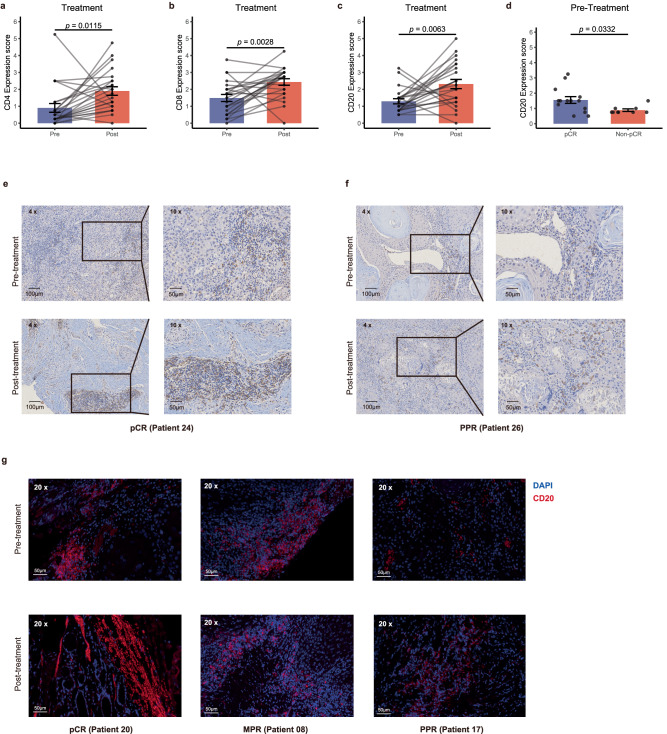
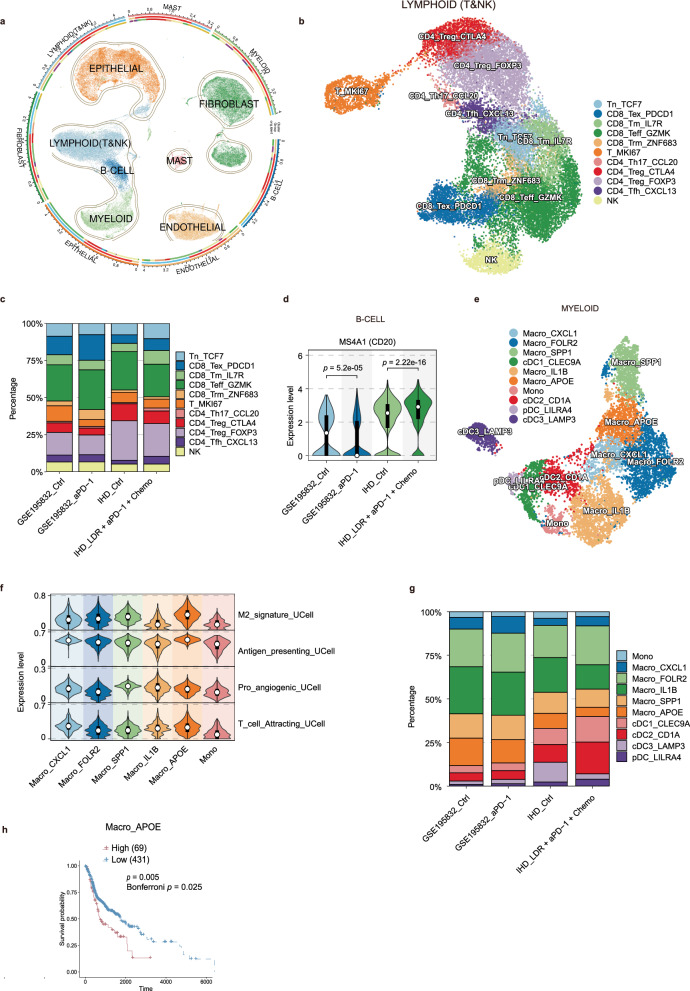
Although pathological complete response (pCR) and major pathological response (MPR) rates of neoadjuvant immunotherapy combined with chemotherapy in head and neck squamous cell carcinoma (HNSCC) trials remain suboptimal, emerging evidence highlights the synergistic potential of combining low-dose radiotherapy with immunotherapy to promote the efficacy of immunotherapy. This phase II, open-label, single-arm, multicenter trial (NCT05343325) enrolled 28 patients with untreated stage III-IVB HNSCC (NeoRTPC02). Patients received neoadjuvant low-dose radiotherapy, the programmed death-1 (PD-1) inhibitor tislelizumab, albumin-bound paclitaxel, and cisplatin for two cycles, followed by radical resection ~4 weeks after treatment completion. The primary endpoint, pCR rate, was achieved in 14 of 23 patients (60.9%; 23/28, 82.1% of the total cohort underwent surgery). Secondary endpoints included MPR rate (21.7%, 5/23), R0 resection rate (100%), and objective response rate (64.3%; 18/28). Treatment-related adverse events were manageable, with grade 3 or 4 treatment-related adverse events occurring in 10 (35.7%) patients. No surgical delays were observed. Single-cell RNA sequencing revealed remodeling of the HNSCC tumor microenvironment, which may correlate with improved clinical outcomes. This trial met the pre-specified primary endpoint, demonstrating a high pCR rate with promising efficacy and manageable toxicity in locally advanced HNSCC.
© 2025. The Author(s).
Conflict of interest statement
Competing interests: The authors declare no competing interests.
Figures
Similar articles
-
Neoadjuvant toripalimab combined with gemcitabine and cisplatin in resectable locally advanced head and neck squamous cell carcinoma (NeoTGP01): An open label, single-arm, phase Ib clinical trial.J Exp Clin Cancer Res. 2022 Oct 12;41(1):300. doi: 10.1186/s13046-022-02510-2. J Exp Clin Cancer Res. 2022. PMID: 36224603 Free PMC article. Clinical Trial.
-
Neoadjuvant chemo-immunotherapy with camrelizumab plus nab-paclitaxel and cisplatin in resectable locally advanced squamous cell carcinoma of the head and neck: a pilot phase II trial.Nat Commun. 2024 Mar 11;15(1):2177. doi: 10.1038/s41467-024-46444-z. Nat Commun. 2024. PMID: 38467604 Free PMC article. Clinical Trial.
-
[Efficacy and safety of programmed death receptor-1 inhibitor combined with albumin-bound paclitaxel and cisplatin in the neoadjuvant treatment of locally advanced head and neck squamous cell carcinoma].Zhonghua Yi Xue Za Zhi. 2025 May 27;105(20):1614-1620. doi: 10.3760/cma.j.cn112137-20241015-02336. Zhonghua Yi Xue Za Zhi. 2025. PMID: 40399126 Chinese.
-
Neoadjuvant Immunotherapy in Resectable HNSCC: An Updated Systematic Review and Meta-analysis.Ann Surg Oncol. 2025 Apr;32(4):2713-2724. doi: 10.1245/s10434-024-16587-w. Epub 2024 Dec 7. Ann Surg Oncol. 2025. PMID: 39645552
-
Neoadjuvant Therapy for Mucosal Head and Neck Squamous Cell Carcinoma: A Review From the American Head and Neck Society.JAMA Otolaryngol Head Neck Surg. 2025 Jun 1;151(6):615-625. doi: 10.1001/jamaoto.2025.0410. JAMA Otolaryngol Head Neck Surg. 2025. PMID: 40272829 Review.
References
-
- Shield, K. D. et al. The global incidence of lip, oral cavity, and pharyngeal cancers by subsite in 2012. CA Cancer J. Clin.67, 51–64 (2017). - PubMed
-
- Burtness, B. et al. Pembrolizumab alone or with chemotherapy versus cetuximab with chemotherapy for recurrent or metastatic squamous cell carcinoma of the head and neck (KEYNOTE-048): a randomised, open-label, phase 3 study. Lancet394, 1915–1928 (2019). - PubMed
Publication types
MeSH terms
Substances
Grants and funding
LinkOut - more resources
Full Text Sources
Medical
Miscellaneous
