. 2025 May 17;16(1):4590.
doi: 10.1038/s41467-025-59849-1.

Targeting C1q prevents microglia-mediated synaptic removal in neuropathic pain

Affiliations

Targeting C1q prevents microglia-mediated synaptic removal in neuropathic pain

Noosha Yousefpour et al. Nat Commun. .

Abstract

Activation of spinal microglia following peripheral nerve injury is a central component of neuropathic pain pathology. While the contributions of microglia-mediated immune and neurotrophic signalling have been well-characterized, the phagocytic and synaptic pruning roles of microglia in neuropathic pain remain less understood. Here, we show that peripheral nerve injury induces microglial engulfment of dorsal horn synapses, leading to a preferential loss of inhibitory synapses and a shift in the balance between inhibitory and excitatory synapse density. This synapse removal is dependent on the microglial complement-mediated synapse pruning pathway, as mice deficient in complement C3 and C4 do not exhibit synapse elimination. Furthermore, pharmacological inhibition of the complement protein C1q prevents dorsal horn inhibitory synapse loss and attenuates neuropathic pain. Therefore, these results demonstrate that the complement pathway promotes persistent pain hypersensitivity via microglia-mediated engulfment of dorsal horn synapses in the spinal cord, revealing C1q as a therapeutic target in neuropathic pain.


Conflict of interest statement

Competing interests: N.Y., V.M., Y.A.Z., N.R.K.A., and T.Y. are employees of Annexon Inc., a venture-funded private biotechnology company. All other authors have no competing interests.

Figures

Fig. 1
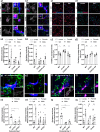
Fig. 1. Nerve injury triggers engulfment of presynaptic terminals by microglia.
a1, b1 Expression of tdTomato fluorescent protein reporter in the dorsal horn of Gad2-tdTom (a1) and Tac1-tdTom (b1) mice to demonstrate the distributions of inhibitory Gad65-expressing and excitatory substance P-expressing neurons, respectively. a2-5-b2-5 Representative 3D reconstructions (a2-3, b2-3) and surface rendering (a4-5, b4-5) of microglia (blue) sampled from dorsal horn (lamina II) to show internalized inhibitory and excitatory neuronal elements (green) within lysosomal compartments (magenta) of ipsilateral microglia. Insets within raw images are single plane enlarged images selected from confocal stacks illustrating the presence of tdTomato fluorescent signals inside lysosomes. Insets within 3D reconstructions are enlarged views of the engulfed volumes from the same regions. a6, b6 Quantifications of temporal changes of engulfment of inhibitory (a6) and excitatory (b6) tdTomato+ neuronal elements by microglia (n = 12 mice per group; 6 mice per sex). c1, d1 Three-dimensional fluorescent images of microglia (blue) sampled from ipsilateral dorsal horn labeled for lysosomal marker CD68 (magenta), marker of presynaptic inhibitory terminals (VGAT; green) (c1) and marker of presynaptic excitatory terminals (VGLUT2; green) (d1). Representative 3D surface-rendered images illustrate the engulfment of presynaptic elements (c2, d2). c3-d3 Quantifications of temporal changes of engulfment of inhibitory (c3) and excitatory (d3) presynaptic terminals by microglia (n = 12 mice per group; 6 mice per sex. Means are plotted with individual data points ± SEM. *p < 0.05, **p < 0.01, ***P < 0.001, and ****P < 0.0001 analyzed with two-way ANOVA followed by Bonferroni post hoc test. Source data are provided as a Source Data file.
Fig. 2
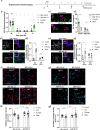
Fig. 2. Transient microglia depletion during the peak of synapse engulfment prevents the normal development of mechanical hypersensitivity and protects dorsal horn synaptic connectivity.
a Diagram showing the timeline of drug treatment, SNI surgery, and behavioral tests. b Dorsal horn images labeled for Iba1 (green) from vehicle and drug (PLX3397) treated groups from the last day of treatment and after a 10-day wash-out period. c Quantification of the number of microglia in dorsal spinal cord (n = 6 mice per group; 3 mice per sex). d Pain behavior in neuropathic mice treated either with PLX3397 or vehicle (n = 16 mice per group; 8 mice per sex). e, f Quantifications of relative engulfment of inhibitory (e) and excitatory (f) terminals at 14 and 21 days-post SNI when microglia repopulate the spinal cord (n = 9 mice per group; 5 male mice and 4 female mice). g Representative SIM images of inhibitory synapses labeled with a pre-synaptic marker (VGAT; red) and a post-synaptic marker (gephyrin; blue) in different conditions. The inset within the first image is an enlarged view of an inhibitory synapse. h Representative SIM images of excitatory synapses labeled with a pre-synaptic marker (VGLUT2; cyan) and a post-synaptic (homer1; magenta) in different conditions. The inset within the first image is an enlarged view of an excitatory synapse. i Quantification of inhibitory synapse density (n = 30 mice per vehicle group; n = 20 mice per PLX3397 group; 10–15 mice per sex). j Quantification of inhibitory synapse density (n = 30 mice per vehicle group; n = 20 mice per PLX3397 group; 10–15 mice per sex). Means are plotted with individual data points ± SEM. *p < 0.05, **p < 0.01, ***p < 0.001 and ****p < 0.0001 analyzed with repeated measures two-way ANOVA with Bonferroni post hoc test (d) and two-way ANOVA with Bonferroni post hoc test (c, e, f, i, j). Source data are provided as a Source Data file.
Fig. 3
Fig. 3. Complement and CX3CR1 mediated synapse pruning proteins are upregulated in neuropathic pain.
a Volcano plot showing gene expression changes in neuropathic mice at day 7 post SNI. Each dot is a gene. Positive fold change indicates higher expression in the spinal cord of SNI-injured mice than in naïve. Genes highlighted in blue are related to complement and CX3CR1 pruning pathways. Dashed horizontal orange line indicates P-value of 0.05. b Drawing illustrates microglia and signaling molecules that participate in complement and CX3CR1 pruning mechanisms. c1-e1 Representative images of C1q, C3, and CR3 labeling in the dorsal horn of SNI mice at day 7 post-SNI. c2-e2 Quantifications of fluorescence intensity of dorsal horn C1q, and C3, as well as number of CR3+ microglia in laminae I-III (n = 8 mice per group; 4 mice per sex). f Temporal expression changes of ipsilateral C1q, C3, and CR3 levels normalized to the contralateral side (n = 5 mice per group; 3 males and 2 females). g1-h1 Representative dorsal horn images of CX3CL1 and CX3CR1 immunolabelling in SNI mice at day 7 post-SNI. g2-h2 Quantifications of fluorescence intensity of dorsal horn CX3CL1, and the number of CX3CR1+ microglia in laminae I-III (n = 8 mice per group; 4 mice per sex). i1 High-resolution image of CX3CR1 (red) expression in microglia (blue) sampled from ipsilateral and contralateral dorsal horn (quantified i2) (n = 8 mice per group; 4 mice per sex). j Temporal expression changes of ipsilateral number of CX3CR1+ microglia and CX3CL1 fluorescence intensity levels normalized to the contralateral side (n = 5 mice per group; 3 males and 2 females). For transcriptomics, false discovery rate (FDR) is used to correct for multiple two-sided t-tests (a). Means are plotted with individual data points ± SEM. **p < 0.01, ***p < 0.001, and ****p < 0.0001 analyzed with paired two-tailed t-test (c2-h2) and unpaired two-tailed t-test (i2). ns, analyzed with two-tailed t-test comparing day 3 and month 5 time points (f, j). Source data are provided as a Source Data file.
Fig. 4
Fig. 4. Nerve injury-induced engulfment of presynaptic terminals is mediated by the complement pathway.
a1 and b1 First column images represent surface rendering 3D microglia reconstructions (white) sampled from ipsilateral dorsal horns of neuropathic wildtype (WT), C3 KOs, and CX3CR1 KOs demonstrating lysosome (magenta) co-localization with VGAT+ inhibitory (a1) and VGLUT2+ excitatory (b1) pre-synaptic markers (green). Second column shows single plane images from confocal stacks illustrating the presence or absence of CD68+ lysosomal co-localization with synapse markers. a2 and b2 Quantifications of engulfment of inhibitory (a2) and excitatory (b2) presynaptic terminals by microglia in different genotypes (i/ = 8 mice per group; 4 mice per sex). c1 and d1 Three-dimensional representative SIM images of inhibitory (c1: VGAT in red and gephyrin in blue) and excitatory (d1: VGLUT2 in cyan and homer1 in magenta) terminals captured from dorsal horns of WT, C3 KO, and CX3CR1 KO neuropathic mice. c2 and d2 Quantifications of dorsal horn inhibitory (c2) and excitatory (d2) synapse densities for neuropathic mice of different genotypes (n = 8 mice per group; 4 mice per sex). e1 and f1 3D fluorescent images of P7 microglia (blue) sampled from ipsilateral dorsal horn labeled for lysosomal marker CD68 (magenta), marker of presynaptic inhibitory terminals (VGAT; green) (c1) and marker of presynaptic excitatory terminals (VGLUT2; green) (f1). e2 and f2 are single plane enlarged images from confocal stacks illustrating the presence of synaptic signal inside lysosomes. Insets within raw images are surface rendered microglia illustrating engulfment of presynaptic terminals. e3 and f3 Quantifications of engulfment of inhibitory (c3) and excitatory (f3) presynaptic terminals by P7 microglia in WT, C4, C3 KOs (n = 5 mice per group; 3 mice per sex). e4 and f4 Quantifications of engulfment of inhibitory (e4) and excitatory (f4) presynaptic terminals by microglia in different genotypes (n = 8 mice per group; 4 mice per sex). Means plotted with individual data points ± SEM. *p < 0.05, **p < 0.01, ***P < 0.001, and ****P < 0.0001 analyzed with two-way ANOVA followed by Bonferroni post hoc test. Source data are provided as a Source Data file.
Fig. 5
Fig. 5. Complement protein C1q is expressed by nerve injury-activated microglia and localized to dorsal horn synapses.
a1 RNA scope for C1qa (a1: green) in contralateral and ipsilateral dorsal horn cells (quantified in a3) (n = 5 mice per group; 3 males and 2 females). Absence of C1qa (a2: red) expression in inhibitory and excitatory neurons (blue) (quantified in a4) (n = 5 mice per group; 4 males and 2 females). b1 Representative high-magnification confocal image of C1q protein (green) in microglia (blue) (quantified in b2) (n = 6 mice per group; 3 mice per sex). Representative SIM images (c1-2) captured from ipsilateral dorsal horn at 7 days post-SNI showing the co-localization of C1q (green) with inhibitory (VGAT in red), and excitatory synapses (VGLUT2 in blue). Dotted circles show synapses that are colocalized with C1q. c3 Quantifications of C1q co-localization with inhibitory and excitatory synapses (n = 10 mice per group; 5 mice per sex). d1-2 Depletion of C1q expression in the dorsal horn of neuropathic mice chronically treated with vehicle and PLX3397 (quantified in d3) (n = 6 mice per group; 3 mice per sex). d4 Quantifications of C1q co-localization with inhibitory and excitatory synapses in vehicle and PLX3397 treated mice (n = 3 male mice per group). Means are plotted with individual data points ± SEM. ***p < 0.001, and ****p < 0.0001 analyzed by two-way ANOVA with Bonferroni post hoc test (a3, c3, and d3-4) and unpaired two-tailed t-test (a4 and b2). Source data are provided as a Source Data file.
Fig. 6
Fig. 6. Functional blocking of C1q interferes with the establishment of mechanical allodynia, protects dorsal horn synaptic circuitry, reduces synapse pruning, and prevents dorsal hornsynapse loss.
a A diagram showing the timeline of drug treatments, surgery, and behavior testing. b Pain behaviour in neuropathic mice treated either with ANX-M1.21 or IgG control (n = 20 mice per group; 12 males and 8 females). c1 Representative images from ipsilateral dorsal horn show the co-localization of C1q (green) with inhibitory synapses (VGAT; red), and excitatory (VGLUT2; blue) in different experimental groups (Quantified in c2) (n = 6 mice per group; 3 mice per sex). d1 and e1 Representative 3D surface rendering of microglia (white) from ipsilateral dorsal horn of IgG control and ANX-M1.21 treated mice. A single plane enlarged image selected from the confocal stack illustrating the CD68 (magenta) co-localization with VGAT or VGLUT2 (d1, e1: green). Insets within 3D reconstructions are enlarged views of VGAT (d1) or VGLUT2 (e1) co-localization with CD68 (quantified in d2 and e2) (n = 10 mice per group; 5 mice per sex). f1 Representative images of inhibitory presynaptic (VGAT; red) and postsynaptic (gephyrin; blue) elements from different conditions and quantification in f2 (n = 20 mice per group; 12 males and 8 females). g1 Representative images of excitatory pre-synaptic (VGLUT2; cyan) and post-synaptic (homer1; magenta) elements from different conditions and quantification in g2 (n = 20 mice per group; 12 males and 8 females). Means are plotted with individual data points ± SEM. *p < 0.05, **p < 0.01, and ****p < 0.0001 analyzed with repeated measures two-way ANOVA with Bonferroni post hoc test (b) two-way ANOVA with Bonferroni post hoc test (d2, e2, f2, and g2), and t-test (c2). Source data are provided as a Source Data file.

References

    1. Costigan, M., Scholz, J. & Woolf, C. J. Neuropathic pain: a maladaptive response of the nervous system to damage. Annu Rev. Neurosci.32, 1–32 (2009). - PMC - PubMed
    1. Baron, R., Binder, A. & Wasner, G. Neuropathic pain: diagnosis, pathophysiological mechanisms, and treatment. Lancet Neurol.9, 807–819 (2010). - PubMed
    1. Inoue, K. & Tsuda, M. Microglia in neuropathic pain: cellular and molecular mechanisms and therapeutic potential. Nat. Rev. Neurosci.19, 138–152 (2018). - PubMed
    1. Chen, G., Zhang, Y.-Q., Qadri, Y. J., Serhan, C. N. & Ji, R.-R. Microglia in pain: detrimental and protective roles in pathogenesis and resolution of pain. Neuron100, 1292–1311 (2018). - PMC - PubMed
    1. Gilmore, S. A. & Skinner, R. D. Intraspinal non-neuronal cellular responses to peripheral nerve injury. Anat. Rec.194, 369–387 (1979). - PubMed

MeSH terms

LinkOut - more resources