. 2025 May 17;16(1):4611.
doi: 10.1038/s41467-025-59758-3.

A global atlas and drivers of antimicrobial resistance in Salmonella during 1900-2023

Affiliations

A global atlas and drivers of antimicrobial resistance in Salmonella during 1900-2023

Yanan Wang et al. Nat Commun. .

Abstract

Although previous studies using phenotypic or/and genomic approaches monitoring have revealed the spatiotemporal distribution of antimicrobial resistance (AMR) in Salmonella in local areas, their geographical patterns and driving factors remain largely unknown at a global scale. Here, we performed an analysis of publicly available data of 208,233 Salmonella genomes in 148 countries/regions between 1900 and 2023 and explored driving indicators of AMR. Overall, we found that the geographic distribution of AMR varied depending on the location, source, and serovar. The proportion of AMR levels increased across six continents, especially in serovars Agona, Dublin, I 1,4,[5],12:i:-, Muenchen, Senftenberg, Mbandaka mainly from chickens, food, wild animals, and the environment, while decreased in Schwarzengrund and Saintpaul mainly from cattle, pigs, and turkeys. We also found that S. Typhimurium exhibiting macro, red, dry, and rough was detected as early as 1992 in the USA, earlier than in China. Moreover, we identified that antibiotic consumption, agriculture, climate, urban, health, and socioeconomic factors contribute to the development of AMR in Salmonella. We present a globally high-resolution genetic atlas of Salmonella and also identify some factors driving the rise of AMR, which can provide valuable information for understanding the transmission dynamics and evolutionary trajectories of Salmonella.


Conflict of interest statement

Competing interests: The authors declare that there are no competing interests.

Figures
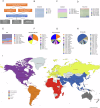
Fig. 1
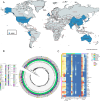
Fig. 1. Study design and overview of the global high-quality Salmonella genome catalog.
A Flowchart of the global atlas of AMR in Salmonella analysis pipeline. A total of 471,617 publicly available Salmonella genomes were downloaded (as of June 17, 2023), after screening by both bioinformatic software (including STSTR, SeqSero2, and MLST) and clear metadata, a total of 208,233 genomes were obtained. A total of 708 serovars and 3006 sequence types (STs) were detected. B Distribution of S. enterica genomes in six subspecies. C Distribution of S. enterica genomes in six continents. D Distribution of S. enterica genomes in different periods. E Overview of S. enterica genomes from different sources. F Overview of S. enterica genomes from different serogroups. G Top 20 serovars among the global Salmonella genome catalog. H Top 20 STs among the global Salmonella genome catalog. I A global map showing the geographic distribution of the 208,233 Salmonella genomes from 148 countries or regions across six continents. The map was generated using the MapChart (https://www.mapchart.net). Source data are provided as a Source Data file.
Fig. 2
Fig. 2. Temporal changes of AMR in Salmonella enterica.
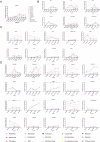
A Temporal trends of AMR rates at the global scale. B Temporal trends of AMR phenotypes across six continents. C Temporal trends of AMR rates among nine sources. D Temporal trends of AMR rates among the twenty predominant Salmonella serovars.
Fig. 3
Fig. 3. Temporal dynamics and differences in ARGs among different geographic locations, sources, and serovars.
A The distribution of numbers of ARGs per genome among the twenty predominant serovars. Kruskal-Wallis tests were used to compare differences among different groups. The “*” on the right represents P values. *: P < 0.05; **: P < 0.01; ***: P < 0.001. ****: P < 0.0001. No significant differences were not shown. Data are presented as mean values with SEM. Agona: n = 13, 347, 2912, 461. Anatum: n = 385, 3314, 1052. Braenderup: n = 5, 114, 1858, 366. Derby: n = 7, 13, 260, 2136, 477. Dublin: n = 35, 98, 374, 2238, 407. Enteritidis: n = 6, 18, 16, 19, 77, 317, 1911, 30,577, 2349. Heidelberg: n = 5, 35, 17, 925, 4059, 155. I 1,4,5,12:i-: n = 21, 591, 9576, 468. Infantis: n = 22, 634, 9885, 5011. Kentucky: n = 4, 761, 8409, 3623. Mbandaka: n = 568, 1525, 358. Montevideo: 14, 509, 3045, 831. Muenchen: n = 202, 2292, 466. Newport: n = 27, 738, 5220, 987. Saintpaul: n = 481, 1867, 221. Schwarzengrund: n = 176, 2049, 636. Senftenberg: n = 4, 454, 1590, 324. Thompson: n = 10, 138, 1668, 258. Typhi: n = 63, 364, 1229, 3897, 206. Typhimurium: n = 10, 4, 8, 8, 91, 498, 3165, 18,757, 2569. B Temporal trends in the prevalence of ARGs. C Differences in ARGs among different geographic regions. D Differences in ARGs among different isolation sources. E Differences in ARGs among different serovars.
Fig. 4
Fig. 4. Temporal dynamics and differences in plasmid replicons across sampling periods, serovars, locations, and sources.
A The distribution of numbers of plasmid replicons per genome among the top 20 serovars. A total of 316,327 plasmid replicons classified into 120 types were identified in the global Salmonella catalog. A total of 40 dominant plasmid replicons are shown. Kruskal-Wallis tests were used to compare differences among different groups. The “*” on the right represents P-values. *: P < 0.05; **: P < 0.01; ***: P < 0.001. ****: P < 0.0001. No significant differences were not shown. Data are presented as mean values with SEM. Braenderup: n = 114, 1858, 366. Derby: n = 260, 2136, 477. I 1,4,5,12:i-: n = 21, 591, 9576, 468. Agona: n = 347, 2912, 461. Anatum: n = 385, 3314, 1052. Enteritidis: n = 317, 1911, 30,577, 2349. Thompson: n = 138, 1668, 258. Kentucky: n = 761, 8409, 3623. Mbandaka: n = 568, 1525, 358. Infantis: n = 634, 9885, 5011. Schwarzengrund: n = 176, 2049, 636. Saintpaul: n = 481, 1867, 221. Montevideo: 14, 509, 3045, 831. Newport: n = 27, 738, 5220, 987. Muenchen: n = 202, 2292, 466. Senftenberg: n = 454, 1590, 324. Heidelberg: n = 35, 17, 925, 4059, 155. Typhi: n = 364, 1229, 3897, 206. Dublin: n = 35, 98, 374, 2238, 407. Typhimurium: n = 91, 498, 3165, 18,757, 2569. B Differences in plasmid replicons across different periods. C Differences in plasmid replicons across different geographic regions. D Differences in plasmid replicons across different isolation sources. E Differences in plasmid replicons across different serovars.
Fig. 5
Fig. 5. Genetic characterization and phylogeny of the global MRDRST genomes.
A A global map showing the geographic distribution of these MRDRST strains. The map was generated using the MapChart (https://www.mapchart.net). Source data are provided as a Source Data file. B Phylogenetic analysis and functional annotations of 616 global MRDRST strains. From the inner to outer circles are ST, Country, Continent, Source, Year, FRGs, MCRs, mph(A), NDMGs, and blaCTX-M genes. C A heatmap showing the differences of AMR in MRDRST strains. Temporal, regional, and host distribution of genes that are resistant to fosfomycin and other important antibiotics (including amphenicol, polymyxin, azithromycin, fluoroquinolone, carbapenem, and 3GCs).

References

    1. Ikuta, K. S. et al. Global mortality associated with 33 bacterial pathogens in 2019: a systematic analysis for the Global Burden of Disease Study 2019. Lancet400, 2221–2248 (2022). - PMC - PubMed
    1. Murray, C. J. L. et al. Global burden of bacterial antimicrobial resistance in 2019: a systematic analysis. Lancet399, 629–655 (2022). - PMC - PubMed
    1. World Health Organization. WHO bacterial priority pathogens list, 2024: Bacterial pathogens of public health importance to guide research, development and strategies to prevent and control antimicrobial resistance. https://www.who.int/publications/i/item/9789240093461/ (2024). - PubMed
    1. Ma, Y. et al. WHO revised bacterial priority pathogens list to encourage global actions to combat AMR. hLife2, 607–610 (2024).
    1. Xiao, Y. & Nishijima, T. Status and challenges of global antimicrobial resistance control: A dialogue between Professors Yonghong Xiao and Takeshi Nishijima. hLife2, 47–49 (2024).

Publication types

Substances

LinkOut - more resources