. 2025 May 17;16(1):4588.
doi: 10.1038/s41467-025-59860-6.

A spatio-temporal brain miRNA expression atlas identifies sex-independent age-related microglial driven miR-155-5p increase

Affiliations

A spatio-temporal brain miRNA expression atlas identifies sex-independent age-related microglial driven miR-155-5p increase

Annika Engel et al. Nat Commun. .

Abstract

An in-depth understanding of the molecular processes composing aging is crucial to develop therapeutic approaches that decrease aging as a key risk factor for cognitive decline. Herein, we present a spatio-temporal brain atlas (15 different regions) of microRNA expression across the mouse lifespan (7 time points) and two aging interventions. MicroRNAs are promising therapeutic targets, as they silence genes by complementary base-pair binding of messenger RNAs and mediate aging speed. We first established sex- and brain-region-specific microRNA expression patterns in young adult samples. Then we focused on sex-dependent and independent brain-region-specific microRNA expression changes during aging. We identified three sex-independent brain aging microRNAs (miR-146a-5p, miR-155-5p, and miR-5100). For miR-155-5p, we showed that these expression changes are driven by aging microglia and target mTOR signaling pathway components and other cellular communication pathways. In this work, we identify strong sex-brain-region-specific aging microRNAs and microglial miR-155-5p as a promising therapeutic target.


Conflict of interest statement

Competing interests: The authors declare no competing interests.

Figures

Fig. 1
Fig. 1. Spatio-temporal overview and analysis of RNA expression in the aging mouse brain.
a Study overview: Brain tissues collected at 3, 12, 15, 18, 21, 26, and 28 months from 15 brain regions defined by the Allen Brain Atlas. Numbers below the timeline indicate mouse individuals per age and sex. Created in BioRender. Engel, A. (2025) https://biorender.com/w13g377. b Distribution of Spearman’s rank correlation coefficients between age and features per RNA class calculated separately for each brain region using all samples. The black lines within the ridgeline indicate medians. The feature counts are displayed on the right. c Time series boxplots for tRNA-Glu-TTC-1-1 expression in three brain regions, separated by sex. Spearman’s rank correlation coefficients from the tRNA expression with age are displayed above each plot (significant, if adjusted p-value < 0.05, two-sided Spearman’s rank correlation test adjusted and adjustment for multiple testing using Benjamini-Hochberg procedure (cf. Methods)). Asterisks mark significant deregulation (fold change 1.5 or 1/1.5 and adjusted p-value < 0.05 from two-sided Welch’s t-test, Benjamini-Hochberg procedure) of the older ages to the reference age (3 months). The source data contains all exact values and sample sizes. Box borders correspond to the 25th (Q1) and 75th Percentile (Q3), the middle line to the median and whiskers to the minimum (maximum) of the minimum value or Q11.5IQR (maximum value or the Q3+1.5IQR) where IQR determines the interquartile range. Solid grey dots in the plot indicate the potential outliers in the data. d UMAP of all samples for tRNA features, colored by brain regions (Fig. 1a). e Principal Variance Component Analysis for tRNAs across all samples showing variance explained by brain region, age, sex, and individual. f UMAP of all samples for miRNA features colored by brain regions (Fig. 1a). g Principal Variance Component Analysis for the miRNAs across all samples, showing variance explained by brain region, age, sex, and individual. Colors as in Fig. 1e.
Fig. 2
Fig. 2. Sex- and brain region-specific miRNA variation in the mouse brain.
a Heatmaps of the 50 top miRNA from brain regions determined by the coefficient of variation calculated using the medians of the expression values of each brain region. Shown are the absolute standardized expression values (z-scores) for the younger male (left) and younger female (right) samples. Black borders indicate the binarization (|z-score|> 0.5) on which a clustering into four clusters using a hierarchical clustering was applied. We consider a miRNA in a brain region different from the average brain if it surpasses the aforementioned threshold. If it only exceeds the threshold for one brain region, we call it brain region-specific. Lines connecting the two heatmaps are highlighting the occurrence of common features (light green). If features are differing from the average brain for only one but the same brain region in both sexes, they are highlighted in pink and in dark green if they differ from the average brain in the same set of multiple brain regions. For visualization purposes, we removed features entirely below the selected threshold. b Venn diagram linking the features which are differing from the average brain per brain region between the male and female heatmap. c PVCA showing the observed variance for each brain region individually over all sex-matched samples (3, 12, 15, 18, 21 months) for age and sex. The point size indicates the variance when observing age and sex in combination. Colors refer to the brain regions (Fig. 1a). Thresholds at 12% for both axes are marked with grey dashed lines. d Volcano plot for the sex-specific comparison of mot. cortex, choroid plexus, thalamus and olfactory bulb. Colored dots indicate significantly down (green) and significantly upregulated (yellow) miRNAs (fold change 1.5 or 1/1.5, adjusted p-value < 0.05, two-sided Welch’s t-test, Benjamini-Hochberg procedure). e The gene set enrichment analysis (GSEA) results obtained from MIEAA for mot. cortex, choroid plexus, thalamus showing the top 10 depleted (green) and enriched (yellow) pathways (cf. Methods).
Fig. 3
Fig. 3. Sex-specific miRNA dynamics in brain aging across male and female.
Sex-specific analysis, with male samples shown on the left and female on the right. a Time series boxplots of mmu-miR-9-5p in three brain regions. Spearman’s rank correlation coefficient of miRNA expression with age is displayed above each plot (significant, if adjusted p-value < 0.05, two-sided Spearman’s rank correlation test, Benjamini-Hochberg procedure). Boxplots follow Fig. 1c and Methods; exact values in Supplementary Data 4 and 5. b Barplots of significantly anti- or positively correlated miRNAs with age per brain region (|R|  0.5, Spearman’s rank correlation coefficient, adjusted p-value < 0.05, two-sided Spearman’s rank correlation test, Benjamini-Hochberg). Upper bars contain miRNAs in the same direction significantly correlated in multiple brain regions (yellow). Lower bars contain miRNAs unique for one region (colors refer to brain regions (Fig. 1a)). c Features significantly correlated in multiple brain regions. Dots indicate brain regions, background color yellow (green), if significantly positively correlated (anti-correlated). d Heatmaps showing up- or downregulated miRNAs per brain region between older ages and 3 months (fold change 1.5 or 1/1.5). Numbers are shown if more than 200 miRNAs. e Significantly upregulated miRNAs (yellow; fold change 1.5, adjusted p-value < 0.05) and significantly downregulated (green; fold change 1/1.5) in multiple brain regions. Colors analog to Fig. 3c. f Summary of brain region-specific and age-related features. Purple markers indicate brain region-specific features from Fig. 2a. Arrows pointing to the top in yellow (bottom in green) stand for significantly upregulated (downregulated) miRNAs and positive in yellow (negative in green) signs for significantly positively (anti-) correlated miRNAs. g Human ROSMAP data: Healthy samples split by age of death (71-80, 81-91, 92-102 years). Color indicates the log2-fold changes between the youngest and oldest group per sex. Black borders mark if the fold change exceeds |log2(1.5)|. Asterisks indicate significance (two-sided Welch’s t-test, Benjamini-Hochberg). h Scatterplot of Cohen’s d against log2-fold change, colored if thresholds for fold change (|log2(fc)| log2(1.5)) and effect size (|d|  0.5) are exceeded (upregulation yellow and downregulation green). Labeled miRNAs were age-correlated in mot. cortex (Supplementary Fig. 4c).
Fig. 4
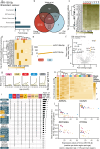
Fig. 4. Global miRNA expression dynamics in brain aging across regions.
All samples from the dataset are considered. a Heatmaps showing deregulated miRNAs between each older age and 3 months (fold change 1.5 or 1/1.5). Numbers shown if 200 miRNAs. On the left, significantly anti- or positively correlated miRNAs with age are given (|R|  0.5, Spearman’s rank correlation coefficient, adjusted p-value < 0.05, two-sided Spearman’s rank correlation test, Benjamini-Hochberg). b Upset plot of miRNAs changing significant with age per brain region, indicating unique and overlapping candidates. Significant candidates from Fig. 4a and Supplementary Fig. 4e. Brain regions above the age variance threshold in Fig. 2c are bold. Regions with <10 candidates and combinations with <5 miRNAs are omitted. c Trajectory clustering overview (k = 53, minimum membership 15%). Each dot represents a cluster, sized by cluster size. Dot color indicates brain region if occurrence exceeds 30%, dark green if the most frequent features incidence exceeds 4, otherwise light green. d Center lines of clusters with brain region occurrence >30%, highlighting choroid plexus and pons. e Trajectories of four selected clusters (z-scored miRNA expression). Yellow plots show a steady increase, green plots steady decrease with age. Labels show dominant regions (>10%) and frequent miRNAs (>3 features). Regions with black borders and bold miRNAs exceed the thresholds from Fig. 4c. f Detailed view of brain region occurrence (left) and miRNA frequency (right). Brain regions (<10%) and miRNA (<3) are omitted. Dots over thresholds from Fig. 4c (grey dashed lines) appear in dark green for miRNAs or have black borders for brain regions. g Center lines of seven clusters containing mmu-miR-155-5p trajectories. Line widths vary if multiple regions share a center line. h Boxplots of mmu-miR-155-5p trajectories in seven brain regions. Asterisks highlight significant comparisons to 3 months (fold change 1.5 or 1/1.5, adjusted p-value < 0.05, two-sided Welch’s t-test, Benjamini-Hochberg procedure). Spearman’s rank correlation coefficient with age are displayed above each plot (significantly, if adjusted p-value < 0.05, two-sided Spearman’s rank correlation test, Benjamini-Hochberg). Boxplots follow Fig. 1c and Methods; exact values in Supplementary Data 7 and 8.
Fig. 5
Fig. 5. MiR-155-5p expression and target interactions in brain aging and microglia.
a Based-on CNS microRNA Profiles. Barplot displays fold changes of mmu-miR-155-5p between brain cell types and brainstem data. b Venn plot (distinct mode) of our microglia expression data (FACS-sorted young and aged mice) compared to immunopanning-derived profiles from young microglia. c Top 25 most expressed miRNAs in our microglia dataset (expression in log10-scale), miRNAs clustered hierarchically. d Top 25 miRNAs by coefficient of variation, showing absolute standardized expression per sample and miRNA, clustered hierarchically. e Line plot for two miRNAs showing the median expression in young and old mice, indicating direction of deregulation. f Volcano plot of differential expression (old versus young), showing raw p-values (two-sided Welch’s t-test). No miRNA reaches significance after adjustment, but mmu-miR-155-5p shows strong upregulation (marked in bold). g Trajectories of median expression per age for isomiRs of mmu-miR-155 in five brain regions. The canonical isomiR is highlighted as a dark line. h Top 25 most expressed isomiRs of mmu-miR-155-5p (sorted from top to bottom). Averaged standardized expression per brain region and isomiR, clustered by brain regions (hierarchical clustering with complete linkage) and split into three clusters. i Region-wise Spearman’s rank correlation coefficient for target genes of mmu-miR-155-5p (from miRTargetLink 2.0) using mRNA data from Hahn et al. . Upset plot shows significantly anti-correlated genes ((|R|  0.3, adjusted p-value < 0.05, two-sided Spearman’s rank correlation test, Benjamini-Hochberg procedure) with brain region assignment. Genes are colored by pathways: “mTOR Signaling Pathway” (yellow) and the “Regulation of cell communication” (blue). j Scatter plots for four of the significantly anti-correlated target genes (from Fig. 5i). Brain regions with significant anti-correlation are color-coded. Plots show the relationship between gene expression and the miR-155-5p, based on median values per brain region and age.

Update of

Similar articles

References

    1. Lopez-Otin, C., Blasco, M. A., Partridge, L., Serrano, M. & Kroemer, G. Hallmarks of aging: An expanding universe. Cell186, 243–278 (2023). - PubMed
    1. Brito, D. V. C. et al. Assessing cognitive decline in the aging brain: lessons from rodent and human studies. NPJ Aging9, 23 (2023). - PMC - PubMed
    1. Hahn, O. et al. Atlas of the aging mouse brain reveals white matter as vulnerable foci. Cell186, 4117–4133 e4122 (2023). - PMC - PubMed
    1. Feng, X. et al. Brain regions vulnerable and resistant to aging without Alzheimer’s disease. PLoS One15, e0234255 (2020). - PMC - PubMed
    1. Perez, R. F. et al. A multiomic atlas of the aging hippocampus reveals molecular changes in response to environmental enrichment. Nat. Commun.15, 5829 (2024). - PMC - PubMed

LinkOut - more resources