. 2025 May 18;16(1):396.
doi: 10.1038/s41419-025-07704-y.

Deep transfer learning approach for automated cell death classification reveals novel ferroptosis-inducing agents in subsets of B-ALL

Affiliations

Deep transfer learning approach for automated cell death classification reveals novel ferroptosis-inducing agents in subsets of B-ALL

Paweł Stachura et al. Cell Death Dis. .

Abstract

Ferroptosis is a recently described type of regulated necrotic cell death whose induction has anti-cancer therapeutic potential, especially in hematological malignancies. However, efforts to uncover novel ferroptosis-inducing therapeutics have been largely unsuccessful. In the current investigation, we classified brightfield microscopy images of tumor cells undergoing defined modes of cell death using deep transfer learning (DTL). The trained DTL network was subsequently combined with high-throughput pharmacological screening approaches using automated live cell imaging to identify novel ferroptosis-inducing functions of the polo-like kinase inhibitor volasertib. Secondary validation showed that subsets of B-cell acute lymphoblastic leukemia (B-ALL) cell lines, namely 697, NALM6, HAL01, REH and primary patient B-ALL samples were sensitive to ferroptosis induction by volasertib. This was accompanied by an upregulation of ferroptosis-related genes post-volasertib treatment in cell lines and patient samples. Importantly, using several leukemia models, we determined that volasertib delayed tumor growth and induced ferroptosis in vivo. Taken together, we have applied DTL to automated live-cell imaging in pharmacological screening to identify novel ferroptosis-inducing functions of a clinically relevant anti-cancer therapeutic.


Conflict of interest statement

Competing interests: The authors declare no competing interests. Ethics approval and consent to participate: Experiments were performed under the authorization of LANUV in accordance with German law for animal protection. Patient consent for publication: This study involves human participants after obtaining informed consent in accordance with the Declaration of Helsinki. The experiments were approved by the ethics committee of the Heinrich Heine University medical faculty (Study Nr.: 2019-566).

Figures
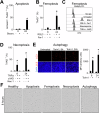
Fig. 1
Fig. 1. Different modes of cell death can be induced in L929 cells.
A, B L929 cells were analyzed for 7AAD and/or Annexin V (A) positivity using FACS after 8 or 24 hour treatment with (A) staurosporine and (B) RSL3 and Fer-1 (n = 4). C L929 cells were treated as indicated with the same concentrations as in (A), (B), (D), stained with BODIPY C11 and FACS analyzed in the FITC channel for ferroptosis induction (n = 4, a representative histogram is shown). D L929 cells were analyzed for 7AAD positivity after 8 and 24-hour treatment with zVAD, TNFα and Nec-1 (n = 4). (E left panel) L929 cells were treated with Torin1 for 8 or 24 hours and evaluated for LC3 and DAPI using immunofluorescence (representative images of n of 4 are shown). LC3 fluorescent signal was quantified in the right panel. F Representative brightfield images of L929 cells after 8 hour treatment with staurosporine for apoptosis induction, RSL3 for ferroptosis induction, zVAD and TNFα for necroptosis induction and Torin1 for autophagy induction are shown (representative images of n of 3 are shown). In every experiment, the following concentrations were used: staurosporine (1 µM), zVAD (40 µM), TNFα (40 ng/ml), RSL3 (1 µM), Torin1 (5 µM), Nec-1 (10 µM) and Fer-1 (5 µM). Error bars in all experiments indicate SEM; *P < 0.05 as determined by a Student´s t-test (unpaired, 2-tailed) or a 1-way ANOVA with a Dunnett’s post-hoc test.
Fig. 2
Fig. 2. Deep transfer learning is used for automated recognition of different types of cell death.
A Schematic representations of the workflow in training/fine-tunning CNN and drug screening and (B) CNN architecture and example of image classification are shown. C Deep learning image classification from L929 cells induced with the corresponding type of cell death stimuli during a 24 hour time course are shown. D Validation confusion matrix of cell death modes predicted by DTL ResNet50 versus final biological categorization is shown. The y-axis represents the evaluated labels and the x-axis the predicted labels of cell death. The color gradient indicates the number of images.
Fig. 3
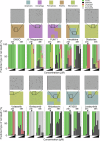
Fig. 3. Deep transfer learning combined with drug screen successfully classifies 4 different modes of cell death.
Brightfield images were acquired of L929 cells treated with increasing concentrations of drugs from a library of 84 compounds. Images were classified using the DLT learning program to identify different modes of cell death. Several examples of drugs and their classification at the 24 and 48-hour time-point are shown with the accompanying representative cell death classified image. The black arrow indicates the chosen concentration at which the magnified bright field image is shown.
Fig. 4
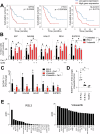
Fig. 4. B-ALL cells are sensitive to ferroptosis induction.
A Kaplan–Meier survival curves for patients with leukemia (n = 173, from the TCGA LAML cohort) were stratified according to GPX4, FTH1 and SLC7A11 transcript expression. B Cell death was measured by evaluating the percentage of DAPI positive cells using FACS after 72 hours treatment with 1 µM RSL3 or 6 µM volasertib, 5 µM Fer-1 and 10 µM QVD (n = 8-11). C Ferroptosis induction in several human B-ALL cell lines and (D) primary patient samples was assessed by measuring BODIPY C11 green fluorescent influx following treatment with RSL3 (1 µM) or volasertib (6 µM) alone and in combination with Fer-1 (5 µM) for 24 hours (n = 3-9). Primary patient samples were stratified as ferroptosis sensitive (S B-ALL) and ferroptosis insensitive (IS B-ALL). E Top 20 cell line selective drug sensitivity (sDSS) RSL3 and volasertib scores from the online FORALL resource are shown. Error bars in all experiments indicate SEM; *P < 0.05 as determined by a Student´s t-test (unpaired, 2-tailed) or a 1-way ANOVA with a Dunnett’s post-hoc test.
Fig. 5
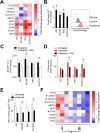
Fig. 5. Sensitive B-ALL cells upregulate ferroptosis related genes post volasertib treatment.
A Heat map representing fold changes of ferroptosis-related genes after 24 hours of treatment with 6 µM volasertib relative to untreated B-ALL cell lines is shown (n = 4-7). (B, left panel) B-ALL cells were treated with 6 µM volasertib for 24 hours and levels of Fe2+ were measured using FerroOrange dye by FACS. Relative levels compared to untreated cells are shown (n = 4-6). Representative shift of the signal is illustrated using the histogram on the right panel (representative histogram of n of 4-6 is shown). C, D B-ALL cells, treated with 6 µM volasertib and with supplementation of 5 mM GSH were FACS-analyzed after 24 hours for lipid peroxidation using BODIPY C11 in C (n = 3-5) or analyzed after 72 hours for DAPI positive cells in D (n = 4). E 106 human B-ALL cells were treated with 6 µM volasertib for 24 hours and GSH was assessed from the cell pellet (n = 3). F Heat map representing fold changes of ferroptosis-related genes after 24 hours of treatment with 6 µM volasertib relative to untreated primary patient samples are shown (n = 8). S= ferroptosis sensitive. IS = ferroptosis insensitive. Error bars in all experiments indicate SEM; *P < 0.05 as determined by a Student´s t-test (unpaired, 2-tailed).
Fig. 6
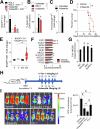
Fig. 6. Volasertib induces ferroptosis and increases ACSL4 expression in vivo.
A Lipid peroxidation was measured with BODIPY C11 in C1498 cells following treatment volasertib (6 µM) or RSL3 (1 µM) with or without Fer-1 (5 µM) for 24 hours (n = 5). B Viability of C1498 cells was measured by FACS and analyzed for the percentage of DAPI positive cells after 72 hours treatment with volasertib (6 µM) or RSL3 (1 µM, n = 8). C Level of Fe2+ in C1498 cells after 24 hours treatment with 6 µM volasertib was measured by staining with FerroOrange dye and assessed using FACS (n = 6). D C57BL/6 J mice were intravenously inoculated with 500,000 C1498-luc-GFP cells. After 7 days, mice were randomized by luminescent signal as assessed by IVIS and treated with 20 mg/kg volasertib or vehicle on day 7, 9, 11 and 13 post-inoculation. Survival was monitored (n = 8). E, F Schematic representation of the treatment and endpoint regimen is shown in Supplementary Fig. 4A. NSG mice were inoculated intravenously with 500,000 C1498-luc-GFP cells. Mice were randomized and treated with 20 mg/kg volasertib or vehicle on the indicated days. E Leukemia-engrafted spleens of volasertib or vehicle treated mice were stained with BODIPY C11 (n = 5-8 per group). F Expression of genes related to ferroptosis from leukemia-engrafted spleens of volasertib or vehicle treated mice is shown (n = 5-8). G Human B-ALL cells were treated with 6 µM volasertib and 48 hours later HMGB1 was measured from the supernatant using ELISA (n = 4). H, I NSG mice (n = 4-5 per group) were intravenously inoculated with 106 REH-luc-GFP cells and after 6 days, randomized according to the IVIS bioluminescent imager into four treatment groups: vehicle, volasertib (20 mg/kg), Fer-1 (10 mg/kg) and volasertib + Fer-1. Mice were treated according to the schematic regimen in (H). 26 days post tumor inoculation, mice were IVIS scanned and engraftment signal was quantified in (I). Error bars in all experiments indicate SEM; *P < 0.05 as determined by a Student´s t-test (unpaired, 2-tailed) or a 1-way ANOVA with a Dunnett’s post-hoc test. For the Kaplan–Meier survival curve, the log-rank test was used.

Similar articles

References

    1. Galluzzi L, Vitale I, Aaronson SA, Abrams JM, Adam D, Agostinis P, et al. Molecular mechanisms of cell death: recommendations of the Nomenclature Committee on Cell Death 2018. Cell Death Differ. 2018;25:486–541. - PMC - PubMed
    1. Zheng TS, Schlosser SF, Dao T, Hingorani R, Crispe IN, Boyer JL, et al. Caspase-3 controls both cytoplasmic and nuclear events associated with Fas-mediated apoptosis in vivo. Proc Natl Acad Sci USA. 1998;95:13618–23. - PMC - PubMed
    1. Inoue S, Browne G, Melino G, Cohen GM. Ordering of caspases in cells undergoing apoptosis by the intrinsic pathway. Cell Death Differ. 2009;16:1053–61. - PubMed
    1. Walsh JG, Cullen SP, Sheridan C, Luthi AU, Gerner C, Martin SJ. Executioner caspase-3 and caspase-7 are functionally distinct proteases. Proc Natl Acad Sci USA. 2008;105:12815–9. - PMC - PubMed
    1. Vitale I, Pietrocola F, Guilbaud E, Aaronson SA, Abrams JM, Adam D, et al. Apoptotic cell death in disease-Current understanding of the NCCD 2023. Cell Death Differ. 2023;30:1097–154. - PMC - PubMed

LinkOut - more resources