. 2025 May 17;11(1):241.
doi: 10.1038/s41420-025-02521-w.

Matrix metalloproteinase-10 promotes kidney fibrosis by transactivating β-catenin signaling

Affiliations

Matrix metalloproteinase-10 promotes kidney fibrosis by transactivating β-catenin signaling

Xiaoli Sun et al. Cell Death Discov. .

Abstract

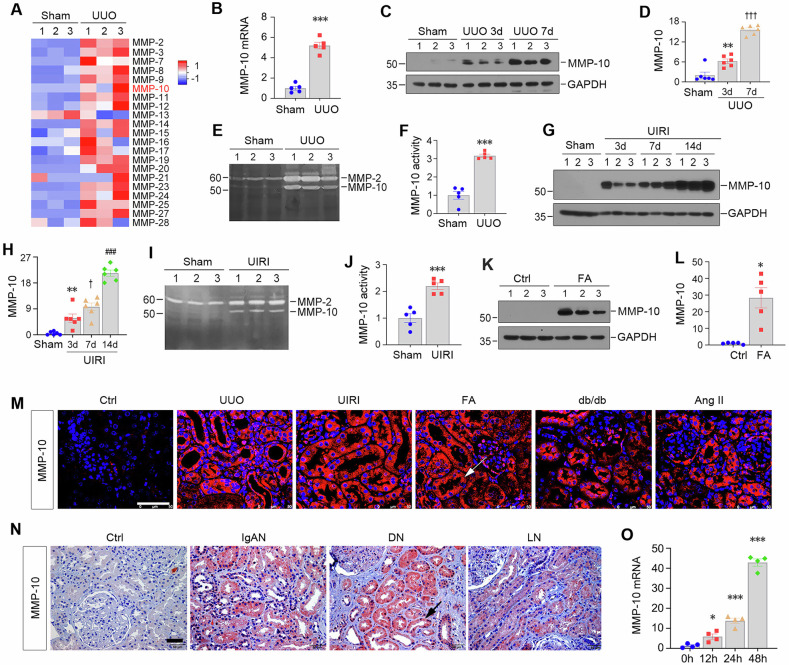
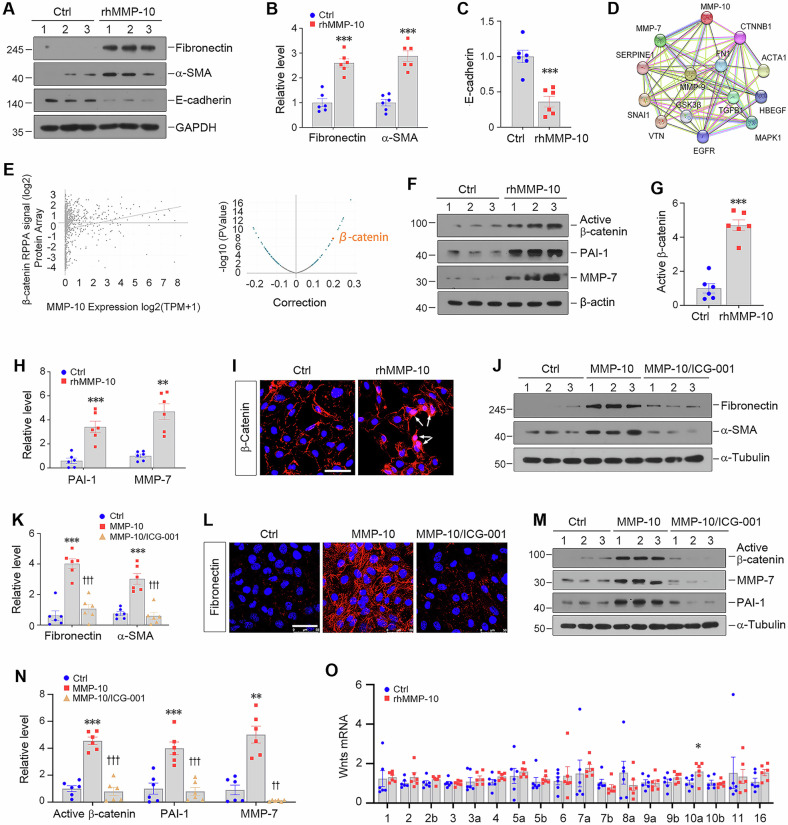
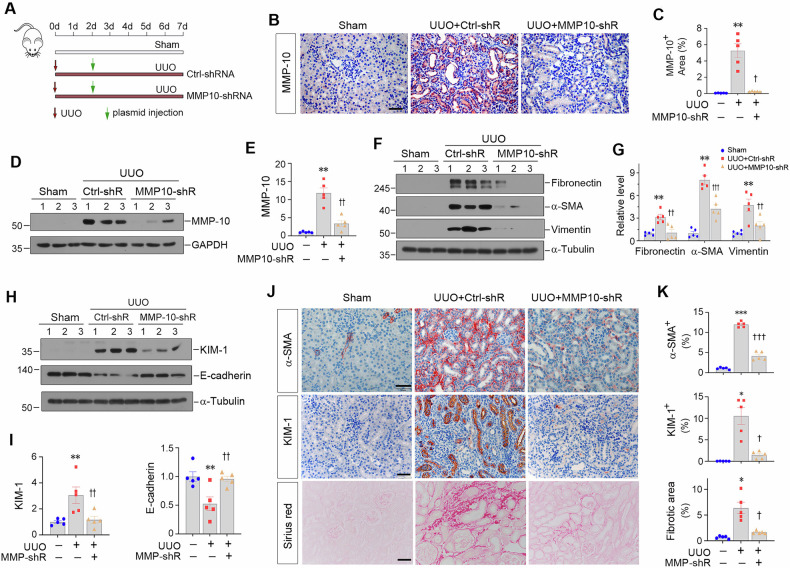
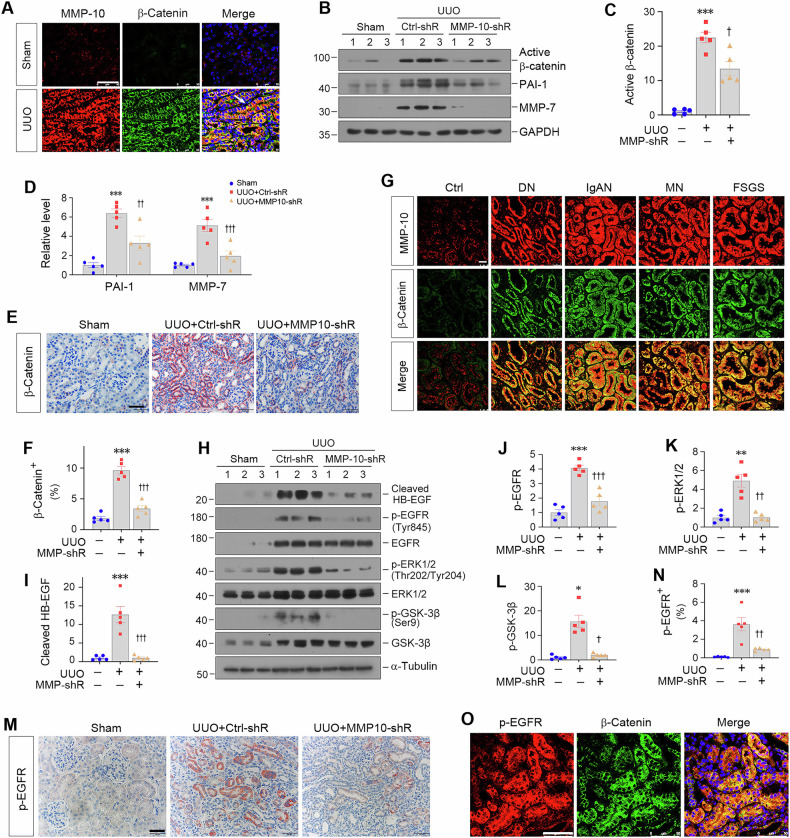
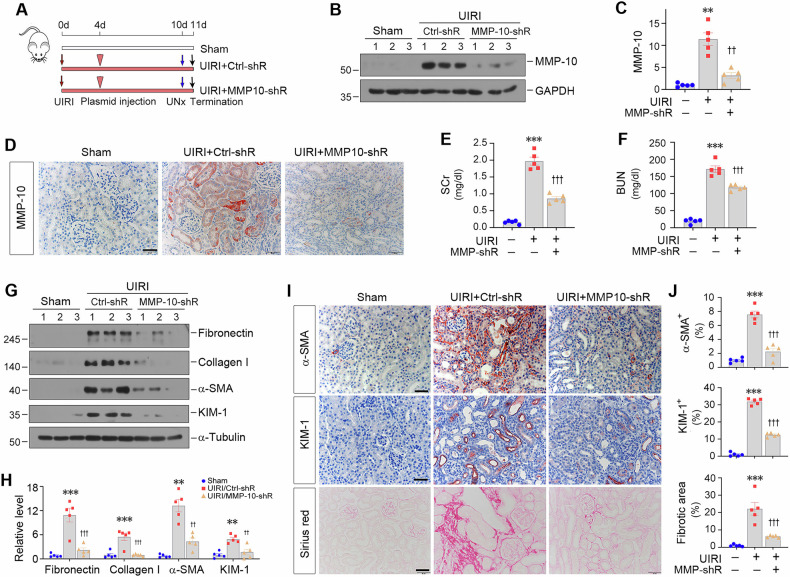
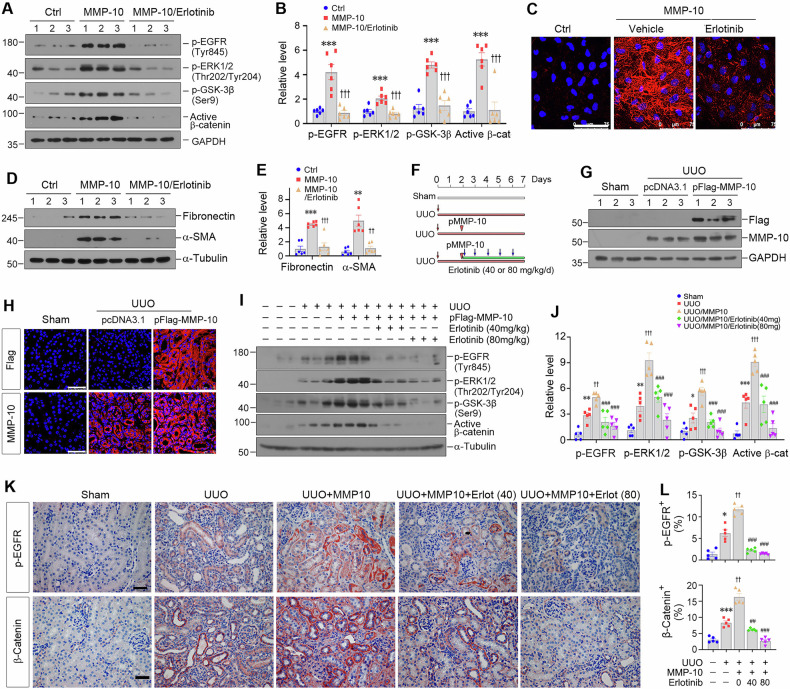
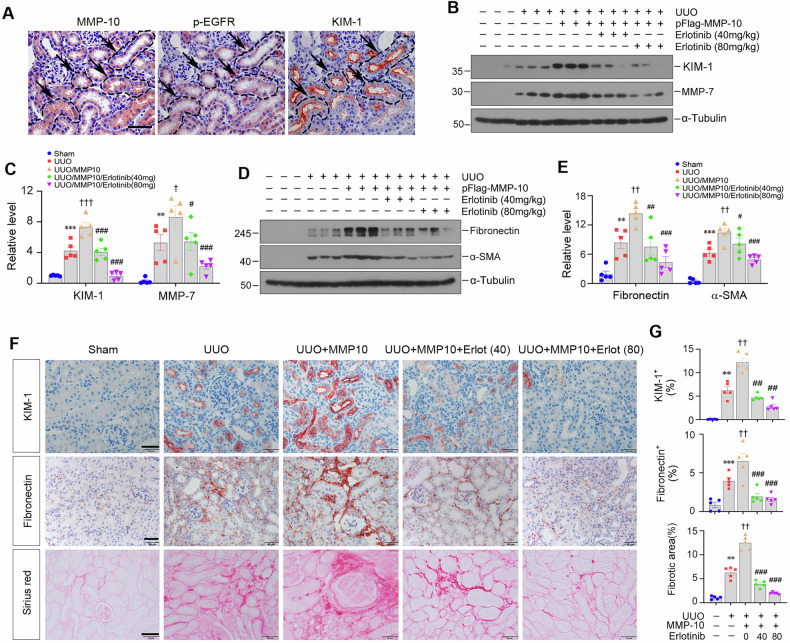
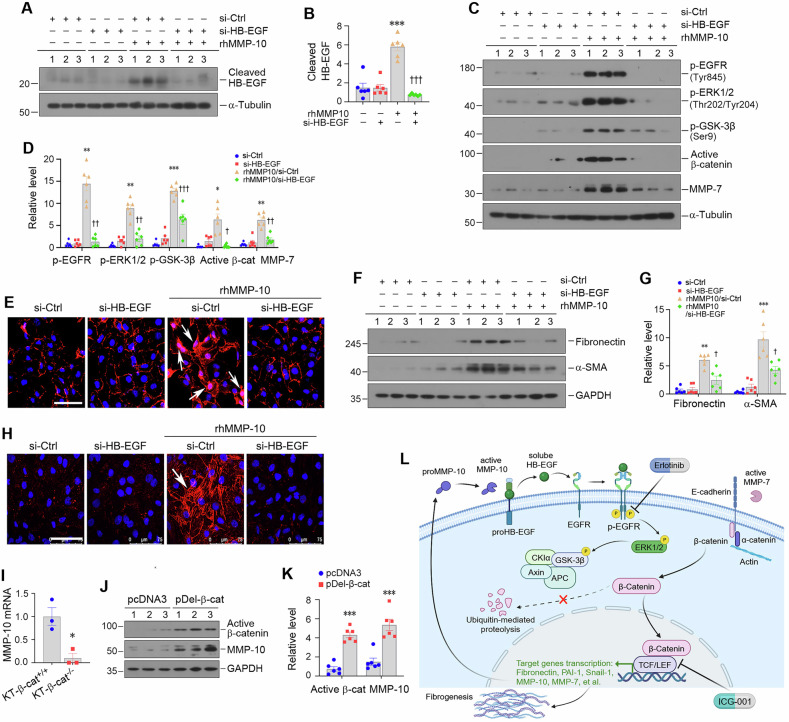
Kidney fibrosis is characterized by excessive accumulation of extracellular matrix (ECM) and serves as a hallmark of chronic kidney disease (CKD). The turnover of ECM is controlled by a family of matrix metalloproteinases (MMPs), endopeptidases that play a crucial role in ECM remodeling and other cellular processes. In this study, we demonstrate that MMP-10 was upregulated in a variety of animal models of kidney fibrosis and human kidney biopsies from CKD patients. Bioinformatics analyses and experimental validation reveal that MMP-10 activated β-catenin in a Wnt-independent fashion. Knockdown of endogenous MMP-10 expression in vivo inhibited β-catenin activation and ameliorated kidney injury and fibrotic lesions, whereas over-expression of exogenous MMP-10 aggravated β-catenin activation and kidney fibrosis after injury. We found that MMP-10 cleaved and activated heparin-binding EGF-like growth factor (HB-EGF) via ectodomain shedding, leading to EGF receptor (EGFR) tyrosine phosphorylation and β-catenin transactivation via a cascade of events involving extracellular signal-regulated kinases and glycogen synthase kinase-3β. Consistently, treatment with erlotinib, a small-molecule EGFR inhibitor, effectively mitigated MMP-10-mediated kidney injury and fibrotic lesions in a dose-dependent fashion. Furthermore, β-catenin activation reciprocally upregulated the expression of MMP-10, thereby perpetuating kidney damage by forming a vicious cycle. Collectively, these results underscore that MMP-10 promotes kidney fibrosis through EGFR-mediated transactivating β-catenin in a Wnt-independent fashion. Our findings suggest that targeting MMP-10 could be a novel strategy for treatment of fibrotic CKD.


Conflict of interest statement

Competing interests: The authors declare no competing interests. Ethics approval and consent to participate: This study was performed in accordance with the Declaration of Helsinki. The animal studies were conducted according to NIH Guide for the Care and Use of Laboratory Animals and approved by the Ethics Committee for Animal Studies at the Nanfang Hospital (NFYY-2020-0953). The use of human kidney specimens in this study was approved by the Institutional Ethics Committee at Nanfang Hospital, with written informed consent from the patients (EFEC-2021-051). To ensure participant anonymity, all personal identifiers were removed from clinical data, and specimens were coded using non-traceable alphanumeric identifiers.

Figures

Fig. 1
Fig. 1. Matrix metalloproteinase-10 (MMP-10) is upregulated in kidney tubular epithelium after various injuries.
A RNA sequencing revealed simultaneous induction of various MMPs in the kidney at 7 days after unilateral ureteral obstruction (UUO). Heat map depicts the mRNA expression profile of MMPs at 7 days after UUO. MMP-10 is highlighted by red color. B qRT-PCR showed renal MMP-10 mRNA expression at 7-day after UUO. Data are presented as the mean ± SEM. ***P < 0.001 versus the sham controls (n = 5). C, D Representative Western blotting (C) and quantitative data (D) showed the protein expression of MMP-10 in the kidney at different time points after UUO. Data are presented as the mean ± SEM. **P < 0.01 versus the sham controls (n = 6), †††P < 0.001 versus the 3-day UUO (n = 6). E, F The gelatin zymography image (E) and quantitative data (F) showed an increased MMP-10 enzymatic activity. The band near 56 kDa was indicated as MMP-10. Data are presented as the mean ± SEM. ***P < 0.001 versus the sham controls (n = 5). G, H Representative Western blotting (G) and quantitative data (H) showed the induction of MMP-10 in the kidney at different time points after unilateral ischemia-reperfusion injury (UIRI). Data are presented as the mean ± SEM. **P < 0.01 versus the sham controls (n = 6), P < 0.05 versus the UIRI 3-day (n = 6), ###P < 0.001 versus the UIRI 7-day (n = 6). I, J Zymographic analysis further showed an increased proteolytic activity of MMP-10 in UIRI. Data are presented as the mean ± SEM. ***P < 0.001 versus the sham controls (n = 5). K, L Representative Western blotting (K) and quantitative data (L) showed renal induction of MMP-10 in folic acid-induced nephropathy (FA) at 14 days after a single intraperitoneal injection of 250 mg/kg. Data are presented as the mean ± SEM. *P < 0.05 versus the sham controls (n = 5). M Representative micrographs of the immunofluorescence staining for MMP-10 protein in various CKD models as indicated. The arrow indicates positive staining in renal tubules. Scale bar, 50 µm. N Representative micrographs of the immunohistochemical staining for MMP-10 in human kidney biopsies from various CKD as indicated. Arrow indicates positive staining. Scale bar, 50 µm. O Quantitative real-time PCR analysis (qRT-PCR) demonstrated the induction of MMP-10 mRNA in human proximal tubule cells (HK-2) after treatment with TGF-β1 (2 ng/ml). Data are presented as the mean ± SEM. *P < 0.05, **P < 0.01, ***P < 0.001 versus the controls (n = 4).
Fig. 2
Fig. 2. Identification of β-catenin as the major effector mediating MMP-10 action.
AC Western blotting showed that rhMMP-10 (100 ng/ml) induced fibronectin and α-smooth muscle actin (α-SMA) and repressed E-cadherin in HK-2 cells. Representative Western blotting (A) and quantitative data (B, C) are reported. Data are presented as the mean ± SEM. ***P < 0.001 versus the controls (n = 6). D STRING analysis revealed the protein-protein interaction (PPI) network involving MMP-10 (https://cn.string-db.org/, accessed on 8 August 2023). The interaction between MMP-10 and β-catenin was noticed. E Analysis of the Cancer Dependency Map (https://depmap.org, accessed on 10 August 2023) revealed the correlation between MMP-10 expression and alteration in β-catenin. Linear regression (left) and volcano plot (right) demonstrated a positive correlation between MMP-10 and β-catenin. F, H RhMMP-10 activated β-catenin signaling in vitro, leading to the induction of active β-catenin, PAI-1, and MMP-7 proteins. Data are presented as the mean ± SEM. **P < 0.01, ***P < 0.001 versus the controls (n = 6). I Representative micrographs showed the nuclear translocation of β-catenin after rhMMP-10 treatment for 12 h. White arrows indicate nuclear staining of β-catenin. Scale bar, 50 µm. J, K ICG-001 (10 μM) abolished MMP-10-mediated fibronectin and α-SMA expression. Data are presented as the mean ± SEM. ***P < 0.001 versus the controls (n = 6); †††P < 0.001 versus rhMMP-10 alone (n = 6). L Representative immunofluorescence staining showed that ICG-001 inhibited fibronectin expression and deposition induced by MMP-10. Scale bar, 50 µm. M, N ICG-001 inhibited MMP-10-mediated β-catenin activation and its downstream MMP-7 and PAI-1 induction. Representative Western blotting (M) and quantitative data (N) were presented. Data are presented as the mean ± SEM. **P < 0.01, ***P < 0.001 versus the controls (n = 6); ††P < 0.01, †††P < 0.001 versus rhMMP-10 alone (n = 6). O qRT-PCR analysis showed that rhMMP-10 did not significantly affect the expression of Wnt ligands except Wnt10a. Data are presented as the mean ± SEM. *P < 0.05 versus controls (n = 6).
Fig. 3
Fig. 3. Knockdown of endogenous MMP-10 ameliorates kidney injury and fibrosis in obstructive nephropathy.
A Experimental design. The red and green arrows show the timing of UUO surgery and plasmid injection, respectively. B, C Representative micrographs (B) and quantitative data (C) demonstrated MMP-10 protein expression in different groups as indicated. Scale bar, 50 µm. Data are presented as the mean ± SEM. **P < 0.01 versus sham controls (n = 5); P < 0.05 versus UUO (n = 5). D, E Western blot analysis showed MMP-10 protein levels in various groups as indicated. Data are presented as the mean ± SEM. **P < 0.01 versus sham controls (n = 5), ††P < 0.01 versus UUO (n = 5). F, G Western blot analysis showed the expression of several fibrosis-related proteins such as fibronectin, α-SMA, and vimentin. Representative Western blotting (F) and quantitative data (G) are presented. Data are presented as the mean ± SEM. **P < 0.01, ***P < 0.001 versus sham controls (n = 5); ††P < 0.01, †††P < 0.001 versus UUO (n = 5). H, I Representative Western blotting (H) and quantitative data (I) showed KIM-1 and E-cadherin protein in various groups as indicated. Data are presented as the mean ± SEM. **P < 0.01 versus sham controls (n = 5), ††P < 0.01 versus UUO (n = 5). J, K Representative micrographs (J) and quantitative data (K) showed immunohistochemical staining for α-SMA and KIM-1 and Sirius red staining for collagen deposition. Data are presented as the mean ± SEM. *P < 0.05, **P < 0.01 versus sham controls (n = 5); P < 0.05, ††P < 0.01 versus UUO (n = 5). Scale bar, 50 µm.
Fig. 4
Fig. 4. MMP-10 transactivates β-catenin via HB-EGF/EGFR/ERK1/2/GSK-3β cascade.
A Representative micrographs showed the colocalization of MMP-10 (Red) and β-catenin (Green) in the obstructed kidney after UUO. Arrows indicate positive staining. Scale bar, 50 µm. BD Knockdown of endogenous MMP-10 abolished the expression of β-catenin and its downstream genes in UUO model. Representative Western blotting results (B) and corresponding quantitative data (C, D) were shown. Data are presented as the mean ± SEM. ***P < 0.001 versus sham controls (n = 5); P < 0.05, ††P < 0.01, †††P < 0.001 versus UUO injected with Ctrl-shRNA (n = 5). E, F Representative immunohistochemical staining for β-catenin further demonstrated that knockdown of MMP-10 inhibited β-catenin expression in renal tubules. Scale bar, 50 µm. Data are presented as the mean ± SEM. ***P < 0.001 versus sham controls (n = 5). †††P < 0.001 versus UUO injected with Ctrl-shRNA (n = 5). G Double immunofluorescence staining showed the colocalization between MMP-10 (Red) and β-catenin (Green) in patients with various CKD as indicated. Scale bar, 25 µm. HL Western blotting showed that knockdown of MMP-10 inhibited the expression of cleaved HB-EGF, p-EGFR (Tyr845), p-ERK (Thr202/Tyr204), and p-GSK-3β (Ser9) in the obstructed kidney after UUO. Representative Western blotting (H) and quantitative data (IL) were shown. Data are presented as the mean ± SEM. *P < 0.05, **P < 0.01, ***P < 0.001 versus sham controls (n = 5); P < 0.05, ††P < 0.01, †††P < 0.001 versus UUO injected with Ctrl-shRNA (n = 5). M, N Immunohistochemical staining for p-EGFR (Tyr845) demonstrated a decreased EGFR phosphorylation in renal tubules after MMP-10 knockdown. Scale bar, 50 µm. Data are presented as the mean ± SEM. ***P < 0.001 versus sham controls (n = 5), ††P < 0.01 versus UUO injected with Ctrl-shRNA (n = 5). O Representative micrographs showed the colocalization of p-EGFR (Red) and β-catenin (Green) in UUO. Scale bar, 50 µm.
Fig. 5
Fig. 5. Depletion of endogenous MMP-10 reduces kidney injury and β-catenin activation after ischemia-reperfusion injury.
A Experimental design. The timing of UIRI surgery, plasmid injection, unilateral nephrectomy, and sacrifice were indicated by red and black arrow or arrowhead as indicated, respectively. B, C Western blotting showed the protein level of MMP-10 in different groups as indicated. Representative Western blotting (B) and quantitative data (C) were shown. Data are presented as the mean ± SEM. **P < 0.01 versus sham controls (n = 5); ††P < 0.01 versus UIRI injected with Ctrl-shRNA (n = 5). D Representative images showed the expression and localization of MMP-10 in the kidney after different treatments. Scale bar, 50 µm. E, F Graphic presentation showed serum creatinine (SCr) and blood urea nitrogen (BUN) levels in three groups as indicated. Data are presented as the mean ± SEM. ***P < 0.001 versus sham controls (n = 5). †††P < 0.001 versus UIRI injected with Ctrl-shRNA (n = 5). G, H Western blotting showed the protein levels of fibronectin, collagen I, α-SMA, and KIM-1 in different groups. Representative Western blotting (G) and quantitative data (H) were shown. Data are presented as the mean ± SEM. *P < 0.05, **P < 0.01, ***P < 0.001 versus sham controls (n = 5); P < 0.05, ††P < 0.01, †††P < 0.001 versus UIRI injected with Ctrl-shRNA (n = 5). I, J Knockdown of MMP-10 ameliorated kidney injury and fibrosis. Renal fibrotic lesions were evaluated using Sirius red staining and immunohistochemical staining for α-SMA. The tubular injury was assessed through immunohistochemical staining for KIM-1. Scale bar, 50 µm. Data are presented as the mean ± SEM. ***P < 0.001 versus sham controls (n = 5), †††P < 0.001 versus UIRI injected with Ctrl-shRNA (n = 5).
Fig. 6
Fig. 6. MMP-10-triggered β-catenin transactivation is dependent on EGFR signaling.
A, B Blockade of EGFR signaling by small molecule inhibitor erlotinib abolished MMP-10-mediated β-catenin transactivation in vitro. Human proximal tubular epithelial cells (HK-2) were treated with rhMMP-10 in the absence or presence of erlotinib as indicated. Representative Western blotting (A) and quantitative data (B) showed the expression levels of p-EGFR (Tyr845), p-ERK1/2 (Thr202/Tyr204), p-GSK-3β (Ser9), and active β-catenin after various treatments. Data are presented as the mean ± SEM. ***P < 0.001 versus controls (n = 6); †††P < 0.001 versus the group with rhMMP-10 treatment alone (n = 6). C Representative micrographs showed fibronectin expression and deposition in HK-2 cells after various treatments. Scale bar, 75 µm. D, E The expression of fibronectin and α-SMA was assessed in HK-2 cells after various treatments. Representative Western blotting (D) and quantitative data (E) were presented. Data are presented as the mean ± SEM. **P < 0.01, ***P < 0.001 versus controls (n = 6); ††P < 0.01, †††P < 0.001 versus rhMMP-10 treatment alone (n = 6). F In vivo experimental design. The timing of UUO surgery, plasmid injection, and oral gavage of erlotinib at dose 40 mg/kg/d or 80 mg/kg/d is indicated, respectively. G Western blotting confirmed the expression of Flag and MMP-10 after Flag-tagged MMP-10 plasmid injection. H Representative micrographs also confirmed the expression and localization of Flag and MMP-10 in three groups as indicated. Scale bar, 50 µm. Representative Western blotting (I) and quantitative data (J) showed the expression levels of p-EGFR (Tyr845), p-ERK (Thr202/Tyr204), p-GSK-3β (Ser9), and active β-catenin in different groups. Data are presented as the mean ± SEM. *P < 0.05, **P < 0.01, ***P < 0.001 versus sham controls (n = 5); P < 0.05, ††P < 0.01, †††P < 0.001 versus UUO plus pcDNA3.1 group (n = 5); #P < 0.05, ##P < 0.01, ###P < 0.001 versus UUO plus pFlag-MMP-10 group (n = 5). K, L Representative micrographs (K) and quantitative data (L) showed immunohistochemical staining for p-EGFR (Tyr845) and β-catenin. Scale bar, 50 µm. Data are presented as the mean ± SEM. *P < 0.05, ***P < 0.001 versus sham controls (n = 5); ††P < 0.01 versus UUO plus pcDNA3.1 group (n = 5); ##P < 0.01, ###P < 0.001 versus UUO plus pFlag-MMP-10 group (n = 5).
Fig. 7
Fig. 7. Inhibition of EGFR signaling blocks exogenous MMP-10-induced fibrotic lesions in UUO.
A Immunohistochemical staining confirmed the co-localization of MMP-10, p-EGFR, and KIM-1 in serial sections of the obstructed kidney after UUO. Arrows indicate positive staining. Scale bar, 50 µm. B, C The expression levels of renal KIM-1 and MMP-7 in different groups were assessed by Western blotting. Data are presented as the mean ± SEM. **P < 0.01, ***P < 0.001 versus sham controls (n = 5); P < 0.05, †††P < 0.001 versus UUO plus pcDNA3.1 group (n = 5); #P < 0.05, ###P < 0.001 versus UUO plus pFlag-MMP-10 group (n = 5). D, E Representative Western blotting (D) and quantitative data (E) showed renal expression of fibronectin and α-SMA in different groups. Data are presented as the mean ± SEM. **P < 0.01, ***P < 0.001 versus sham controls (n = 5); ††P < 0.01 versus UUO plus pcDNA3.1 group (n = 5); #P < 0.05, ##P < 0.01, ###P < 0.001 versus UUO plus pFlag-MMP-10 group (n = 5). F, G Representative micrographs (F) and quantitative data (G) showed renal expression of KIM-1 and fibronectin and fibrotic lesions by Sirius red staining. Scale bar, 50 µm. Data are presented as the mean ± SEM. **P < 0.01, ***P < 0.001 versus sham controls (n = 5); ††P < 0.01 versus UUO plus pcDNA3.1 group (n = 5); ##P < 0.01, ###P < 0.001 versus UUO plus pFlag-MMP-10 group (n = 5).
Fig. 8
Fig. 8. HB-EGF mediates MMP-10-triggered β-catenin transactivation.
A, B Western blot analysis showed the expression of cleaved HB-EGF in HK-2 cells after various treatments. Data are presented as the mean ± SEM. ***P < 0.001 versus negative controls (n = 6); †††P < 0.001 versus the group treated with rhMMP-10 (n = 6). C, D In vitro experiments showed that knockdown of HB-EGF effectively blocked rhMMP-10-induced expression of p-EGFR, p-ERK1/2, p-GSK-3β, active β-catenin and MMP-7. Data are presented as the mean ± SEM. *P < 0.05, **P < 0.01, ***P < 0.001 versus negative controls (n = 6); P < 0.05, ††P < 0.01, †††P < 0.001 versus the group treated with rhMMP-10 (n = 6). E Representative micrographs demonstrated β-catenin activation and nuclear translocation induced by rhMMP-10, which was abolished by knocking down of HB-EGF. Scale bar, 75 µm. F, G Western blotting showed the expression of fibronectin and α-SMA in HK-2 cells after various treatments as indicated. Knockdown of HB-EGF abolished rhMMP-10-induced fibronectin and α-SMA expression. Data are presented as the mean ± SEM. **P < 0.01, ***P < 0.001 versus controls (n = 6); P < 0.05 versus the group treated with rhMMP-10 (n = 6). H Representative immunofluorescence images illustrated the expression levels of fibronectin across all treatment groups. Scale bar, 75 µm. I Re-analysis of an independent study through data mining (GSE193282) revealed that knockout of tubular β-catenin in mice abolished renal MMP-10 expression after UUO. Data are presented as the mean ± SEM. *P < 0.05 versus wild-type controls (n = 3). J, K Transient transfection with a N-terminus-truncated, constitutively activated β-catenin expression vector (pDel-β-cat) induced MMP-10 expression in HK-2 cells. Data are presented as the mean ± SEM. ***P < 0.001 versus pcDNA3 controls (n = 6). L Schematic diagram depicts the potential mechanism of MMP-10 action in kidney fibrosis. Upregulated MMP-10, as a response to injury, cleaves the HB-EGF, leading to its activation, which then activates EGFR and subsequently phosphorylates ERK1/2 and GSK-3β. This cascade of event causes β-catenin accumulation and translocation into the nucleus. Intranuclear β-catenin binds to TCF/LEF and promotes the transcription of its target genes including MMP-10, forming a vicious cycle. In addition, MMP-10 induces the expression of MMP-7 via β-catenin, which enzymatically degrades E-cadherin, liberating more β-catenin and further promoting kidney fibrosis.

Similar articles

Cited by

References

    1. Glassock RJ, Warnock DG, Delanaye P. The global burden of chronic kidney disease: estimates, variability and pitfalls. Nat Rev Nephrol. 2017;13:104–14. - PubMed
    1. Jager KJ, Kovesdy C, Langham R, Rosenberg M, Jha V, Zoccali C. A single number for advocacy and communication-worldwide more than 850 million individuals have kidney diseases. Kidney Int. 2019;96:1048–50. - PubMed
    1. McCullough KP, Morgenstern H, Saran R, Herman WH, Robinson BM. Projecting ESRD incidence and prevalence in the United States through 2030. J Am Soc Nephrol. 2019;30:127–35. - PMC - PubMed
    1. Collaboration GBDCKD. Global, regional, and national burden of chronic kidney disease, 1990-2017: a systematic analysis for the Global Burden of Disease Study 2017. Lancet. 2020;395:709–33. - PMC - PubMed
    1. Kovesdy CP. Epidemiology of chronic kidney disease: an update 2022. Kidney Int Suppl (2011). 2022;12:7–11. - PMC - PubMed

LinkOut - more resources