. 2025 May 17;16(1):4597.
doi: 10.1038/s41467-025-59868-y.

Plasmonic coffee-ring biosensing for AI-assisted point-of-care diagnostics

Affiliations

Plasmonic coffee-ring biosensing for AI-assisted point-of-care diagnostics

Kamyar Behrouzi et al. Nat Commun. .

Abstract

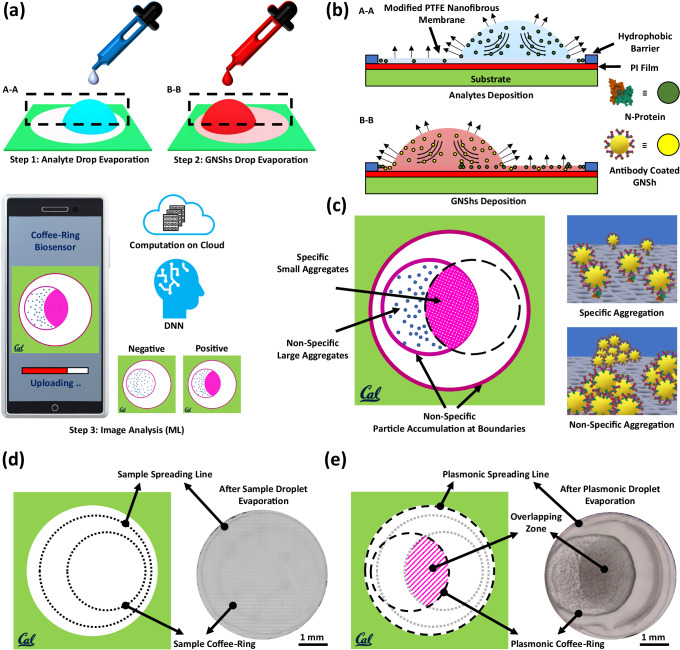
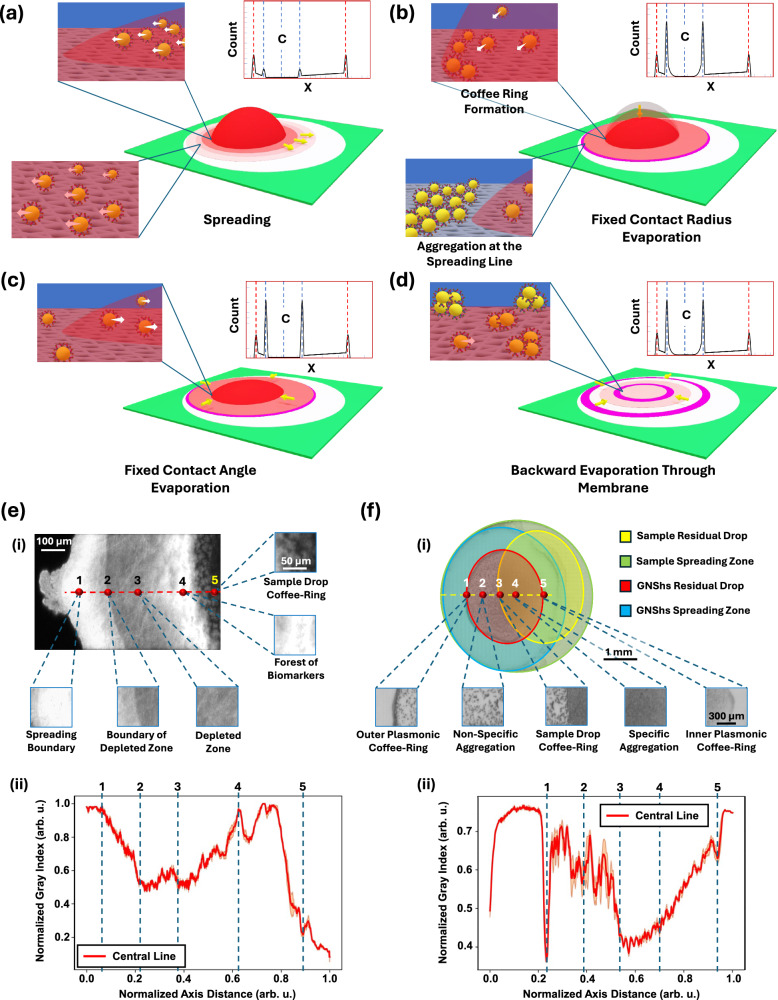
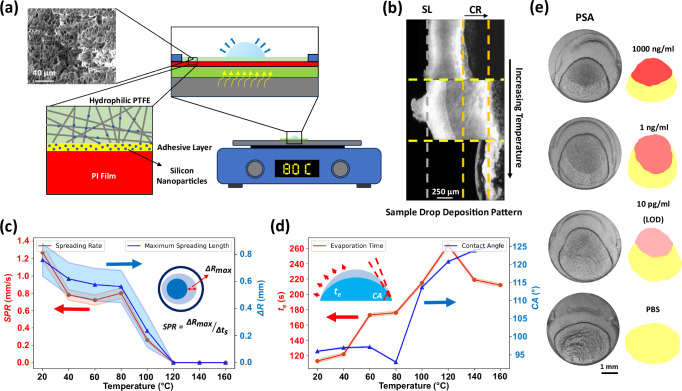
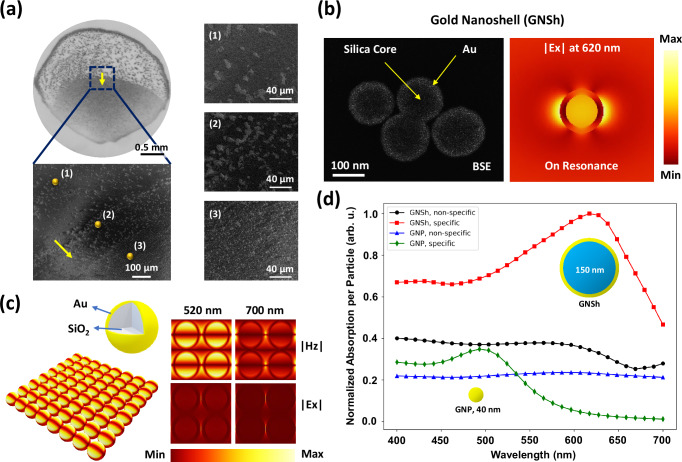
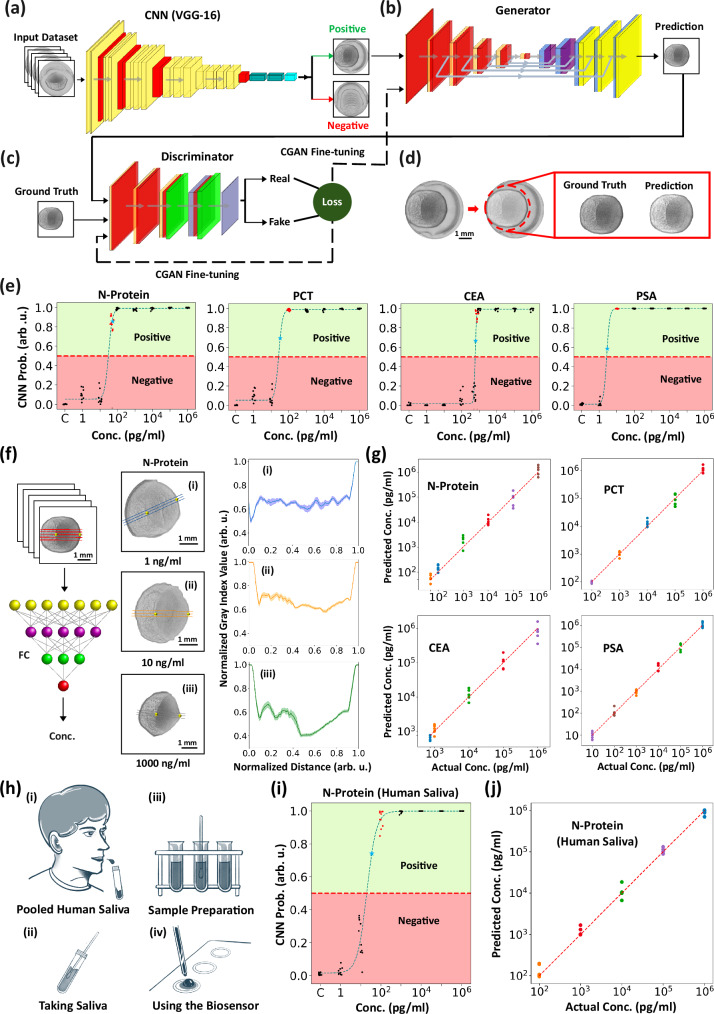
A major challenge in addressing global health issues is developing simple, affordable biosensors with high sensitivity and specificity. Significant progress has been made in at-home medical detection kits, especially during the COVID-19 pandemic. Here, we demonstrated a coffee-ring biosensor with ultrahigh sensitivity, utilizing the evaporation of two sessile droplets and the formation of coffee-rings with asymmetric nanoplasmonic patterns to detect disease-relevant proteins as low as 3 pg/ml, under 12 min. Experimentally, a protein-laden droplet dries on a nanofibrous membrane, pre-concentrating biomarkers at the coffee ring. A second plasmonic droplet with functionalized gold nanoshells is then deposited at an overlapping spot and dried, forming a visible asymmetric plasmonic pattern due to distinct aggregation mechanisms. To enhance detection sensitivity, a deep neural model integrating generative and convolutional networks was used to enable quantitative biomarker diagnosis from smartphone photos. We tested four different proteins, Procalcitonin (PCT) for sepsis, SARS-CoV-2 Nucleocapsid (N) protein for COVID-19, Carcinoembryonic antigen (CEA) and Prostate-specific antigen (PSA) for cancer diagnosis, showing a working concentration range over five orders of magnitude. Sensitivities surpass equivalent lateral flow immunoassays by over two orders of magnitude using human saliva samples. The detection principle, along with the device, and materials can be further advanced for early disease diagnostics.


Conflict of interest statement

Competing interests: The authors declare no competing interests.

Figures

Fig. 1
Fig. 1. The plasmonic coffee-ring biosensor.
a The evaporation of sample and plasmonic nanoparticles droplets on the opposite sides of the membrane, and smartphone image for biosensing. The naked eye can identify the generated positive result and a deep neural network is used to post-process the generated interaction pattern to derive the sample concentration value. The artificial intelligence-based computing can be done either on the cloud or on a local user’s smartphone. b Evaporation induced flow within the sessile droplets pushes nanoparticles towards the boundary for pre-concentration and forms the coffee-ring. The first droplet pre-concentrates and deposits biomarkers on the membrane. The antibody-antigen interaction after the placement of the plasmonic nanoparticles droplet results in a distinguishable asymmetric pattern. c The plasmonic nanoparticle droplet consists of two regions: specific and non-specific zones. In the overlapping area between the two droplets, antibody conjugated GNShs are specifically interacted with proteins to generate the dispersed 2D-like pattern. Outside this specific zone, and within the plasmonic coffee-ring enclosed region, GNShs self-interactions are strong to generate large 3D aggregates and form the non-specific region. d Schematic diagram (left) and experimental optical photo (right) of a sample droplet after the evaporation process. The coffee-ring and initial droplet boundary are barely visible to the naked eye. e Schematic diagram (left) and experimental optical photo (right) of the plasmonic droplet after the evaporation process, where the sample droplet is already deposited on the substrate. The overlapping area of the two droplets shows clearly darker color due to the dispersed 2D-like pattern. The other region of the plasmonic droplet has the non-specific pattern due to the self-interactions of GNShs to generate large 3D aggregates.
Fig. 2
Fig. 2. Evaporation steps.
a Spreading: the droplet spreads within and above the membrane and pushes particles towards the hydrophobic barrier. b Fixed contact radius: as evaporation begins, an internal flow develops within the residual droplet, driving particles toward the edge, forming a coffee-ring pattern. c Fixed contact angle: once the contract angle drops below a certain value (~ 5°), the droplet starts to shrink while maintaining this fixed angle, pulling the remaining particles towards the center. d Backward evaporation: The residual solution within the membrane evaporates inward, with minimal influence on the overall particle deposition pattern. Insets: particle counts where the coffee-ring positions by dashed blue lines, initial droplet boundaries by dashed red lines, and center of the residual droplet by dashed blue line plus C as center. Note, these schematic patterns are based on both our experimental data and theoretical studies. e The sample droplet deposition pattern: (i) confocal microscopy image of the deposition of the sample droplet by using the fluorescent dyes. The high dye concentrations are at the spreading boundary and the coffee-ring of the residual droplet as samples are accumulated in these two places. (ii) Normalized grey index value versus axial distance of the central line passing across the image. (f) The GNShs droplet deposition pattern. (i) Grayscale image shows different areas on the detection zone, including residual sample droplet (yellow), sample spreading zone (green), GNShs residual drop (red), and GNShs spreading zone (blue). The asymmetric pattern at the overlapping area shows the gradual grey index value changes as the plasmonic residual droplet is pushing and interacting with the high concentration samples at the coffee ring of the residual sample droplet. (ii) Normalized grey index value for a central line passing through the plasmonic droplet coffee-ring showing the non-uniformity and the gradient in the overlapping area. Data are reported as mean values ± standard deviations (SD), based on n= 3 sample lines. It is noted that high gray index values imply less particles. These measurements are from the N-Protein at 1000 ng/ml concentration. Note that all experiments were repeated at least three times.
Fig. 3
Fig. 3. Substrate treatment and biosensing assessment.
a The substrate is assembled in layers from bottom to top: a glass slide, double-sided tape, PI film, silicon adhesive, and a hydrophilic nanofibrous PTFE membrane (see Figure S18 for SEM). Thermal treatment modulates the membrane’s wettability by evaporating silicone nanoparticles from the adhesive layer. These nanoparticles attach to the nanofibers, thereby altering the surface properties. b Fluorescent image of the deposited fluorescent dyes for a sample droplet deposited on the membrane under different temperatures. By increasing the temperature, the coffee-ring (CR, dashed orange line) shrinks and moves away from the spreading line (SL, dashed gray line) to enable the desirable high pre-concentration results below a critical temperature. Above the critical temperature, the formation of crystalline objects at the coffee-ring prevents GNShs to access biomarkers (SL and CR lines coalesce at the same position). c The distance between the spreading line and the coffee-ring is defined as the spreading variation. The spreading rate (red color symbols) and maximum spreading distance (blue color symbols) vs. applied temperature shows 80 oC is the critical thermal treatment temperature of the prototype system as the membrane wettability decreases significantly to reduce the spreading of the droplet. d Experimental results of the evaporation time (red color symbols) and contact angle (blue color symbols) vs. temperature. It is found that the contact angle increases significantly above 80 oC implying more hydrophobic behavior. The evaporation time increases with the temperature, since higher thermal treatment leads to less spreading and more solution stays inside the residual droplet, leading to less available surface area for the evaporation. Results are presented as mean values ± SD, based on n= 3 measurements, except contact angle data which is based on the instrument repeatability. e The asymmetric patterns for the PSA protein. By reducing the PSA concentration, the intensity of the specific pattern decreases. Below the LOD, specific and non-specific patterns resemble the control sample (pure buffer). Key features, such as pattern intensity, gradient, higher-order statistics, and coffee-ring intensity, provide both qualitative and quantitative results. Sensing experiments were repeated at least three times.
Fig. 4
Fig. 4. Asymmetric plasmonic pattern.
a The specific and non-specific interactions of GNShs inside and outside of the overlapping zone. Insets: plasmonic nanoparticles inside the specific zone generate dispersed 2D-like pattern due to their interaction with coated proteins; outside the specific zone, GNShs interact with themselves because of insufficient or lack of deposited proteins and forming large aggregates. The image is the detection of N-Protein at 1000 ng/ml concentration. The yellow arrow shows the direction from the outside (point 1) to the inside (point 3) of the overlapping region. b SEM image of GNShs captured in the backscattered electron (BSE) mode to reveal the internal structure. Alongside is the numerically simulated electric field distribution of a 150 nm in diameter GNSh at its resonance frequency. The large particle size and high electric field localization at the metal/dielectric interface make GNShs a more effective candidate for pattern visualization when compared to those of conventional 40 nm in diameter GNPs. c A simplified periodic array analysis of GNShs aggregates at resonance shows that the electric field has been strongly localized in areas between the nanoparticles. d Optical absorption spectrum showing different spectra for specific versus non-specific aggregates. GNShs provides higher effective absorption as compared to those of GNPs. The spectra are scaled to represent per-particle absorption and subsequently normalized to the maximum value across all spectra.
Fig. 5
Fig. 5. Deep neural network-enabled automatic biosensing.
a A CNN based on the VGG-16 architecture classifies the detection zone. It processes grayscale images of the asymmetric pattern to output the probability of a positive diagnosis (see Figure S9 for architecture). b, c A C-GAN automatically segments specific zones. The generator and discriminator are co-trained to optimize performance, with the generator producing segmentation maps resembling manually labeled images. d The network processes detection zone patterns and uses the C-GAN to segment the target area, removing artifacts and noise to facilitate concentration estimation. Three coffee-ring patterns from the same protein concentration are compared to demonstrate the method’s consistency (Figure S27). Network structures and training details are provided in Figures S10–S13. e Biosensor screening performance for N-Protein, PCT, CEA, and PSA protein shows standard LODs (red points) at 50 pg/mL, 100 pg/mL, 750 pg/mL, and 10 pg/mL, respectively. Probabilistic LODs (blue stars) are ~50 pg/mL, ~30 pg/mL, ~650 pg/mL, and ~3 pg/mL (see Supplementary Note for LOD definitions). Note, the blue dashed line shows the logistic regression fit. f An FC regression network predicts concentrations from crossline profiles by extracting features such as intensity, gradient, and coffee-ring patterns to establish a non-linear mapping between these features and concentration. g Predicted versus actual concentrations for four biomarkers (N-Protein, PCT, CEA, PSA) show excellent predictions by the FC network with minimal errors. Variations are due to testing uncertainties and protein degradation. Data are presented as mean ± SD, based on n= 3 crosslines. h The testing procedure involved spiking pooled human saliva diluted in PBS with N-Protein to create test samples. i Screening performance for N-Protein in saliva shows a standard LOD of 100 pg/mL and a probabilistic LOD of 50 pg/mL, outperforming equivalent LFIA tests by over two orders of magnitude (Figure S20). j Predicted versus actual concentrations for N-Protein mixed with human saliva closely match results obtained without saliva. All measurements were repeated at least three times. Concentration quantification was based on n= 5 random samples per concentration. Screening data analysis included n= 10 random samples.

Similar articles

References

    1. Fu, E., Yager, P., Floriano, P. N., Christodoulides, N. & McDevitt, J. T. Perspective on Diagnostics for Global Health. IEEE Pulse2, 40–50 (2011). - PMC - PubMed
    1. Health, T. L. G. Essential diagnostics: mind the gap. Lancet Glob. Heal.9, e1474 (2021). - PMC - PubMed
    1. Yadav, H., Shah, D., Sayed, S., Horton, S. & Schroeder, L. F. Availability of essential diagnostics in ten low-income and middle-income countries: results from national health facility surveys. Lancet Glob. Heal.9, e1553–e1560 (2021). - PMC - PubMed
    1. Engel, N. et al. Addressing the challenges of diagnostics demand and supply: insights from an online global health discussion platform. BMJ Glob. Heal.1, e000132 (2016). - PMC - PubMed
    1. Melander, D., Sivarasu, S., Yekinni, I., Yunzhang, C. & Erdman, A. Diagnostics as the Key to Advances in Global Health: Proposed Methods for Making Reliable Diagnostics Widely Available, J. Med. Device. 14, 014702 (2020). - PMC - PubMed