. 2025 May 17;16(1):4607.
doi: 10.1038/s41467-025-59780-5.

CREATE: cell-type-specific cis-regulatory element identification via discrete embedding

Affiliations

CREATE: cell-type-specific cis-regulatory element identification via discrete embedding

Xuejian Cui et al. Nat Commun. .

Abstract

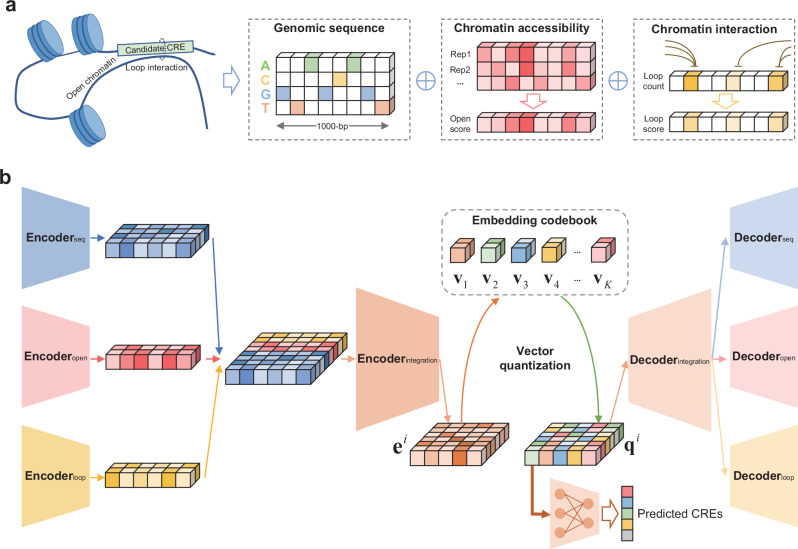
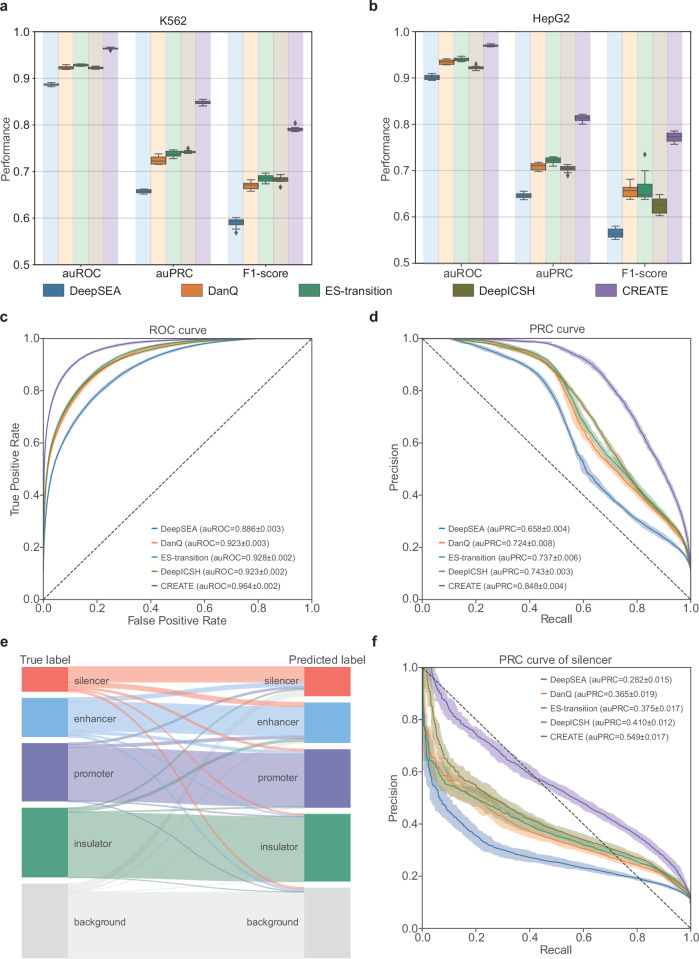
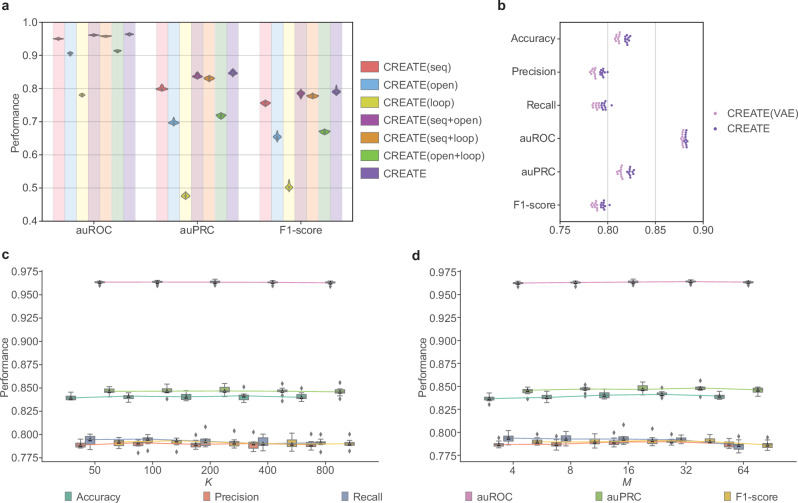
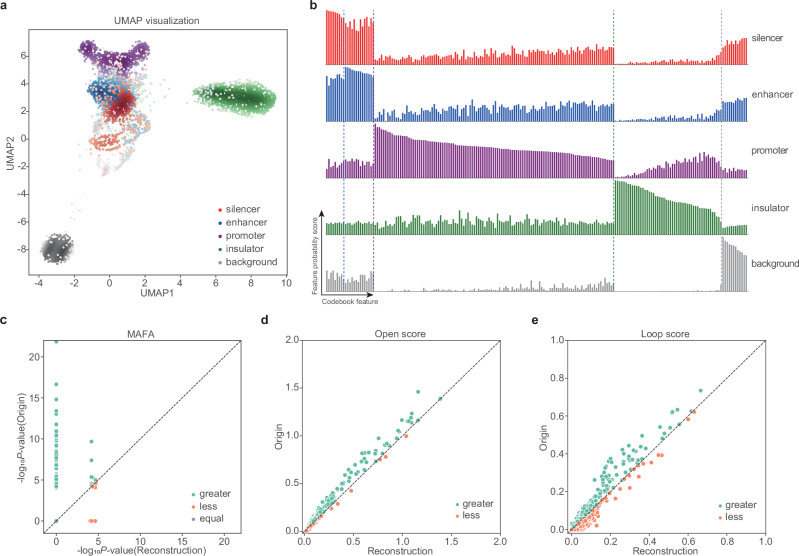
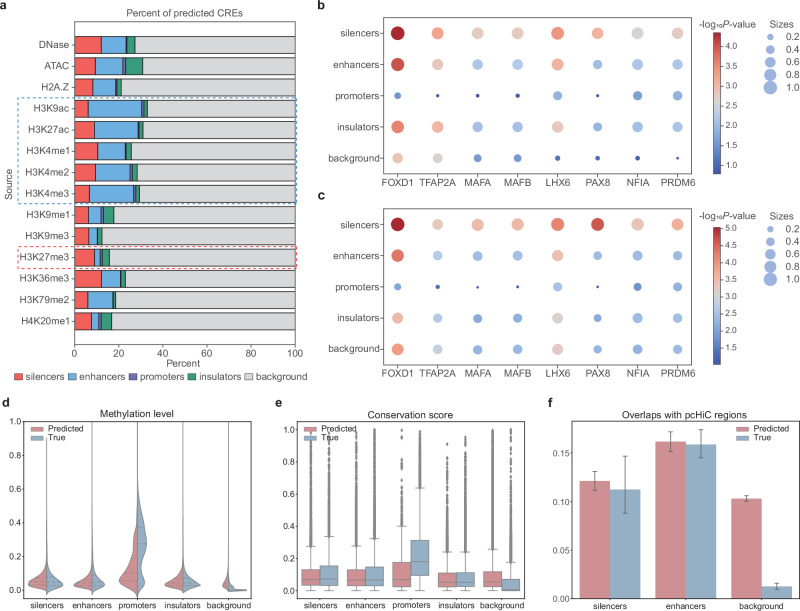
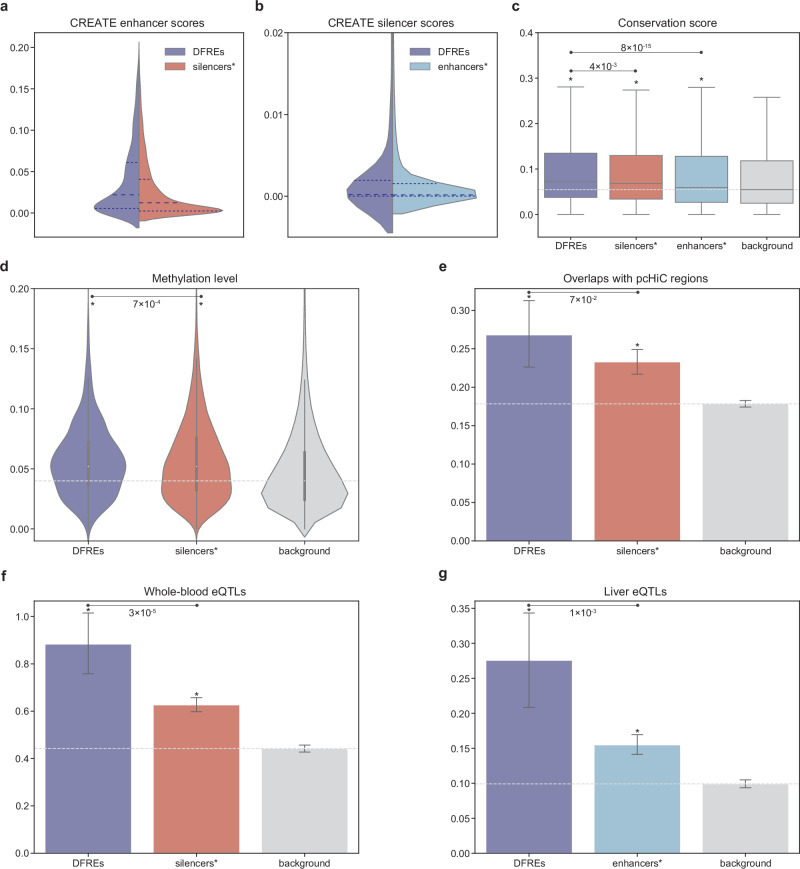
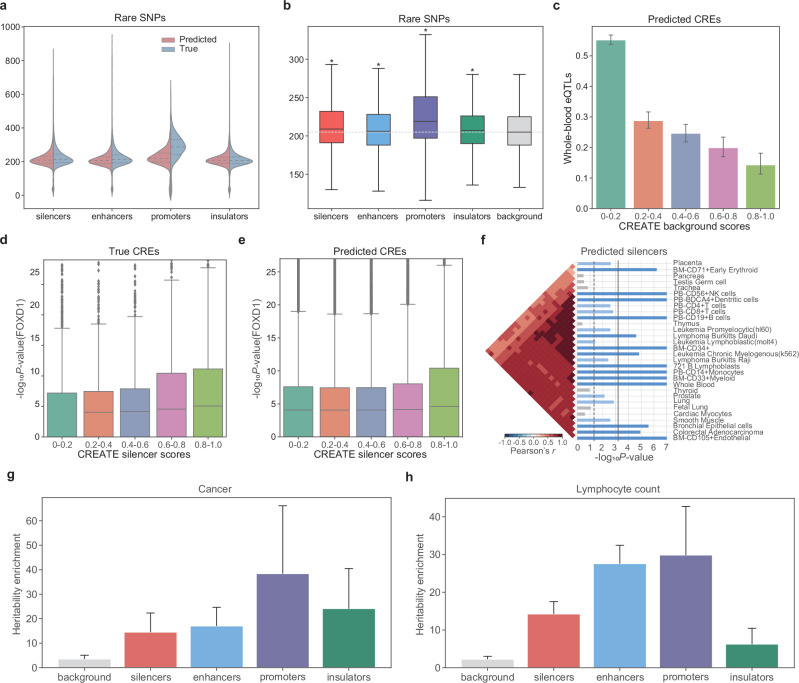
Cis-regulatory elements (CREs), including enhancers, silencers, promoters and insulators, play pivotal roles in orchestrating gene regulatory mechanisms that drive complex biological traits. However, current approaches for CRE identification are predominantly sequence-based and typically focus on individual CRE types, limiting insights into their cell-type-specific functions and regulatory dynamics. Here, we present CREATE, a multimodal deep learning framework based on Vector Quantized Variational AutoEncoder, tailored for comprehensive CRE identification and characterization. CREATE integrates genomic sequences, chromatin accessibility, and chromatin interaction data to generate discrete CRE embeddings, enabling accurate multi-class classification and robust characterization of CREs. CREATE excels in identifying cell-type-specific CREs, and provides quantitative and interpretable insights into CRE-specific features, uncovering the underlying regulatory codes. By facilitating large-scale prediction of CREs in specific cell types, CREATE enhances the recognition of disease- or phenotype-associated biological variabilities of CREs, thus advancing our understanding of gene regulatory landscapes and their roles in health and disease.


Conflict of interest statement

Competing interests: The authors declare no competing interests.

Figures

Fig. 1
Fig. 1. Overview of CREATE.
a The input of CREATE model. CREATE takes as input the genomic sequence, chromatin accessibility score and chromatin interaction score. b The architecture of CREATE model. CREATE consists of encoders, a vector quantization module and decoders. The encoder module of CREATE combines encoders for multiple input-specific learning and an encoder for multiple input integration. For the i-th CRE, the encoder outputs the latent embedding ei of dimension L′ × D′. By adapting split quantization, the latent embedding will be split into L′ × M vectors el,ji of dimension D and then quantized to ql,ji for the i-th CRE using embedding codebook with the size of K.
Fig. 2
Fig. 2. Evaluation of CREATE compared with the baseline methods.
a, b Boxplot of 10-fold cross-validation classification performance (n = 10) evaluated by auROC, auPRC and F1-score on K562 cell type (a) and HepG2 cell type (b). Each box plot ranges from the upper to lower quartiles with the median as the horizontal line, whiskers extend to 1.5 times the interquartile range, and points represent outliers. Receiver Operating Characteristic curve (c) and Precision-Recall curve (d) comparing CREATE and baseline methods on K562 cell type. e The mapping between true CRE labels and CREATE-predicted CRE labels on the testing data in one of the 10-fold cross-validation experiments of K562 cell type. f Precision-Recall curve comparing CREATE and baseline methods for silencers in K562 cell type. The mean and standard error of auROC or auPRC are reported in the legend. The confidence band shows ±1 s.d. for the averaged curve.
Fig. 3
Fig. 3. Effectiveness and robustness of CREATE.
a Violin plot of 10-fold cross-validation classification performance (n = 10) evaluated by auROC, auPRC and F1-score for model ablation of CREATE on K562 cell type. b Swarm plot of classification performance evaluated by accuracy, precision, recall, auROC, auPRC and F1-score for CREATE compared with CREATE (VAE) on K562 cell type. c Classification performance of CREATE under different values of K (size of codebook) on K562 cell type (n = 10). d Classification performance of CREATE under different values of M (time of split quantization) on K562 cell type (n = 10). Each box plot ranges from the upper to lower quartiles with the median as the horizontal line, whiskers extend to 1.5 times the interquartile range, and points represent outliers.
Fig. 4
Fig. 4. Generation and interpretation of CRE-specific feature spectrum.
a UMAP visualization of the CRE embeddings from CREATE on the testing data in one of the tenfold cross-validation experiments of K562 cell type. b CRE-specific feature spectrum. There is a distinct set of specific features that are enriched or depleted in the feature spectrum of each CRE on K562 cell type. c Comparison of MAFA motif enrichment significance (-log10P-value) between original input and reconstructed output when information derived from the major feature in the silencer-specific feature spectrum of K562 cell type is removed by zeroing it out before passing the CRE embeddings again through the decoder. P-value is from the tool FIMO (see section “Methods”). d Comparison of open scores between original input and reconstructed output when information derived from the major feature in the silencer-specific feature spectrum of K562 cell type is removed. e Comparison of loop scores between original input and reconstructed output when information derived from the major feature in the silencer-specific feature spectrum of K562 cell type is removed.
Fig. 5
Fig. 5. Characteristics of predicted CREs by CREATE.
a Percentage of predicted CREs and background regions from different candidate sources in K562 cell type. Candidate source indicates which type of chromatin accessible or histone modification peaks the candidate regions originates from. Bubble plot of motif enrichment significance (-log10P-value) of repressive TFs (silencer-related TFs) at true CREs (b) and predicted CREs (c) on K562 cell type. The legend title “Sizes” represents the proportion of CREs significantly enriched with motifs of the tested TF (P-value < 0.01). P-value is from the tool FIMO (see e section “Methods”). d Violin plot of methylation levels at true CREs and predicted CREs on K562 cell type. Each violin plot contains three horizontal dashed lines denoting the median, the upper quartile, and the lower quartile. e Box plot of conservation scores at true CREs and predicted CREs on K562 cell type. Each box plot ranges from the upper to lower quartiles with the median as the horizontal line, whiskers extend to 1.5 times the interquartile range, and points represent outliers. f Bar plot of the number of pcHiC regions overlapping with true and predicted silencers, enhancers and background regions on K562 cell type. The error bars denote the 95% confidence interval, and the centers of error bars denote the average value. About predicted CREs, there are 26,012 silencers, 29,423 enhancers, 2057 promoters, 10,558 insulators, and 202,209 background regions (df). About true CREs, there are 6754 silencers, 10,528 enhancers, 15,699 promoters, 18,631 insulators, 20,000 background regions (df).
Fig. 6
Fig. 6. Characterization of DFREs functioning as silencers in K562 and as enhancers in HepG2.
a Violin plot of the enhancer scores predicted by CREATE in K562 for DFREs and normal silencers (silencers*). b Violin plot of the silencer scores predicted by CREATE in HepG2 for DFREs and normal enhancers (enhancers*). Each violin plot contains three horizontal dashed lines denoting the median, the upper quartile, and the lower quartile. c Box plot of conservation scores at DFREs (n = 2409), normal silencers (silencers*) (n = 23,603), normal enhancers (enhancers*) (n = 36,448) and background regions (n = 202,209) in K562. The asterisks above the boxes indicate the significant enrichments compared with background regions. (∗) One-sided Wilcoxon rank-sum test P-value < 2e-31. Each box plot ranges from the upper to lower quartiles with the median as the horizontal line, whiskers extend to 1.5 times the interquartile range. d Violin plot of methylation levels at DFREs, normal silencers (silencers*) and background regions in K562. (∗) One-sided Wilcoxon rank-sum test P-value < 2e-6. Each box plot in violin ranges from the upper to lower quartiles with the median as the horizontal line, and whiskers extend to 1.5 times the interquartile range. e Bar plot of the number of pcHiC regions overlapping with DFREs, normal silencers (silencers*) and background regions in K562. (∗) One-sided Wilcoxon rank-sum test P-value < 2e-3. f Bar plot of the number of whole-blood eQTLs located in DFREs, normal silencers (silencers*) and background regions in K562. (∗) One-sided Wilcoxon rank-sum test P-value < 5e-21. g Bar plot of the number of liver eQTLs located in DFREs, normal enhancers (enhancers*) and background regions in HepG2. (∗) One-sided Wilcoxon rank-sum test P-value < 2e-6. The error bars denote the 95% confidence interval, and the centers of error bars denote the average value.
Fig. 7
Fig. 7. Identification of the biological variability of CREs by CREATE.
a Violin plot of the number of rare SNPs within true CREs and predicted CREs on K562 cell type. Each violin plot contains three horizontal dashed lines denoting the median, the upper quartile, and the lower quartile. b Box plot the number of rare SNPs within predicted CREs and background regions on K562 cell type. The asterisks above the boxes indicate the significant enrichments compared with the background regions. (∗) One-sided Wilcoxon rank-sum test P-value < 2e-9. There are 26,012 predicted silencers, 29,423 predicted enhancers, 2057 predicted promoters, 10,558 predicted insulators, and 202,209 predicted background regions. Each box plot ranges from the upper to lower quartiles with the median as the horizontal line, whiskers extend to 1.5 times the interquartile range. c Correlation between the CREATE background scores and the number of whole-blood eQTLs within predicted CREs on K562 cell type. Correlation between the CREATE silencer scores and the motif enrichment significance (-log10P-value) of FOXD1 at true CREs (d) and predicted CREs (e) on K562 cell type. P-value is from the tool FIMO (see section “Methods”). Each box plot ranges from the upper to lower quartiles with the median as the horizontal line, whiskers extend to 1.5 times the interquartile range, and points represent outliers. f Top 30 significantly enriched tissues in SNPsea analysis on predicted silencers of K562 cell type. The vertical dashed line represents the one-sided P-value cutoff at the 0.05 level, while the solid line denotes the cutoff at 0.05 level for the one-sided P-value with Bonferroni correction. Each plot also contains the ordered expression profiles using hierarchical clustering with unweighted pair-group method with arithmetic means, and the Pearson correlation coefficients indicating the correlation between profiles. Heritability enrichments estimated by LDSC within predicted CREs and background regions identified by CREATE for blood-related traits including cancer (g) and lymphocyte count (h). The error bars denote jackknife standard errors over 200 equally sized blocks of adjacent SNPs about the estimates of enrichment, and the centers of error bars represent the average value.

Similar articles

References

    1. Berger, S. L. The complex language of chromatin regulation during transcription. Nature447, 407–412 (2007). - PubMed
    1. Lee, T. I. & Young, R. A. Transcriptional regulation and its misregulation in disease. Cell152, 1237–1251 (2013). - PMC - PubMed
    1. Maston, G. A., Evans, S. K. & Green, M. R. Transcriptional regulatory elements in the human genome. Annu. Rev. Genomics Hum. Genet.7, 29–59 (2006). - PubMed
    1. Chatterjee, S. & Ahituv, N. Gene regulatory elements, major drivers of human disease. Annu. Rev. Genomics Hum. Genet.18, 45–63 (2017). - PubMed
    1. Klemm, S. L., Shipony, Z. & Greenleaf, W. J. Chromatin accessibility and the regulatory epigenome. Nat. Rev. Genet.20, 207–220 (2019). - PubMed

LinkOut - more resources