. 2025 May 17;15(1):17192.
doi: 10.1038/s41598-025-00744-6.

Antiviral potential of diosmin against influenza A virus

Affiliations

Antiviral potential of diosmin against influenza A virus

Umarqayum AbuBakar et al. Sci Rep. .

Abstract

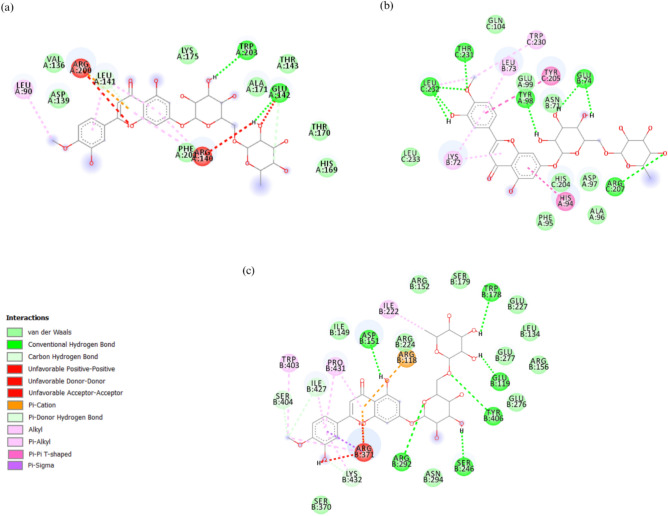
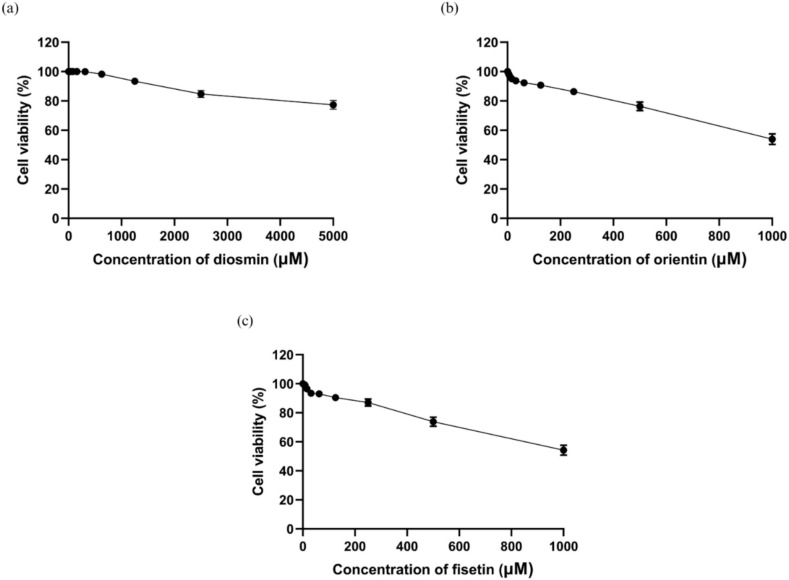
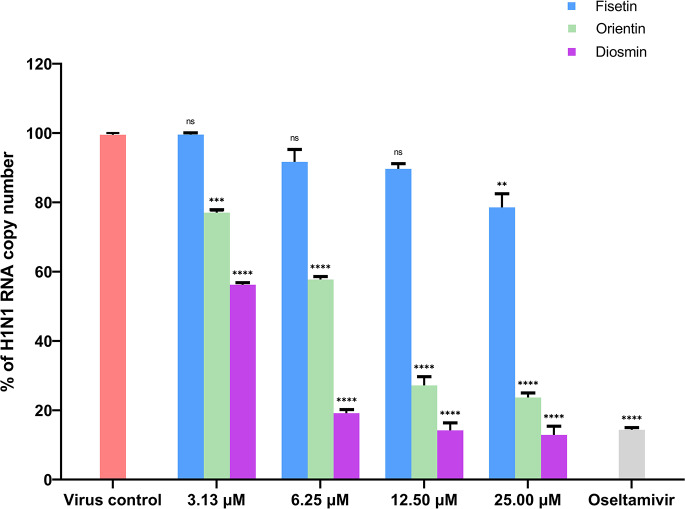
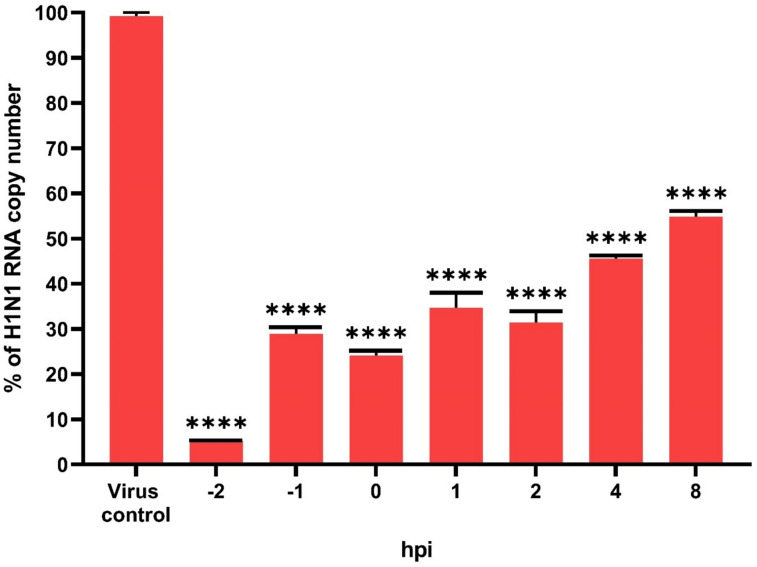
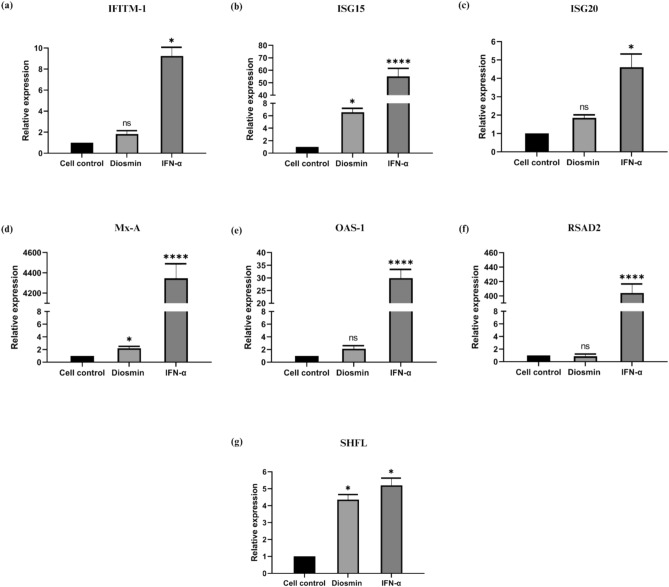
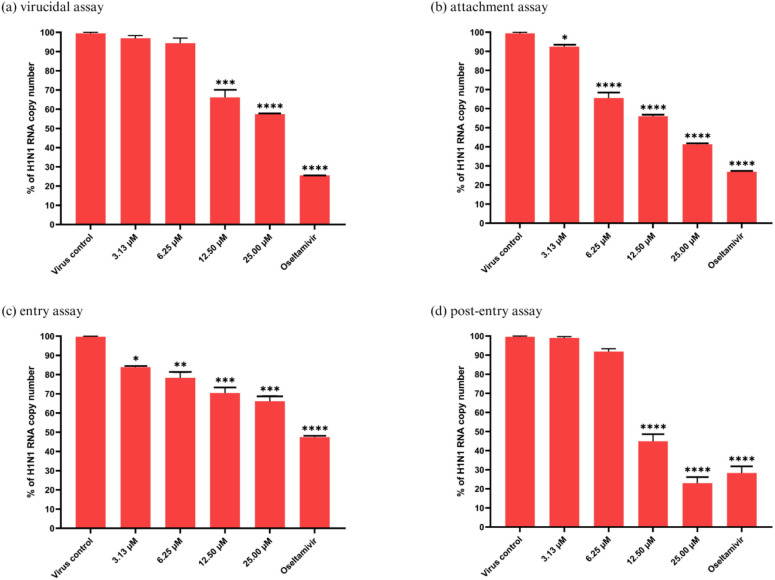
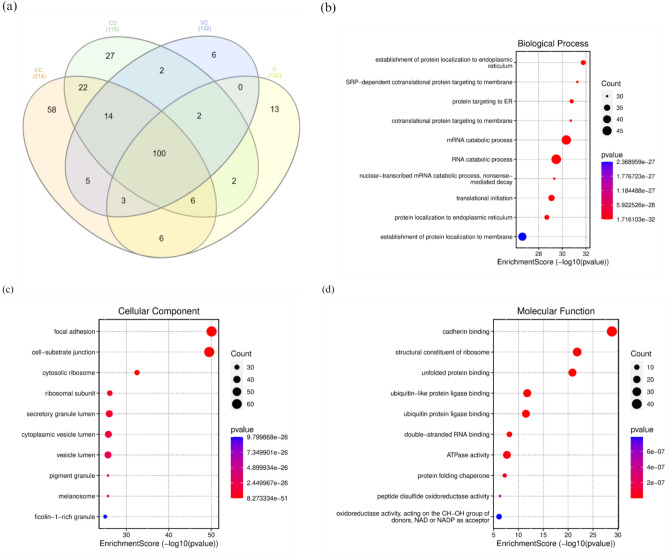
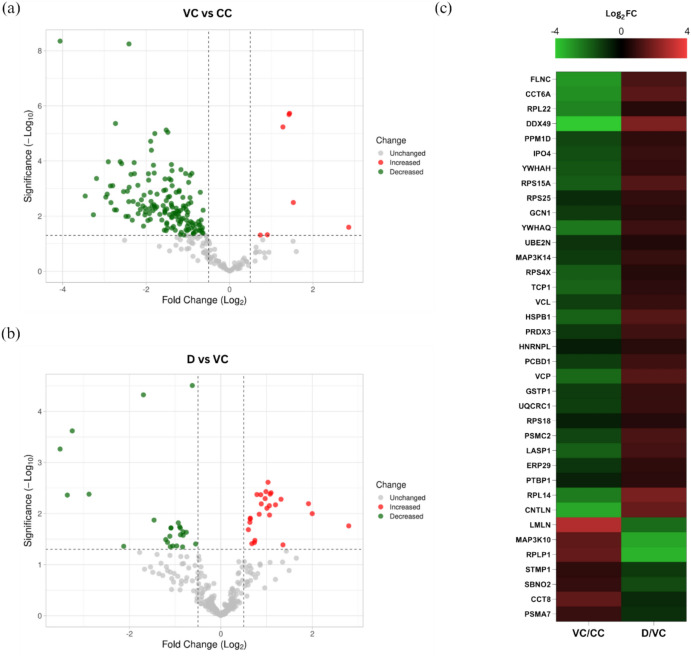
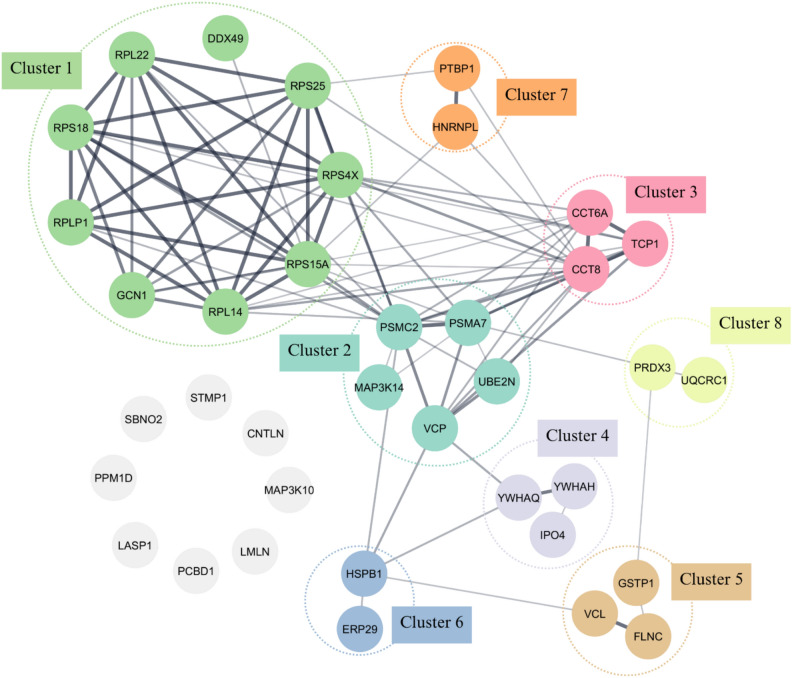
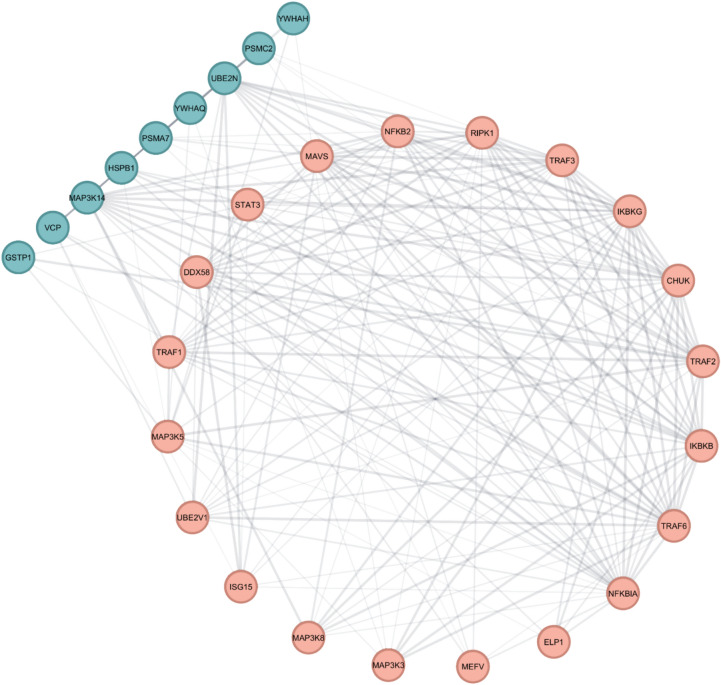
Influenza poses a global health threat. With drug-resistant strains emerging, there is an urgent need for effective antiviral drugs. This study explores antiviral potential of flavonoids against influenza A virus (IAV) and their mechanism of action. By utilizing in silico docking as a screening approach, diosmin, orientin, and fisetin were identified as flavonoids with the strongest interactions with viral proteins. Out of them, diosmin was found to effectively inhibit IAV replication in vitro, particularly at the attachment and post-entry stages, with significant inhibition observed at 0-h post-infection (hpi) and 2 hpi, while also demonstrated prophylactic activity, peaking at - 2 hpi. Following that, diosmin significantly increases the expression of antiviral genes, which may relate to the discovery of its prophylactic activity. Proteomics analysis showed that diosmin treatment during the post-entry stage of IAV replication reduced viral protein levels, confirming its antiviral activity at this point. Additionally, diosmin also modulated host proteins related to innate immunity, inducing type I interferon and anti-inflammatory responses during the infection. These findings provide preliminary evidence of diosmin's antiviral and prophylactic activity against IAV, paving the way for further research on its mechanism of action.


Conflict of interest statement

Declarations. Competing interests: The authors declare no competing interests.

Figures

Fig. 1
Fig. 1
2D interaction diagram of diosmin with the contact residues of all three IAV proteins (HA, NA and NS1) as obtained by Discovery Studio Visualization tools. (a) NS1-diosmin, (b) HA-diosmin and (c) NA-diosmin complexes.
Fig. 2
Fig. 2
Cytotoxic effects of (a) diosmin, (b) orientin, and (c) fisetin in A549 cells. Serial dilutions of flavonoids were prepared in DMEM supplemented with 2% FBS, and A549 cells were exposed to these diluted flavonoids for a duration of 72 h. The cytotoxicity of each flavonoid was assessed using the MTS assay, and the absorbance at 490 nm was measured using a microplate reader. The presented data represent the mean ± standard error of the mean (SEM), with error bars indicating the range of values obtained from three independent experiments.
Fig. 3
Fig. 3
The percentage of H1N1 RNA copy number from virus control (infected A549 cells without treatment), fisetin, orientin, diosmin and oseltamivir (positive control) treatment groups obtained from primary antiviral screening. The data is presented as mean ± SEM, with error bars indicating the range of values observed in three independent experiments. *p < 0.05, **p < 0.01, ***p < 0.001, ****p < 0.0001 indicate a significant difference compared to the virus control, while “ns” represents a non-significant difference, analyzed by the t-test.
Fig. 4
Fig. 4
The percentage of H1N1 RNA copy number from virus control (infected A549 cells without treatment) and diosmin-treated samples obtained from the time-of-addition assay. The data is presented as mean ± SEM, with error bars indicating the range of values observed in three independent experiments. “hpi” represents hour/hours post-infection, while ****p < 0.0001 indicates a significant difference compared to virus control, analyzed by the t-test.
Fig. 5
Fig. 5
The relative quantification of expressed genes from cells treated with diosmin and IFN-α (positive control) in comparison with cell control (cells without treatment). The levels of gene expression were normalized to the cell control. β-actin was used as the reference gene. The data is presented as mean ± SEM, with error bars indicating the range of values observed in three independent experiments. *p < 0.05, ****p < 0.0001 indicate a significant difference compared to the cell control, while “ns” represents a non-significant difference, analyzed by the t-test.
Fig. 6
Fig. 6
The percentage of H1N1 RNA copy number from virus control (infected A549 cells without treatment), diosmin and oseltamivir (positive control) treatment groups obtained from (a) virucidal, (b) attachment, (c) entry and (d) post-entry assays. *p < 0.05, **p < 0.01, ***p < 0.001, ****p < 0.0001 indicate a significant difference compared to the virus control.
Fig. 7
Fig. 7
Host proteins (a) identified in the untreated cells (CC), cells treated with diosmin (CD), IAV-infected cells (VC) and IAV-infected cells treated with diosmin (D). Gene ontology (GO) enrichment analysis of 266 proteins identified in all groups; encompassing analysis of (b) biological processes, (c) cellular components, and (d) molecular functions.
Fig. 8
Fig. 8
Volcano plot of significant host DEPs of (a) VC/CC and (b) D/VC group, with a threshold of log2FC value (≤ − 0.5 or ≥ 0.5) and a − log P value (> 1.3). (c) Heatmap of 37 significant DEPs. Green indicates downregulated DEPs and red represents upregulated DEPs.
Fig. 9
Fig. 9
PPI network of all DEPs between D and VC retrieved from STRING and visualized using Cytoscape. In this network, nodes represented DEPs, wherein the nodes in the same cluster demonstrated the same color, except nodes with grey color represented proteins that did not belong to any cluster. Edges indicated the interactions between the DEPs, with line thickness signifying the confidence level of the interactions. A thicker line indicates a greater level of confidence in predicting the interaction.
Fig. 10
Fig. 10
Interaction between DEPs of D/VC and proteins involved in innate immune system retrieved from STRING and InnateDB, before visualized in CYTOSCAPE. The nodes represent proteins, where the nodes with turquoise color represent D/VC DEPs and the nodes with orange color represent proteins involved in innate immune system (InnateDB interactors). The lines connecting the nodes indicate the association between the proteins. The thicker the line, the higher the degree of confidence prediction of the interaction.

Similar articles

References

    1. Vaidya, B. et al. Effectiveness of periodic treatment of quercetin against influenza A virus H1N1 through modulation of protein expression. J. Agric. Food Chem.64, 4416–4425. 10.1021/acs.jafc.6b00148 (2016). - PubMed
    1. Spreeuwenberg, P., Kroneman, M. & Paget, J. Reassessing the global mortality burden of the 1918 influenza pandemic. Am. J. Epidemiol.187, 2561–2567. 10.1093/aje/kwy191 (2018). - PMC - PubMed
    1. Eccleston-Turner, M., Phelan, A. & Katz, R. Preparing for the next pandemic—The WHO’s global influenza strategy. N. Engl. J. Med.381, 2192–2194. 10.1056/NEJMp1905224 (2019). - PubMed
    1. Iuliano, A. D. et al. Estimates of global seasonal influenza-associated respiratory mortality: A modelling study. Lancet391, 1285–1300. 10.1016/s0140-6736(17)33293-2 (2018). - PMC - PubMed
    1. James, S. H. & Whitley, R. J. in Infectious Diseases. 4th edn (eds Jonathan Cohen, William G. Powderly, & Steven M. Opal) 1465–1471.e1461 (Elsevier, 2017).

LinkOut - more resources