

Poisson random measure noise-induced coherence in epidemiological priors informed deep neural networks to identify the intensity of virus dynamics
- PMID: 40382439
- PMCID: PMC12085636
- DOI: 10.1038/s41598-025-94086-y
Poisson random measure noise-induced coherence in epidemiological priors informed deep neural networks to identify the intensity of virus dynamics
Abstract
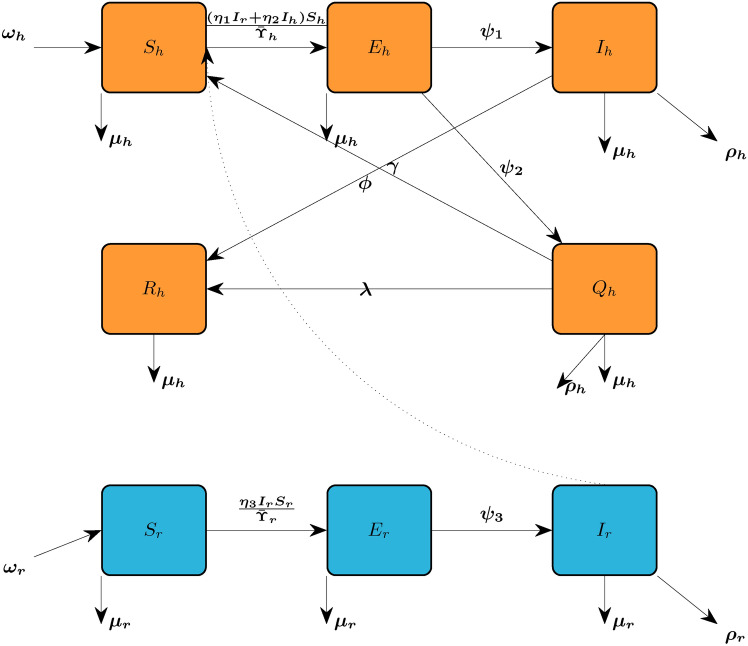
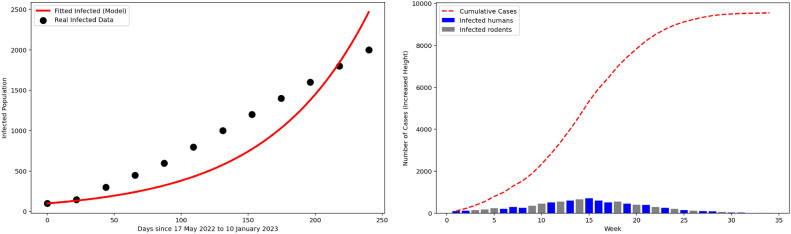
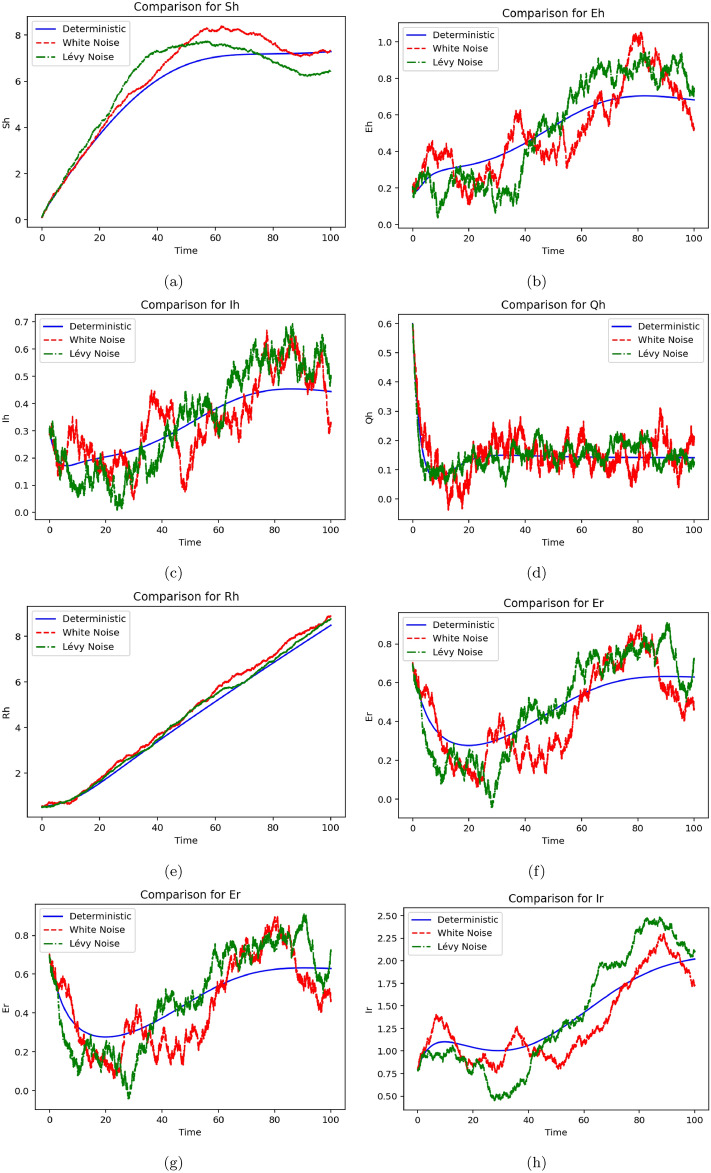
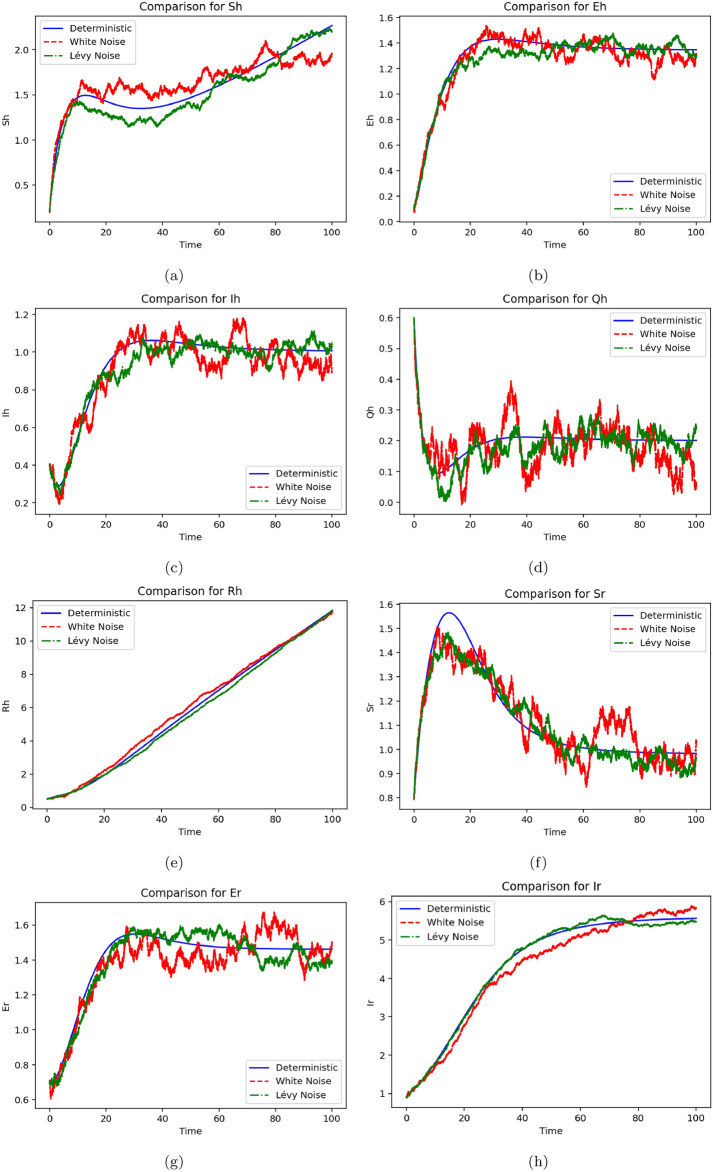
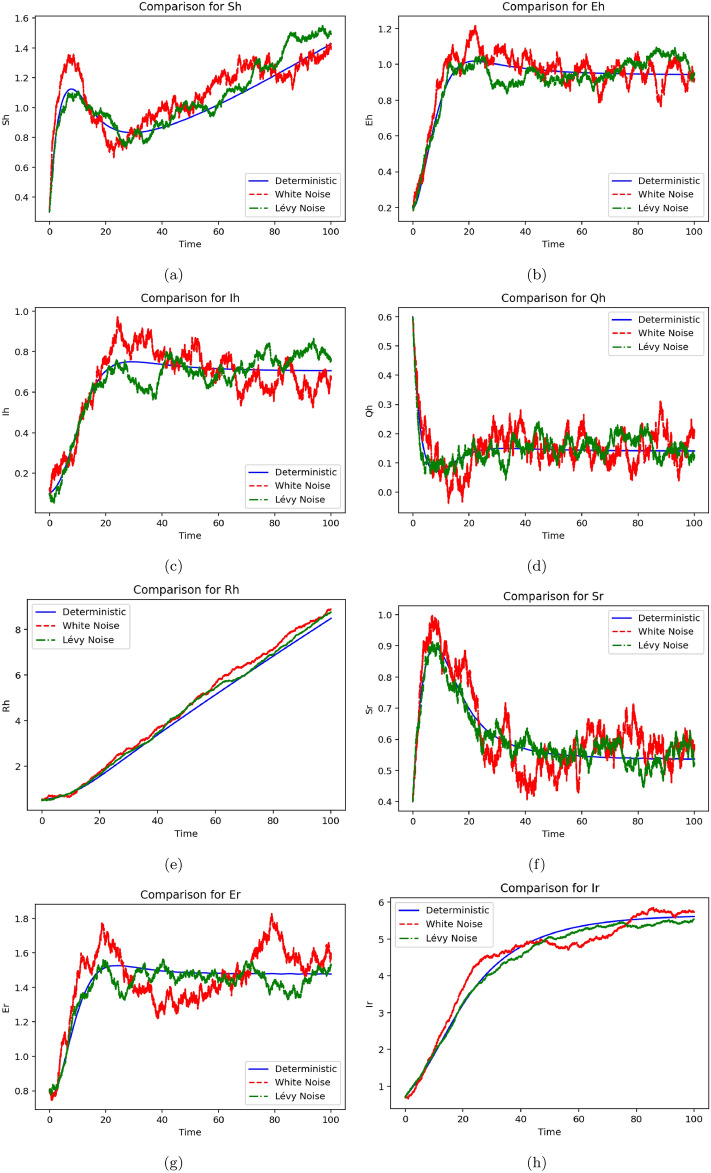
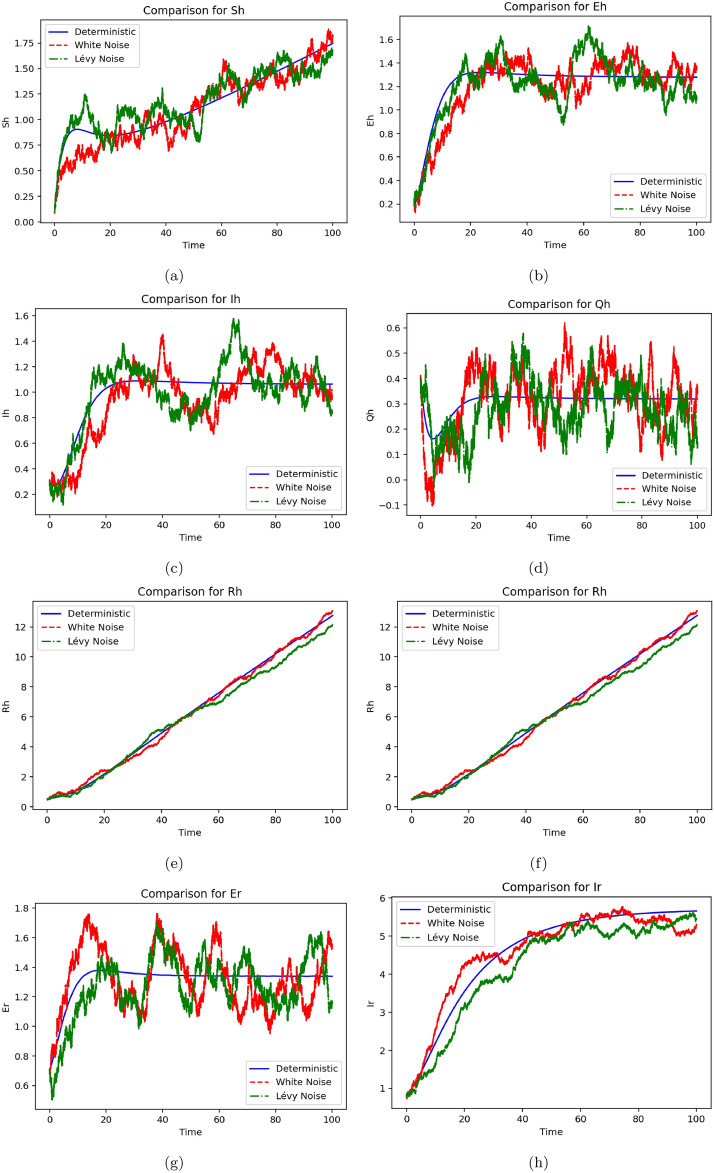
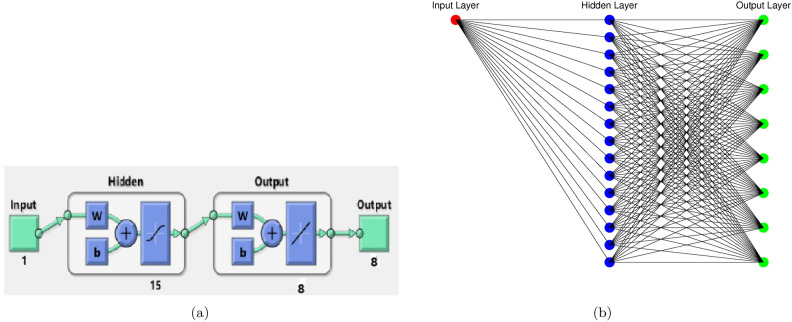
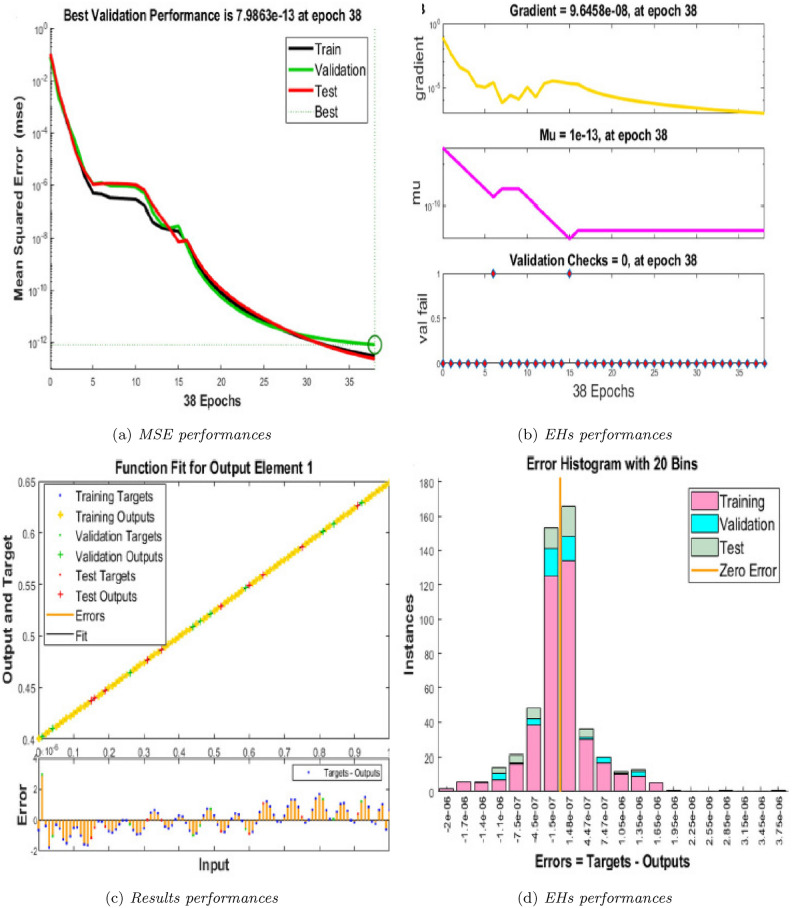
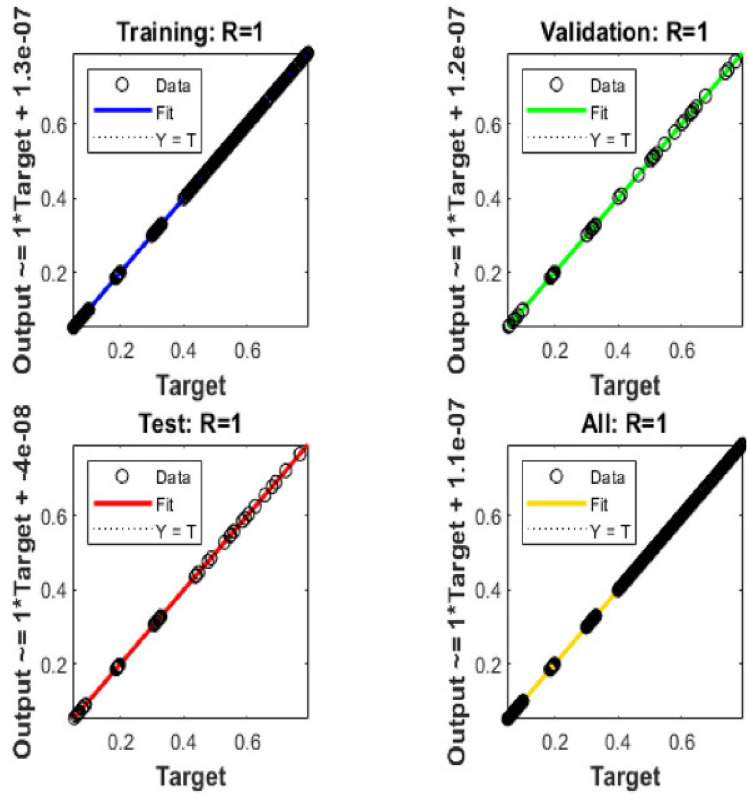
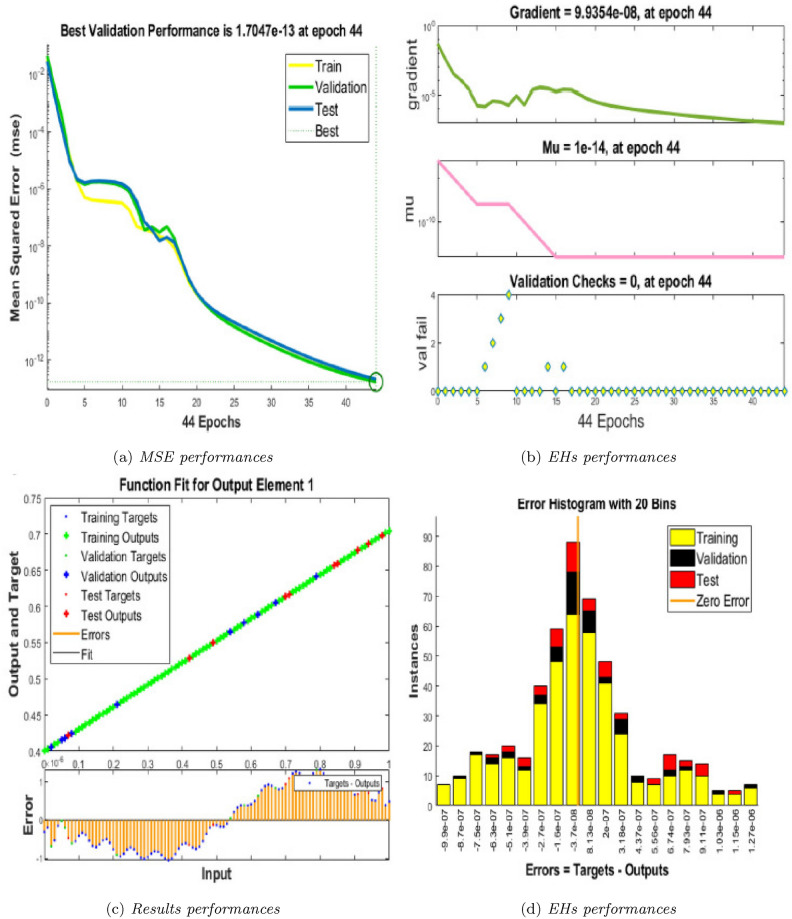
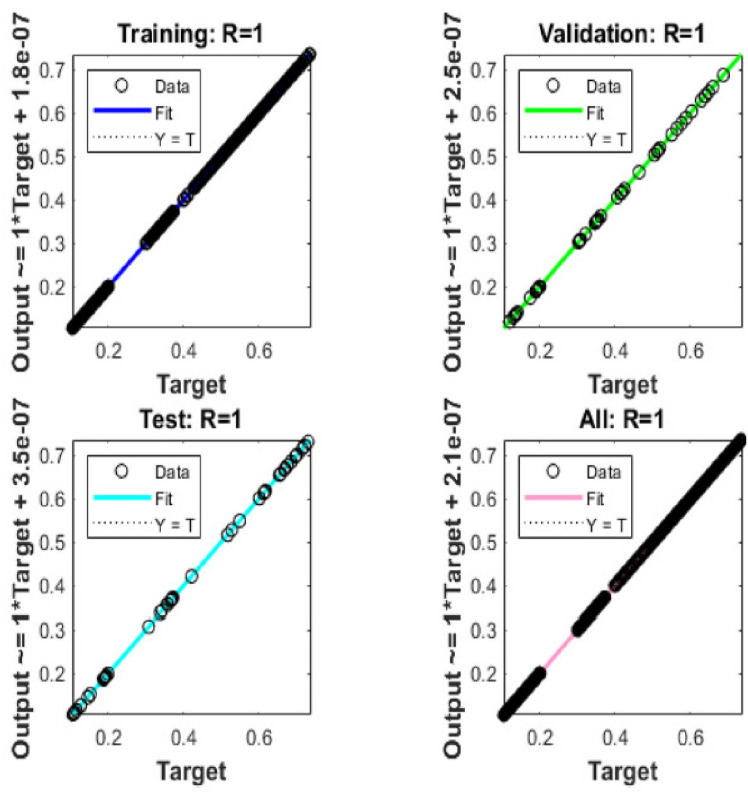
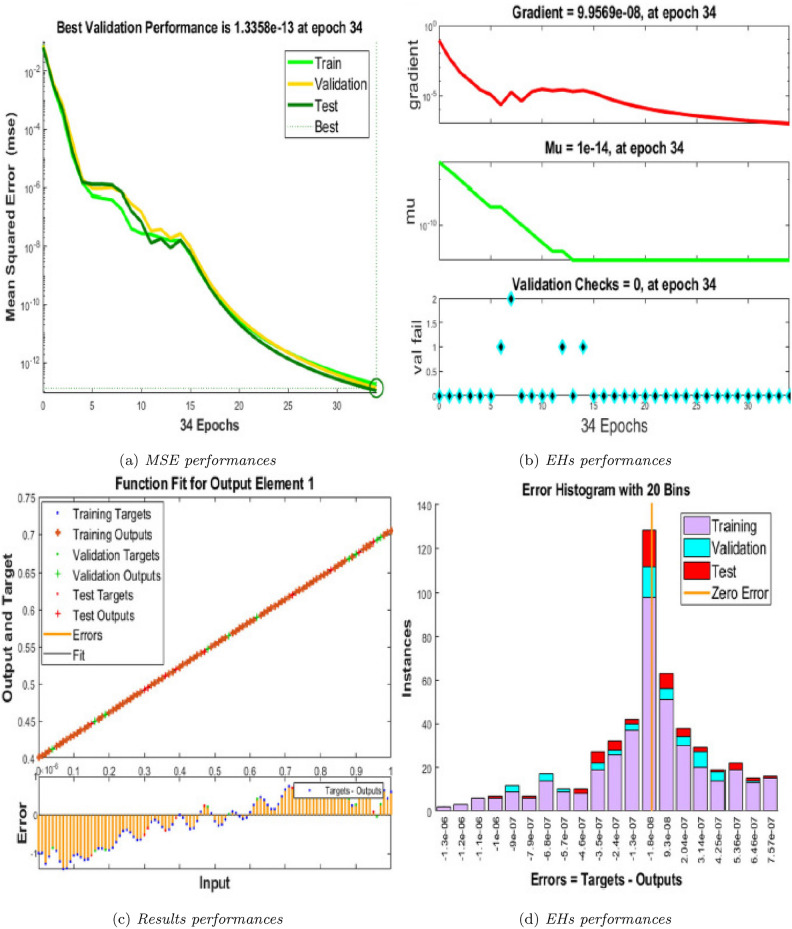
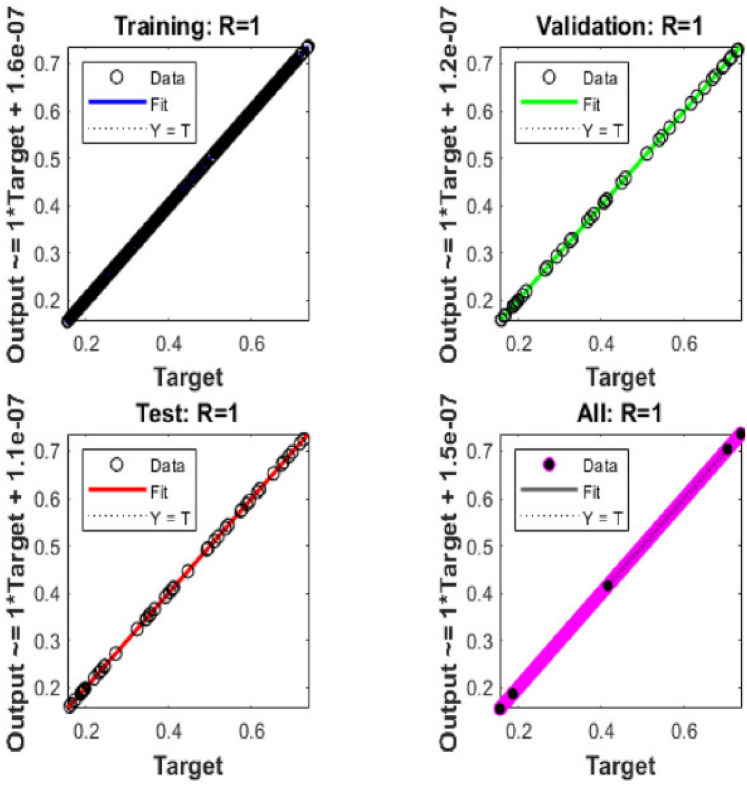
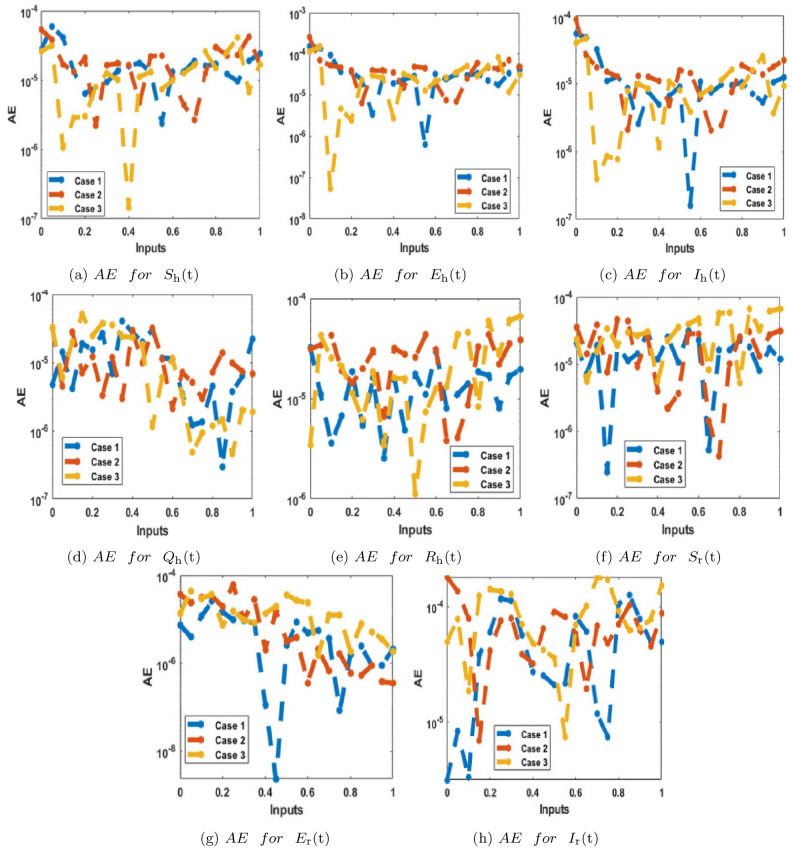
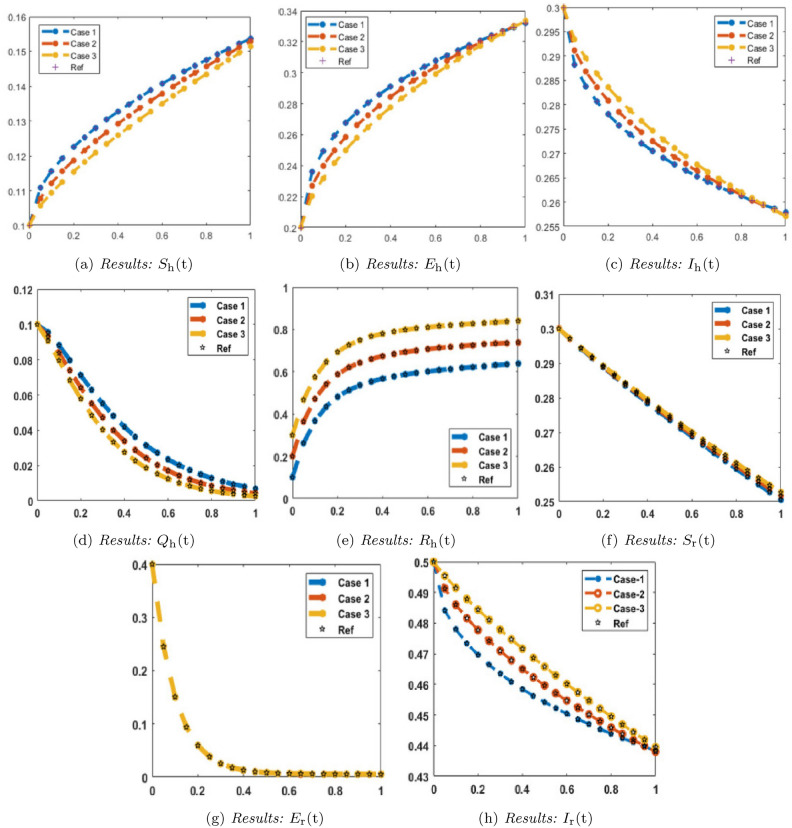
Differential equations-based epidemiological compartmental systems and deep neural networks-based artificial intelligence can effectively analyze and combat monkeypox (MPV) transmission with Poisson random measure noise into a stochastic SEIQR (susceptible, exposed, infected, quarantined, recovered) model human population and SEI (susceptible, exposed, infected) for rodent population. Compartmental models have estimates of parameter complications, whereas machine learning algorithms struggle to understand MPV's progression and lack elucidation. This research introduces Levenberg Marquardt backpropagation neural networks (LMBNNS) in training, a new approach that combines compartmental frameworks with artificial neural networks (ANNs) to explain the complex mechanisms of MPV. Meanwhile, a model description proves the existence and uniqueness of a global positive solution. A threshold parameter is determined and employed to identify the factors that lead to infection in the general public. Furthermore, other criteria are developed to eliminate the infection within the entire population. The MPV is eliminated if [Formula: see text], but continues if [Formula: see text]. The study depends on two functional scenarios to quantitatively clarify the theoretical results. An adapted dataset is generated employing the Adam algorithm to minimize the mean square error (MSE) by setting its data effectiveness to 81% for training, 9% for testing, and 10% for validation. The solver's accuracy is validated by minimal absolute error and complementing responses to every hypothetical situation. In order to verify the adaptation's reliability and precision, productivity is measured using the error histogram, changeover state, and prediction for addressing the MPV model. Visual representations are used to illustrate the investigation and compare results. Utilizing this hybrid approach, we want to increase our comprehension of disease propagation, strengthen forecasting competencies, and influence more efficient public health actions. The combination of stochastic processes and machine learning approaches creates a powerful tool for capturing the inherent uncertainties in infectious disease dynamics, as well as a more accurate framework for real-time epidemic prediction and prevention.
Keywords: Epidemiological modeling; Monkeypox virus; Neural network; Poisson random measure noise; State-space models.
© 2025. The Author(s).
Conflict of interest statement
Declarations. Competing interests: The authors declare no competing interests.
Figures
Similar articles
-
Deep convolutional neural network and IoT technology for healthcare.Digit Health. 2024 Jan 17;10:20552076231220123. doi: 10.1177/20552076231220123. eCollection 2024 Jan-Dec. Digit Health. 2024. PMID: 38250147 Free PMC article.
-
Artificial neural network-driven modeling of Ebola transmission dynamics with delays and disability outcomes.Comput Biol Chem. 2025 Apr;115:108350. doi: 10.1016/j.compbiolchem.2025.108350. Epub 2025 Jan 13. Comput Biol Chem. 2025. PMID: 39826237
-
Epi-DNNs: Epidemiological priors informed deep neural networks for modeling COVID-19 dynamics.Comput Biol Med. 2023 May;158:106693. doi: 10.1016/j.compbiomed.2023.106693. Epub 2023 Feb 28. Comput Biol Med. 2023. PMID: 36996662 Free PMC article.
-
Data-driven modeling and prediction of blood glucose dynamics: Machine learning applications in type 1 diabetes.Artif Intell Med. 2019 Jul;98:109-134. doi: 10.1016/j.artmed.2019.07.007. Epub 2019 Jul 26. Artif Intell Med. 2019. PMID: 31383477 Review.
-
Backpropagation-Based Learning Techniques for Deep Spiking Neural Networks: A Survey.IEEE Trans Neural Netw Learn Syst. 2024 Sep;35(9):11906-11921. doi: 10.1109/TNNLS.2023.3263008. Epub 2024 Sep 3. IEEE Trans Neural Netw Learn Syst. 2024. PMID: 37027264 Review.
References
-
- Gessain, A., Nakoune, E. & Yazdanpanah, Y. Monkeypox. New England J. Med.387(19), 1783–1793 (2022). - PubMed
-
- Leggiadro, R. J. Emergence of Monkeypox-West and Central Africa, 1970–2017. The Pediatric. Infect. Disease J.37(7), 721 (2018).
-
- Parker, S., Nuara, A., Buller, R. M. L. & Schultz, D. A. Human monkeypox: an emerging zoonotic disease. Future Med.2(1), 17–34 (2007). - PubMed
MeSH terms
LinkOut - more resources
Full Text Sources
