. 2025 May 17;16(1):799.
doi: 10.1007/s12672-025-02658-1.

Mendelian randomization analysis reveals potential association between allergic rhinitis and nasopharyngeal carcinoma

Affiliations

Mendelian randomization analysis reveals potential association between allergic rhinitis and nasopharyngeal carcinoma

Qingfu Bao et al. Discov Oncol. .

Abstract

Background: Nasopharyngeal carcinoma (NPC) is characterized by complex interactions within its tumor microenvironment. Understanding the immune landscape and gene expression patterns is crucial for developing effective therapeutic strategies.

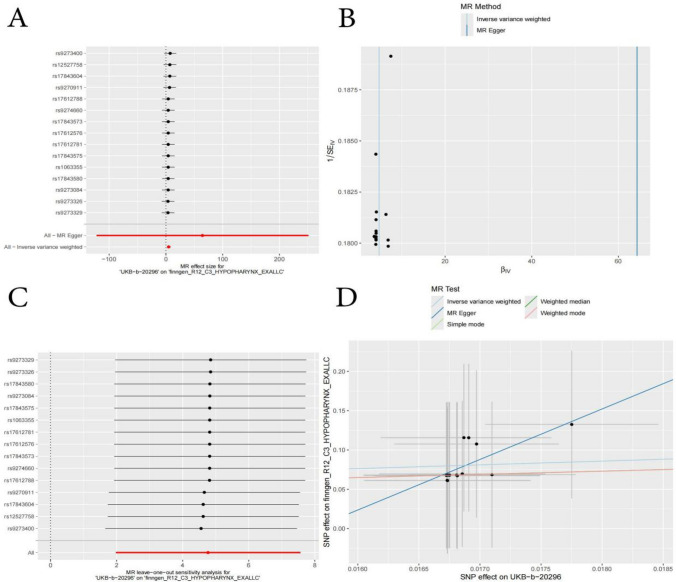
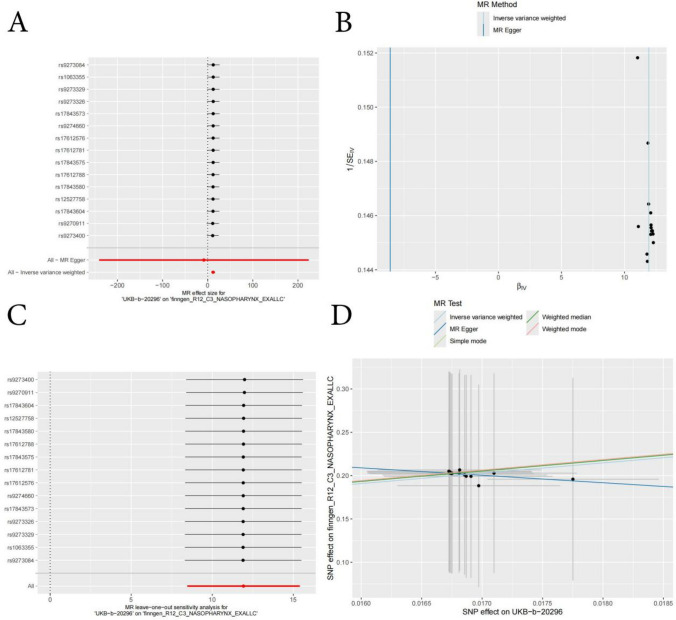
Methods: We employed multiple analytical approaches including Mendelian randomization analysis, single-cell sequencing, gene expression profiling, and spatiotemporal analysis. The study investigated associations between NPC and comorbidities, characterized immune cell populations, and analyzed gene expression patterns. Cytokine profiles and their effects on disease risk were also examined.

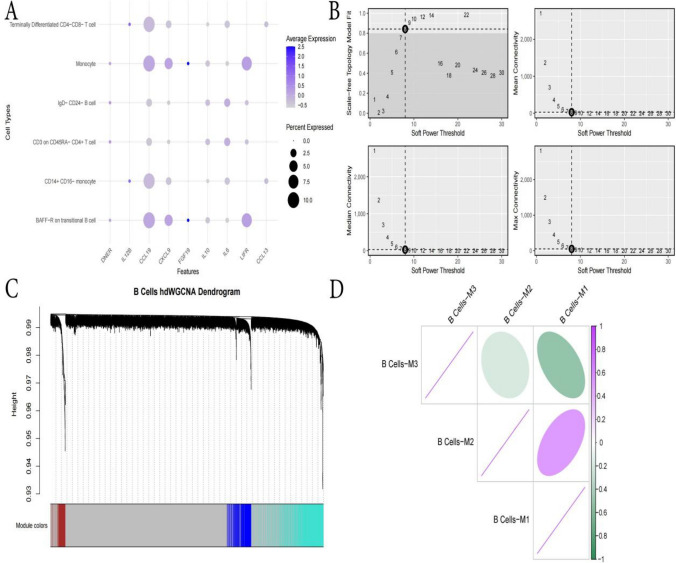
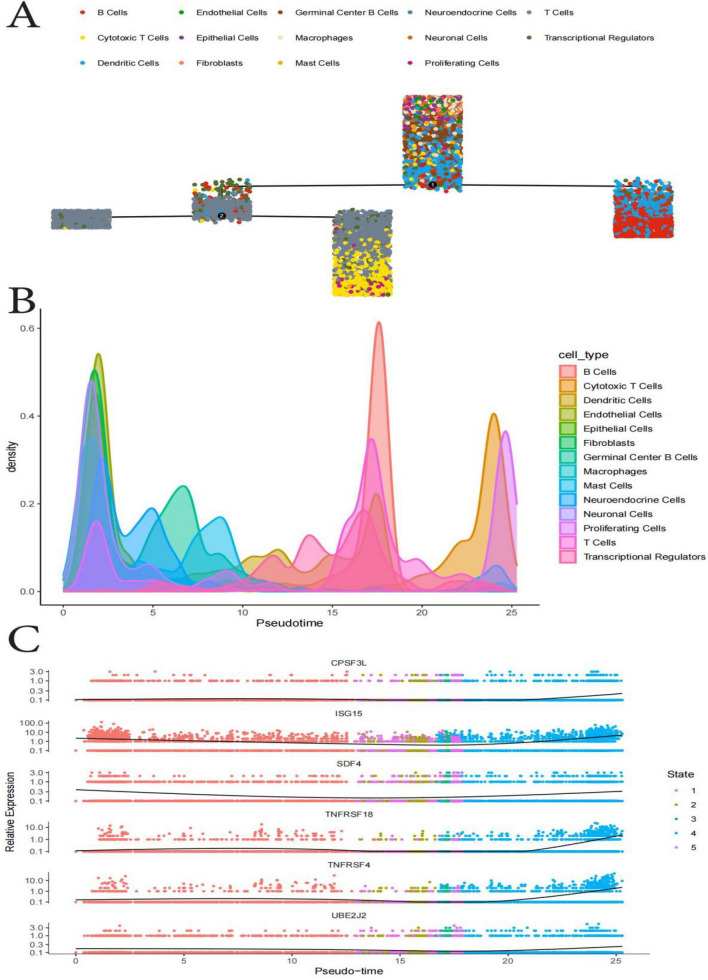
Results: The analysis revealed potential associations between NPC and both allergic rhinitis and high myopia. Single-cell sequencing identified distinct cellular populations, including three unique B cell subpopulations (M1, M2, M3) with specific molecular signatures and spatial distributions. Temporal analysis showed dynamic changes in immune cell composition: endothelial and epithelial cells dominated the early phase, B cells peaked in the middle phase, and dendritic and T cells increased in the late phase. Gene expression clustered into four main patterns, with significant roles for immune-related genes, particularly the TNFRSF family and HLA-related genes. Cytokine analysis identified IL-6 as a significant risk factor (31.4% increased risk) while IL-10 showed protective effects (8% risk reduction).

Conclusions: This comprehensive analysis provides detailed insights into the complex immune microenvironment and molecular mechanisms of NPC. The identification of distinct cellular populations, temporal patterns, and key molecular players offers valuable information for understanding disease progression and developing targeted therapeutic strategies.

Keywords: Allergic rhinitis; B cell subpopulations; Mendelian randomization; Nasopharyngeal carcinoma; Single-cell sequencing.


Conflict of interest statement

Declarations. Ethics approval and consent to participate: Not applicable. Consent for publication: All authors agree to publish this article. Competing interests: The authors declare no competing interests.

Figures

Fig. 1
Fig. 1
Mendelian randomization analysis reveals potential association between allergic rhinitis and nasopharyngeal carcinoma. The forest plot (A) shows independent effects of individual SNPs; the scatter plot (B) demonstrates the association pattern of SNPs between both diseases; the leave-one-out analysis (C) validates result robustness by excluding individual SNPs; and the funnel plot (D) integrates multiple analytical methods, confirming the reliability of research findings
Fig. 2
Fig. 2
The association between allergic rhinitis and nasopharyngeal carcinoma. The forest plot (A) shows SNP effect estimates and confidence intervals mostly crossing the null effect line, indicating small individual SNP effects; the scatter plot (B) distribution suggests a possible weak correlation between the two diseases; leave-one-out analysis (C) confirms result robustness, with minimal impact from removing single SNPs; the funnel plot (D) demonstrates consistency between different methods (blue and red lines), enhancing study credibility
Fig. 3
Fig. 3
A Mendelian randomization analysis reveals potential association between high myopia and nasopharyngeal carcinoma. Forest plot (A) shows SNP effects distributed around the null line; scatter plot (B) distribution suggests possible association between the two diseases; leave-one-out analysis (C) confirms result robustness; funnel plot (D) enhances study credibility through consistency between different methods (blue and red lines)
Fig. 4
Fig. 4
Gene expression analysis of nasopharyngeal carcinoma data. RNA count distribution analysis (A) showed two distinct correlation patterns (0.08 and 0.92); differential expression analysis (B) identified key differential genes through volcano plots; and gene correlation analysis (C) revealed functional connections between genes. These findings provide important insights into the molecular mechanisms of nasopharyngeal carcinoma
Fig. 5
Fig. 5
Single-cell sequencing analysis of nasopharyngeal carcinoma. Heatmap (A) shows gene expression clustering patterns; UMAP and tSNE dimensionality reduction (B, C) and cell type annotation (D, E) identified multiple cell types (T cells, B cells, macrophages, etc.), revealing cellular heterogeneity in the tumor microenvironment and providing new insights into nasopharyngeal carcinoma pathogenesis
Fig. 6
Fig. 6
The statistical analysis of cytokines and allergic rhinitis risk. Pro-inflammatory factors (IL-6, IL-12B, DNER) increase allergic rhinitis risk, with IL-6 showing the strongest effect, increasing risk by approximately 31.4%. Anti-inflammatory factors (IL-10, TNFB_LTA) demonstrate protective effects, reducing allergic rhinitis risk by 6.5–8%. CCL19 and CCL13 increase disease risk (8–10%). CXCL9 shows protective effects, reducing risk by about 7.6%. Growth factors (FGF-19, LIF-R) both show trends of increasing risk, with increases ranging from 7.7% to 18.3%
Fig. 7
Fig. 7
Analysis of immune cells and biomarkers in nasopharyngeal cancer. The study investigates immune cell distributions and biomarker patterns through several analytical methods. A Presents an analysis of various immune cells (including CD4-CD8- T cells, monocytes) and key biomarkers (such as DNER, IL12B), along with a soft threshold analysis for network optimization. The research then examines B cell characteristics, as shown in B using a hierarchical clustering approach (height range 0.93–0.99), with different modules represented by distinct colors. Finally, C and D visualize the relationships between three B cell subgroups (M1, M2, M3) using a color gradient system, where green indicates positive correlations and purple shows negative correlations
Fig. 8
Fig. 8
B cell subgroup analysis in nasopharyngeal carcinoma. AC The M1 subgroup expresses genes such as PRDX2, LYZ, and BPIFA1, shows a dispersed cyan distribution, and primarily interacts with macrophages and fibroblasts. The M2 subgroup highly expresses cytoskeleton-related genes ACTB, PPIB, and ACTG1, appears as dark blue clusters in the tissue, and mainly interacts with T cells and dendritic cells. The M3 subgroup specifically expresses ribosome-related genes RPS18, RPL13, and RPL3 A, shows a uniform red distribution, and has close associations with proliferating cells and neuroendocrine cells, potentially participating in the regulation of tumor growth and neuroendocrine signaling
Fig. 9
Fig. 9
Spatial distribution and temporal evolution analysis of immune cells in nasopharyngeal carcinoma. AC Various immune cells (such as B cells, T cells) form specific distribution patterns. Temporally, three phases emerge: early phase dominated by endothelial and epithelial cells, middle phase showing peak B cell levels, and late phase marked by increased dendritic and T cells. Gene expression analysis shows low CPSF3L expression, sustained high ISG15 expression, and significant upregulation of immune regulatory genes TNFRSF18 and TNFRSF4 in the late phase
Fig. 10
Fig. 10
Gene expression dynamics and spatial distribution in nasopharyngeal carcinoma. A Temporal analysis revealed four gene expression patterns: progressively increasing, low-to-high transition, high-to-low transition, and moderate-to-low shift. HLA-related genes showed low expression in late stages, immune regulatory genes displayed unique patterns across phases, and cell cycle genes peaked in the middle phase. B Spatial analysis revealed region-specific gene expression forming distinct co-expression modules, revealing the regulatory network characteristics of nasopharyngeal carcinoma

Similar articles

References

    1. Chen G, Sun DC, Ba Y, Zhang YX, Zhou T, Zhao YY, Zhao HY, Fang WF, Huang Y, Wang Z, et al. Anti-LAG-3 antibody LBL-007 plus anti-PD-1 antibody toripalimab in advanced nasopharyngeal carcinoma and other solid tumors: an open-label, multicenter, phase Ib/II trial. J Hematol Oncol. 2025;18(1):15. - PMC - PubMed
    1. Chen J, Feng C, Lan Y, Chen X, Peng Z, Huang Z, Wang R, Zhang W, Ye Y, Mao Z, et al. Bidirectional regulation of reactive oxygen species for radiosensitization in nasopharyngeal carcinoma. J Nanobiotechnol. 2025;23(1):96. - PMC - PubMed
    1. Xu M, Wang L, Ding J, Xu Y, Fei Z. The prognostic value of boost dose in residual cervical lymph nodes in nasopharyngeal carcinoma patients after intensity-modulated radiotherapy: a retrospective study. BMC Cancer. 2025;25(1):222. - PMC - PubMed
    1. Yang Y, Gao Y, Luo Y, Liu W, Xie P, Huang L, Zeng Z. Impact of magnetic resonance imaging-defined sarcopenia on prognosis in patients with locally advanced nasopharyngeal carcinoma. Discov Oncol. 2025;16(1):141. - PMC - PubMed
    1. Chen N, Zong Y, Yang C, Li L, Yi Y, Zhao J, Zhao X, Xie X, Sun X, Li N, et al. KMO-driven metabolic reconfiguration and its impact on immune cell infiltration in nasopharyngeal carcinoma: a new avenue for immunotherapy. Cancer Immunol Immunother. 2025;74(3):75. - PMC - PubMed

LinkOut - more resources