. 2025 May 17;25(1):658.
doi: 10.1186/s12870-025-06676-7.

A sexual/apomictic consensus linkage map of Eragrostis curvula at tetraploid level

Affiliations

A sexual/apomictic consensus linkage map of Eragrostis curvula at tetraploid level

Jimena Gallardo et al. BMC Plant Biol. .

Abstract

Background: Apomixis is an asexual reproduction process that allows plants to bypass meiosis and fertilization, resulting in clonal seeds that are genetically identical to the maternal genotype. Eragrostis curvula is a grass species used as model to disclose the mechanism associated to diplosporous apomixis. Previously, the first E. curvula linkage maps were developed using a F1 population derived from a cross between a sexual female parent (cv. OTA-S) and a facultative apomictic pollen donor (cv. Don Walter). Even though this work allows the identification a markers linked to apomixis in the male parent, the number of hybrids was not enough to produce a consensus map. Here, a new population is presented, increasing the number of genotyped hybrids to 107 which allows the construction of a consensus map and the development of KASP markers.

Results: We constructed a consensus linkage map at the tetraploid level using a mapping population segregating for reproductive mode. Within this map, a region associated with apomeiosis (the APO locus) was identified using maternal and paternal SNP markers, along with three paternal markers that exhibited strong linkage with the trait. KASP markers were developed, one of which demonstrated 100% concordance with the cytoembryological phenotype of individuals in both the mapping population and other E. curvula genotypes. Through synteny analysis, the APO locus was mapped onto the E. curvula reference genome, and two genes that could be part of molecular pathways involved in apomeiosis were proposed.

Conclusions: This study presents the first consensus genetic map and the development of KASP markers for phenotyping reproductive modes in E. curvula. This map enables the association of the apomixis-determining region with molecular markers from both parental genotypes, including the reference sexual tetraploid genotype of the species (OTA-S). The development and validation of co-dominant molecular KASP markers linked to the APO locus provide a crucial tool for future research and breeding.

Keywords: Apomeiosis; Apomixis; Mapping; Weeping lovegrass.


Conflict of interest statement

Declarations. Ethics approval and consent to participate: Not applicable. Consent for publication: Not applicable. Competing interests: The authors declare no competing interests.

Figures

Fig. 1
Fig. 1
Principal components plot of an Eragrotis curvula mapping population genotyped with DArT-Seq SNPs markers showing hybrid and non hybrid offspring. Yellow circle: cv. OTA-S samples and selfing individuals. Green circle: cv. Don Walter samples. Orange circle: hybrids from the OTA-S x Don Walter cross. X-axis represents the percentage of variance of principal component 1, and the Y-axis represents that of component 2
Fig. 2
Fig. 2
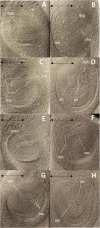
Typical sexual (A-B-C-D) and apomictic (E–F-G-H) processes of E. curvula observed by DIC. A: Functional megaspore + degenerating megaspores, B: Sexual binucleated embryo sac, C: Sexual tetranucleated embryo sac, D: Mature sexual embryo sac with antipodal proliferation, E: Apomictic elongated megaspore mother cell, F: Apomictic binucleated embryo sac, G: Apomictic tetranucleated embryo sac, H: Apomictic mature embryo sac. deg: degenerant megaspores, FM: functional megaspore, EMMC: elongated megaspore mother cell, mn: micropylar nucleus, vac: vacuole, chn: chalazal nucleus, an: antipodal cells, ov: ovule, syn: synergid cells, pn: polar nucleus. Bar represents 50 µm
Fig. 3
Fig. 3
Percentage of diplosporous processes in apomictic individuals of an Eragrostis curvula mapping population derived from the OTA-S x Don Walter cross
Fig. 4
Fig. 4
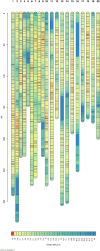
Eragrostis curvula consensus linkage map obtained using a mapping population derived from the OTA-S x Don Walter cross. The heat map shows the marker density in each LG
Fig. 5
Fig. 5
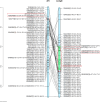
Synteny between LG9 (Eragrostis curvula consensus map) and Contig28 of the reference genome (E. curvula cv. Victoria). Scale on the right represents cM. Red circle shows the APO locus region and the flanking markers linked on the consensus map. Green circle shows the APO region and the flanking markers previously mapped [58]
Fig. 6
Fig. 6
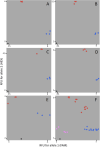
DNA amplification of parental genotypes of the E. curvula mapping population using the sets of designed KASP primers (A: 100,477,277|F|0–6:C > T-6:C > T, B: 100477277 V2|F|0–6:C > T-6:C > T, C: 100,503,486|F|0–31:G > A-31:G > A, D: 100503486 V2|F|0–31:G > A-31:G > A, E: 100,502,388|F|0–17:A > T-17:A > T and F: all primers evaluated). Black dots correspond to control samples (without DNA), red dots represent Don Walter samples and blue dots indicated OTA-S samples. In graph F, pink dots correspond to samples amplified with primer 100,502,388|F|0–17:A > T-17:A > T. RFU: Relative Flruorescence Units
Fig. 7
Fig. 7
Amplification of all individuals of the Eragrostis curvula mapping population with the set of KASP primers 100,477,277|F|0–6:C > T-6:C > T (A: new mapping population, B: previous mapping population). Black dots indicate the control sample, red dots represent Don Walter samples and the apomictic hybrids, and the blue dots correspond to OTA-S samples and the sexual hybrids. RFU: Relative Flruorescence Units

Similar articles

References

    1. Akiyama Y, Conner J, Goel S, Morishige D, Mullet J, Hanna W, et al. High resolution physical mapping in Pennisetum squamulatum reveals extensive chromosomal heteromorphism of genomic region associated with apomixis. Plant Physiol. 2004;134:1733–41. 10.1104/pp.103.033969. - PMC - PubMed
    1. Akiyama Y, Hanna W, Ozias-Akins P. High-resolution physical mapping reveals that the apospory-specific genomic region (ASGR) in Cenchrus ciliaris is located on a heterochromatic and hemizygous region of a single chromosome. Theor Appl Genet. 2005;111:1042–51. 10.1007/s00122-005-0020-5. - PubMed
    1. Albertini E, Barcaccia G, Mazzucato A, Sharbel TF, Falcinelli M. Apomixis in the era of biotechnology. In: Pua E, Davey M, editors. Plant Developmental Biology - Biotechnological Perspectives. Berlin: Springer; 2010. p. 405–36. 10.1007/978-3-642-02301-9_20.
    1. Albertini E, Marconi G, Reale L, Barcaccia G, Porceddu A, Ferranti F, Falcinelli M. SERK and APOSTART. Candidate genes for apomixis in Poa pratensis. Plant Physiol. 2005;138:2185–99. 10.1104/pp.105.062059. - PMC - PubMed
    1. Albertini E, Porceddu A, Ferranti F, Reale L, Barcaccia G, Romano B, Falcinelli M. Apospory and parthenogenesis may be uncoupled in Poa pratensis: a cytological investigation. Sex Plant Reprod. 2001;14:213–7. 10.1007/s00497-001-0116-2. - PubMed

Substances

LinkOut - more resources