. 2025 Jun;301(6):110246.
doi: 10.1016/j.jbc.2025.110246. Epub 2025 May 16.

LncRNA-induced lysosomal localization of NHE1 promotes increased lysosomal pH in macrophages leading to atherosclerosis

Affiliations

LncRNA-induced lysosomal localization of NHE1 promotes increased lysosomal pH in macrophages leading to atherosclerosis

Pengcheng Shi et al. J Biol Chem. 2025 Jun.

Abstract

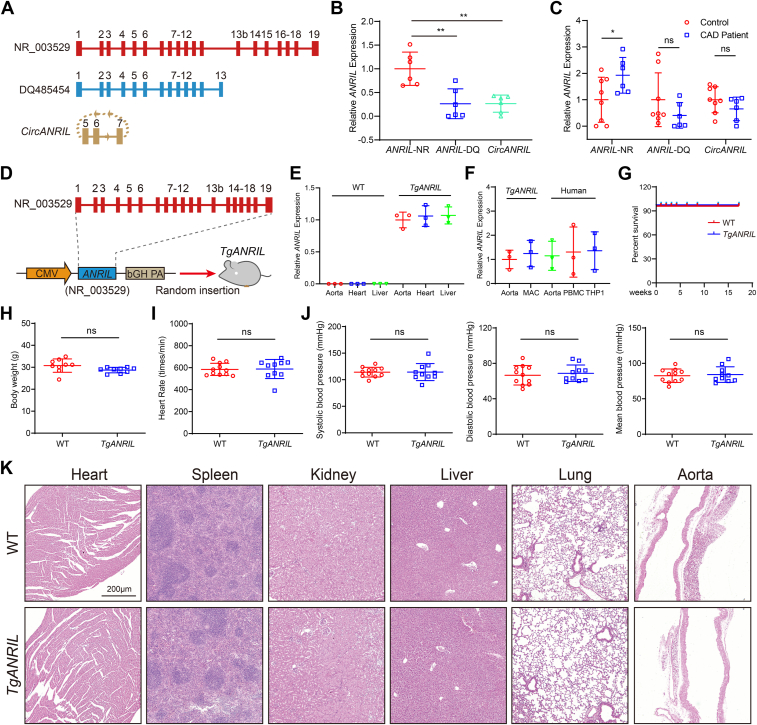
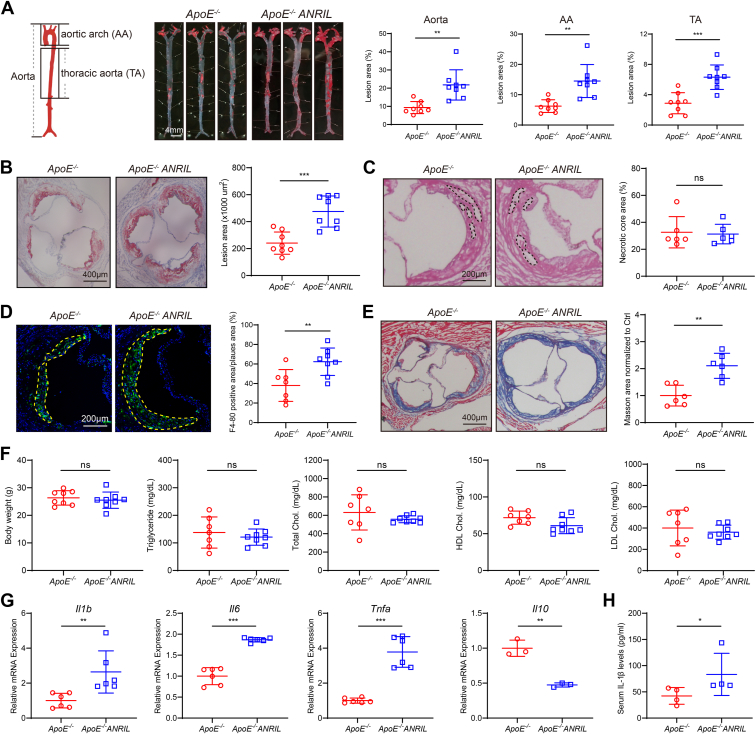
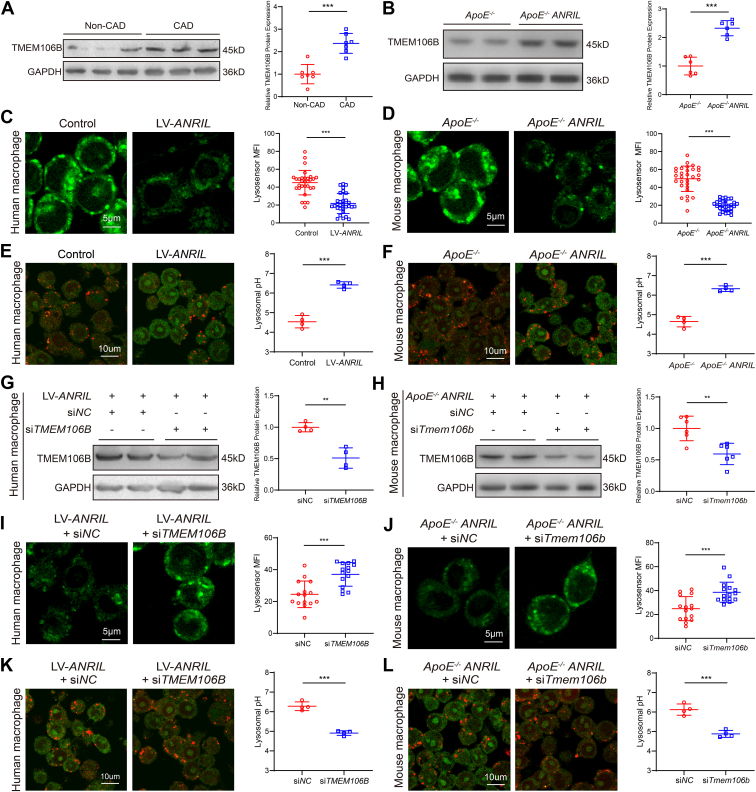
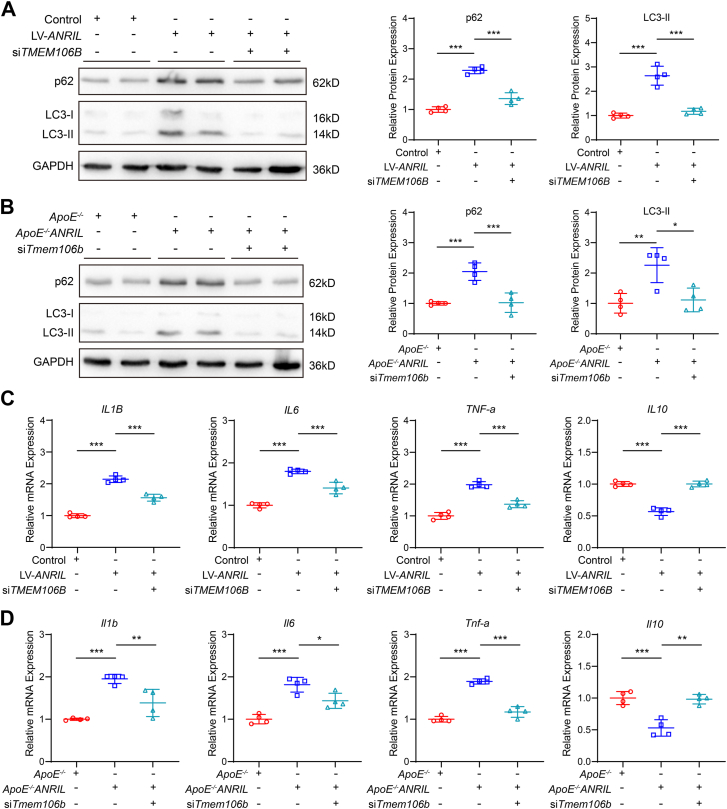
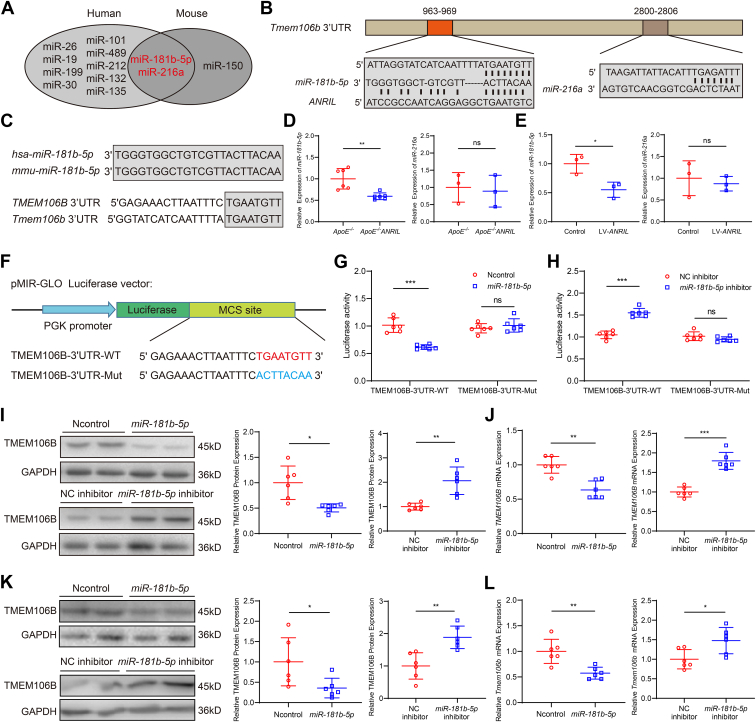
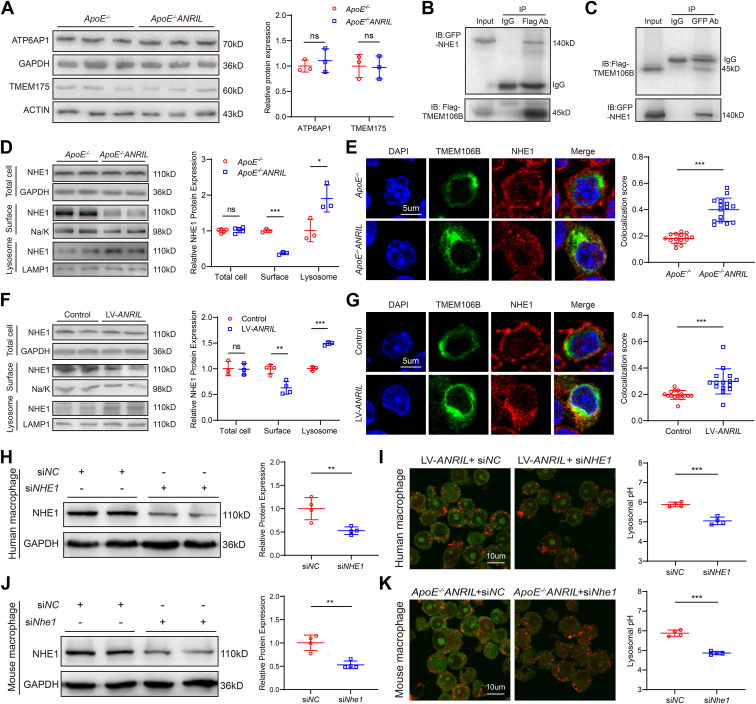
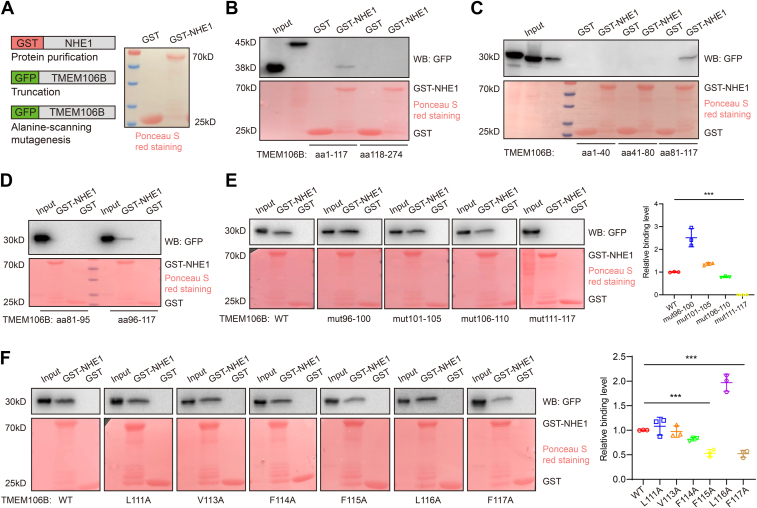
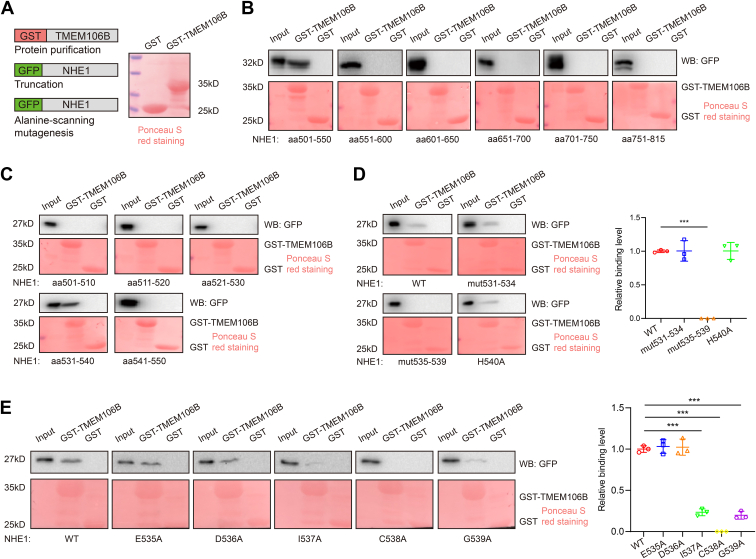
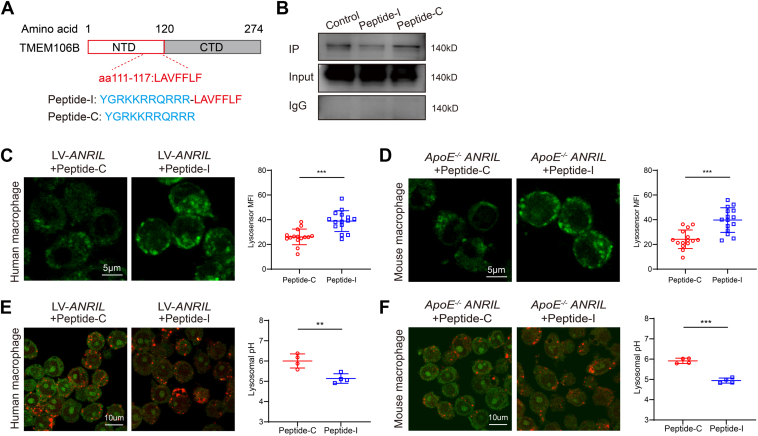
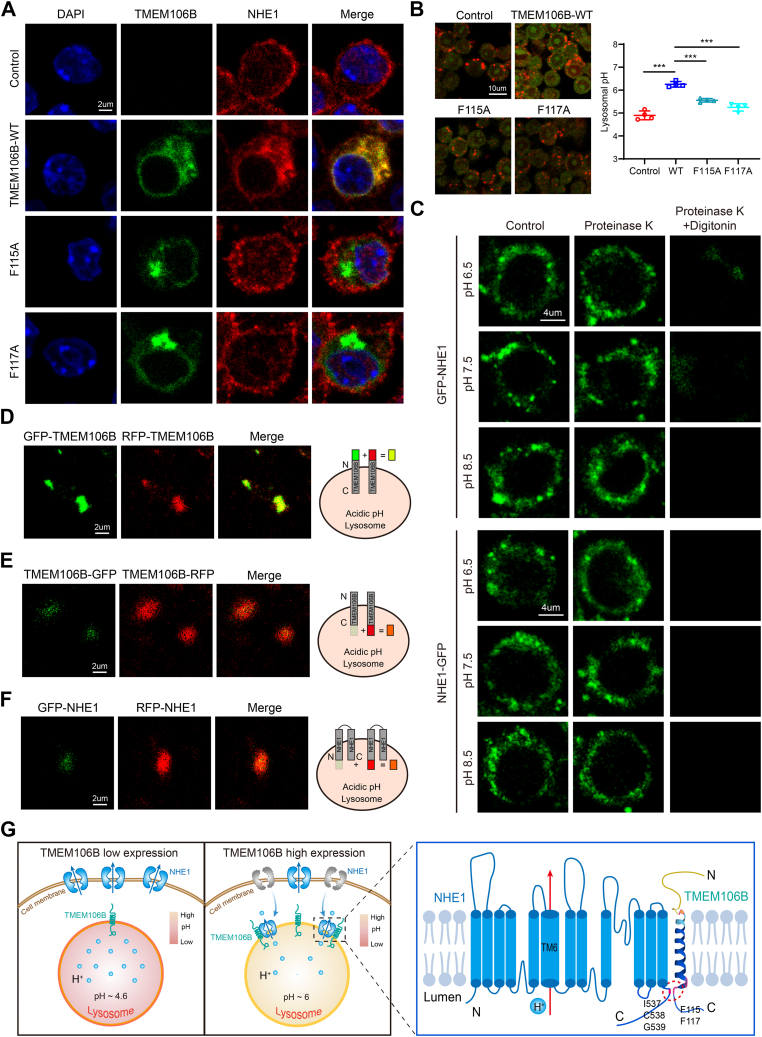
ANRIL, also referred to as CDKN2B-AS1, is an lncRNA gene implicated in the pathogenesis of multiple human diseases including atherosclerotic coronary artery disease; however, definitive in vivo evidence is lacking and the underlying molecular mechanism is largely unknown. In this study, we show that ANRIL overexpression causes atherosclerosis in vivo as transgenic mouse overexpression of full-length ANRIL (NR_003529) increases inflammation and aggravates atherosclerosis under ApoE-/- background (ApoE-/-ANRIL mice). Mechanistically, ANRIL reduces the expression of miR-181b-5p, which leads to increased TMEM106B expression. TMEM106B is significantly upregulated in the atherosclerotic lesions of both human CAD patients and ApoE-/-ANRIL mice. TMEM106B interacts and colocalizes with Na+-H+ exchanger NHE1, which results in the mislocalization of NHE1 from cell membranes to lysosomal membranes, leading to increased lysosomal pH in macrophages. Large truncation and point mutation analyses define the critical amino acids for TMEM106B-NHE1 interaction and lysosomal pH regulation as F115 and F117 on TMEM106B and I537, C538, and G539 on NHE1. Topological analysis suggests that both N terminus and C terminus of NHE1 are located inside lysosomal lumen, consistent with our finding that NHE1 is an important new proton efflux channel involved in raising lysosomal pH. A short TMEM106B peptide (YGRKKRRQRRR-L111A112V113F114F115L116F117) disrupting the TMEM106B-NHE1 interaction normalized lysosomal pH in macrophages with ANRIL overexpression. Our data demonstrate that ANRIL promotes atherosclerosis in vivo and identify the ANRIL-miR-181b-5p-TMEM106B-NHE1-lysosomal pH axis as the underlying molecular pathogenic mechanism for the chromosome 9p21.3 genetic locus for coronary artery disease.

Keywords: ANRIL; NHE1; TMEM106B; atherosclerosis; coronary artery disease; lysosomal pH; macrophage; miR-181b-5p.


Conflict of interest statement

Conflict of interest The authors declare that they have no conflicts of interest with the contents of this article.

Figures

Figure 1
Figure 1
ANRIL expression was increased in human CAD patients and the development of TgANRIL mice.A, diagram showing the three major transcripts of ANRIL. B, RT-qPCR analysis to examine expression of different ANRIL transcripts in human CAD patients. n = 6. C, RT-qPCR analysis showed that the expression of ANRIL NR_003529 was upregulated in human CAD patients compared with controls. n = 6 to 8. D, transgenic construct pcDNA3.1-ANRIL (NR_003529) for the development of TgANRIL mice. E, RT-qPCR analysis was used to detect ANRIL (NR_003529) expression in tissues from WT mice and TgANRIL mice. n = 3. F, RT-qPCR analysis was used to detect ANRIL (NR_003529) expression in TgANRIL mice and humans. n = 3. G, survival rate of WT and TgANRIL mice. n = 12. H, body weight of WT and TgANRIL mice. n = 9. I, heart rate of WT and TgANRIL mice. n = 10 to 11. J, systolic blood pressure, diastolic blood pressure, and mean blood pressure of WT and TgANRIL mice. n = 10 to 11. K, HE staining of major organs, including the heart, spleen, kidney, liver, lung, and aorta. n = 3. ∗p < 0.05, ∗∗p < 0.01, ns, not significant. B, one-way ANOVA; (C) multiple t test; (HJ) unpaired two-tailed t test.
Figure 2
Figure 2
Male ApoE−/−ANRIL mice show aggravated atherosclerosis.A, male mice were fed with a standard chow diet for 4 weeks and then with a WD for 14 weeks. Representative lipid/oil red O–stained enface images of aortas. n = 8. B, representative lipid/oil red O staining of aortic root sections. n = 8. C, representative HE staining of aortic root sections. n = 6. D, representative anti-F4-80 immunofluorescent images of aortic root sections. n = 7 to 8. E, representative Masson staining of aortic root sections. n = 6. F, body weight, TG, TC, HDL-c, and LDL-c levels. n = 7 to 8. G, RT-qPCR analysis for Il1b, Il6, Tnfa, and Il10. n = 3 to 6. H, ELISA to measure secreted serum IL-1β. n = 4. ∗p < 0.05, ∗∗p < 0.01, ∗∗∗p < 0.001, ns, not significant. A, B, DF, and G, (Il6, Il10, and Tnfa), unpaired two-tailed t test; (C and G) (Il1b), and (H) nonparametric test.
Figure 3
Figure 3
ANRIL increases lysosomal pH in macrophages by upregulating TMEM106B expression.A, Western blot analysis for TMEM106B in human CAD patients. n = 7. B, Western blot analysis for TMEM106B in atherosclerotic lesions of mice. n = 6. C, human PBMC-induced macrophages with ANRIL overexpression (LV-ANRIL) stained for Lysosensor. n = 30. D, mouse primary macrophages stained for Lysosensor. n = 30. E, lysosomal pH measurement in human PBMC-induced macrophages infected with LV-ANRIL or control viruses with a combination of pH-insensitive (TRITC) and sensitive (FITC) dyes. n = 4 samples with >50 cells counted in each sample. F, lysosomal pH measurement in macrophages isolated from ApoE−/− and ApoE−/−ANRIL mice with a combination of pH-insensitive (TRITC) and sensitive (FITC) dyes. n = 4 samples with >50 cells counted in each sample. G, Western blot analysis for TMEM106B in human PBMC-induced macrophages with ANRIL overexpression transfected with siTMEM106B or siNC. n = 4. H, Western blot analysis for TMEM106B in mouse primary macrophages transfected with siTmem106b or siNC. n = 6. I, human PBMC-induced macrophages transfected with siTMEM106B or siNC and stained for Lysosensor. n = 15. J, mouse primary macrophages transfected with siTmem106b or siNC and stained for Lysosensor. n = 15. K, lysosomal pH measurement in human PBMC-induced macrophages with ANRIL overexpression transfected with siNC or siTMEM106B with a combination of pH-insensitive (TRITC) and sensitive (FITC) dyes. n = 4 samples with >50 cells counted in each sample. L, lysosomal pH measurement in macrophages isolated from ApoE−/−ANRIL mice and transfected with siNC or siTmem106b with a combination of pH-insensitive (TRITC) and sensitive (FITC) dyes. n = 4 samples with >50 cells counted in each sample. ∗∗p < 0.01, ∗∗∗p < 0.001. Unpaired two-tailed t test.
Figure 4
Figure 4
Knockdown of TMEM106B reverses autophagic and inflammatory phenotypes caused by ANRIL overexpression.A, Western blot analysis for p62 and LC3-II in human primary macrophages. n = 4. B, Western blot analysis for p62 and LC3-II in mouse primary macrophages. n = 4. C, RT-qPCR analysis for IL1B, IL6, TNF-a, and IL10 in human primary macrophages. n = 4. D, RT-qPCR analysis for Il1b, Il6, Tnf-a, and Il10 in mouse primary macrophages. ∗p < 0.05, ∗∗p < 0.01, ∗∗∗p < 0.001. One-way ANOVA.
Figure 5
Figure 5
ANRIL upregulates TMEM106B expression via reducing miR-181b-5p.A, intersection of human and mouse miRNAs that bind to Tmem106b 3′UTR. B, miR-181b-5p has complementary pairing sequences with ANRIL and Tmem106b 3′UTR. C, homology analysis of miR-181b-5p and TMEM106B-3′UTR in humans and mice. D, RT-qPCR analysis showed the expression of miR-181b-5p and miR-216a in mice. n = 3 to 6. E, RT-qPCR analysis showed the expression of miR-181b-5p and miR-216a in human primary macrophages. n = 3. F, schematic diagram showing pMIR-TMEM106B-3′UTR-WT or pMIR-TMEM106B-3′UTR-Mut reporters with the miR-181b-5p–binding site. G and H, luciferase activity of TMEM106B-3′UTR-WT or TMEM106B-3′UTR-Mut reporters in the presence of miR-181b-5p mimics versus Ncontrol or miR-181b-5p inhibitor versus NC inhibitor. n = 6. I and J, Western blot analysis and RT-qPCR analysis for TMEM106B in THP1-induced macrophages (100 ng/ml PMA for 48h) transfected with miR-181b-5p mimics or miR-181b-5p inhibitor. n = 6. K and L, Western blot analysis and RT-qPCR analysis for TMEM106B in mouse RAW264.7 macrophages transfected with miR-181b-5p mimics or miR-181b-5p inhibitor. n = 6. ∗p < 0.05, ∗∗p < 0.01, ∗∗∗p < 0.001, ns, not significant. D, E, I, and J, (right), (K and L) unpaired two-tailed t test; (G and H) two-way ANOVA; (J) (left) nonparametric test.
Figure 6
Figure 6
TMEM106B interacts with NHE1 and colocalization of NHE1 and TMEM106B in lysosomes after ANRIL overexpression.A, Western blot analysis for ATP6AP1 and TMEM175 in mouse primary macrophages. n = 3. B and C, Co-IP for the interaction between TMEM106B and NHE1 in HEK293 cells. D, Western blot analysis for NHE1 in total lysates, cell surface lysates, and lysosomal lysates of mouse primary macrophages. n = 3 to 5. E, colocalization of NHE1 and TMEM106B in the lysosomes of mouse primary macrophages. n = 15. F, Western blot analysis for NHE1 in total lysates, cell surface lysates, and lysosomal lysates of human PBMC-induced primary macrophages. n = 3 to 4. G, colocalization of NHE1 and TMEM106B in the lysosomes of human PBMC-induced primary macrophages. n = 15. H, Western blot analysis for NHE1 in human PBMC-induced macrophages that were first infected with LV-ANRIL and then transfected with siNC or siNHE1. n = 4. I, lysosomal pH measurements in human PBMC-induced macrophages treated as in (H). n = 4 samples with >50 cells counted in each sample. J, Western blot analysis for NHE1 in macrophages isolated from ApoE−/−ANRIL mice and transfected with siNC or siNhe1. n = 4. K, lysosomal pH measurements in ApoE−/−ANRIL macrophages treated as in (J). ∗p < 0.05, ∗∗p < 0.01, ∗∗∗p < 0.001, ns, not significant. A, D, and F, multiple t test; (E and G–K) unpaired two-tailed t test.
Figure 7
Figure 7
Truncation and point mutation analyses define the TMEM106B–NHE1 interaction domain on TMEM106B.A, purification of GST-NHE1 protein. B, GST pull-down assays identified the TMEM106B–NHE1 interaction region as aa1-117 of TMEM106B. C, GST pull-down assays identified the TMEM106B–NHE1 interaction region as aa81-117 of TMEM106B. D, GST pull-down assays identified the TMEM106B–NHE1 interaction region as aa96-117 of TMEM106B. E, amino acids 111-117 of TMEM106B were the critical residues for the TMEM106B–NHE1 interaction. n = 3. F, F115 and F117 of TMEM106B were the critical residues for the TMEM106B–NHE1 interaction. n = 3. ∗∗∗p < 0.001. One-way ANOVA.
Figure 8
Figure 8
Truncation and point mutation analyses define the TMEM106B–NHE1 interaction domain on NHE1.A, purification of GST-TMEM106B protein. B, GST pull-down assays identified the TMEM106B–NHE1 interaction region as aa501-550 of NHE1. C, GST pull-down assays identified the TMEM106B–NHE1 interaction region as aa531-540 of NHE1. D, amino acids 535-539 were the critical residues for the TMEM106B–NHE1 interaction. n = 3. E, I537, C538, and G539 of NHE1 were the critical residues for the TMEM106B–NHE1 interaction. n = 3. ∗∗∗p < 0.001. One-way ANOVA.
Figure 9
Figure 9
TMEM106B peptide-I restores lysosomal pH homeostasis by inhibiting TMEM106B–NHE1 interaction.A, sequences of peptides. B, co-IP showing the inhibitory effect of peptide-I on the TMEM106B–NHE1 interaction. C, lysosensor staining showed that peptide-I normalized lysosomal pH homeostasis in human primary macrophages. n = 15. D, lysosensor staining showed that peptide-I normalized lysosomal pH homeostasis in mouse primary macrophages. n = 15. E, lysosomal pH measurement in human PBMC-induced macrophages with ANRIL overexpression and treated with peptide-C or peptide-I with a combination of pH-insensitive (TRITC) and sensitive (FITC) dyes. n = 4 samples with >50 cells counted in each sample. F, lysosomal pH measurement in macrophages isolated from ApoE−/−ANRIL mice and treated with peptide-C or peptide-I with a combination of pH-insensitive (TRITC) and sensitive (FITC) dyes. n = 4 samples with >50 cells counted in each sample. ∗∗∗p < 0.001. Unpaired two-tailed t test.
Figure 10
Figure 10
Mutations F115A and F117A of TMEM106B impair cytoplasmic colocalization of TMEM106B and NHE1 and analysis of NHE1 topology on lysosomal membranes.A, immunostaining showing colocalization of TMEM106B and NHE1, which was disrupted by TMEM106B-F115A and TMEM106B-F117A mutations. B, TMEM106B-F115A and TMEM106B-F117A mutations significantly inhibited the effect of TMEM106B-WT on lysosomal pH. n = 4 samples with >50 cells counted in each sample. C, macrophages were transfected with GFP-NHE1 or NHE1-GFP with GFP tagged at the N terminus or C terminus, respectively. Cells were treated with control PBS, proteinase K, and proteinase K plus digitonin, respectively, and fluorescence signals were detected under a confocal microscope. D, the lysosomes were isolated from the macrophages and imaged for analysis of the topology of N-terminal tagged GFP-TMEM106B and RFP-TMEM106B on lysosomal membranes. E, the lysosomes were isolated from the macrophages and imaged for analysis of the topology of C-terminal tagged TMEM106B-GFP and TMEM106B-RFP on lysosomal membranes. F, the lysosomes were isolated from the macrophages and imaged for analysis of the topology of N-terminal tagged GFP-NHE1 and RFP-NHE1 on lysosomal membranes. G, schematic diagram of NHE1 localization on plasma membranes and lysosomal membranes and effects on cellular and lysosomal pH. ∗∗∗p < 0.001. One-way ANOVA.

Similar articles

References

    1. Wang Q. Advances in the genetic basis of coronary artery disease. Curr. Atheroscler. Rep. 2005;7:235–241. - PMC - PubMed
    1. Wang Q., Rao S., Shen G.Q., Li L., Moliterno D.J., Newby L.K., et al. Premature myocardial infarction novel susceptibility locus on chromosome 1P34-36 identified by genomewide linkage analysis. Am. J. Hum. Genet. 2004;74:262–271. - PMC - PubMed
    1. Weber C., Habenicht A.J.R., von Hundelshausen P. Novel mechanisms and therapeutic targets in atherosclerosis: inflammation and beyond. Eur. Heart J. 2023;44:2672–2681. - PubMed
    1. Helgadottir A., Thorleifsson G., Manolescu A., Gretarsdottir S., Blondal T., Jonasdottir A., et al. A common variant on chromosome 9p21 affects the risk of myocardial infarction. Science. 2007;316:1491–1493. - PubMed
    1. McPherson R., Pertsemlidis A., Kavaslar N., Stewart A., Roberts R., Cox D.R., et al. A common allele on chromosome 9 associated with coronary heart disease. Science. 2007;316:1488–1491. - PMC - PubMed

LinkOut - more resources