. 2025 May 18;16(1):4621.
doi: 10.1038/s41467-025-59626-0.

Immune perturbations in human pancreas lymphatic tissues prior to and after type 1 diabetes onset

Affiliations

Immune perturbations in human pancreas lymphatic tissues prior to and after type 1 diabetes onset

Gregory J Golden et al. Nat Commun. .

Abstract

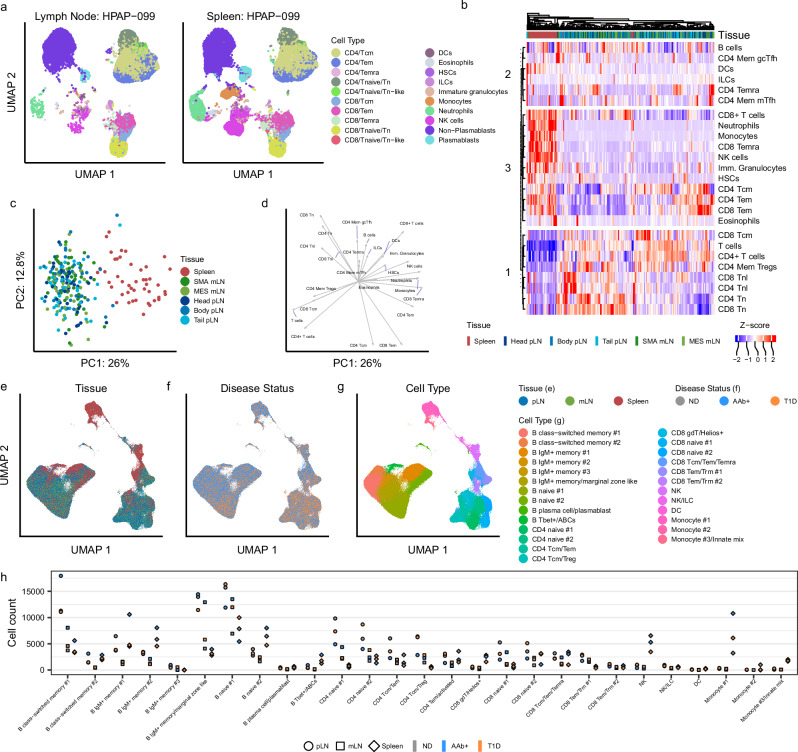
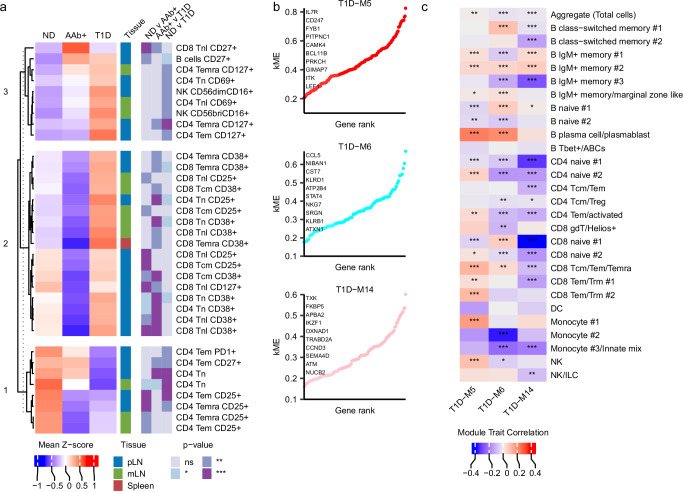
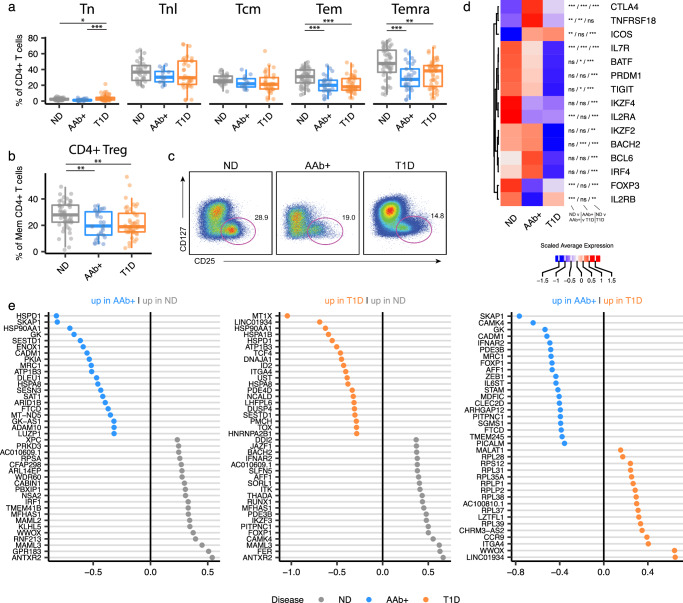
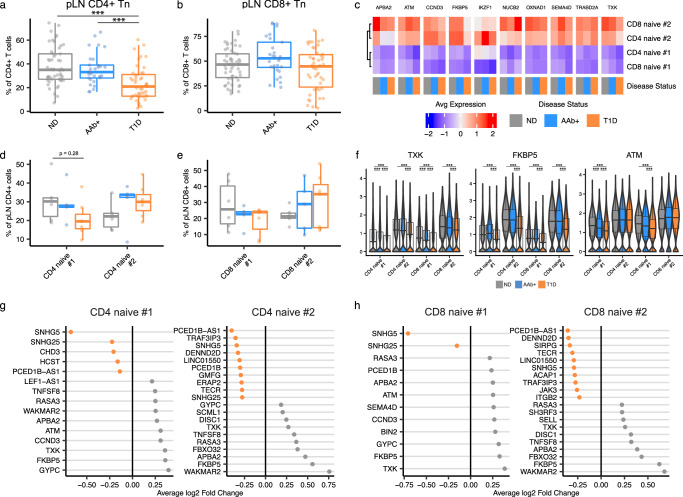
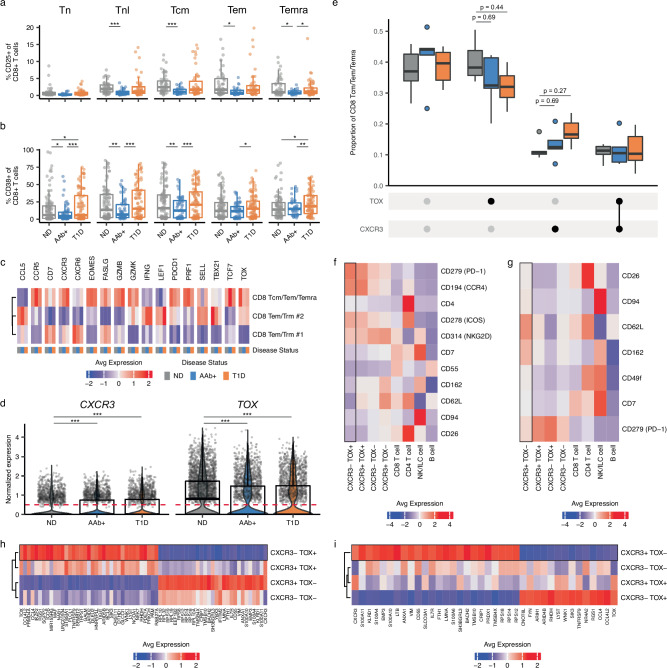
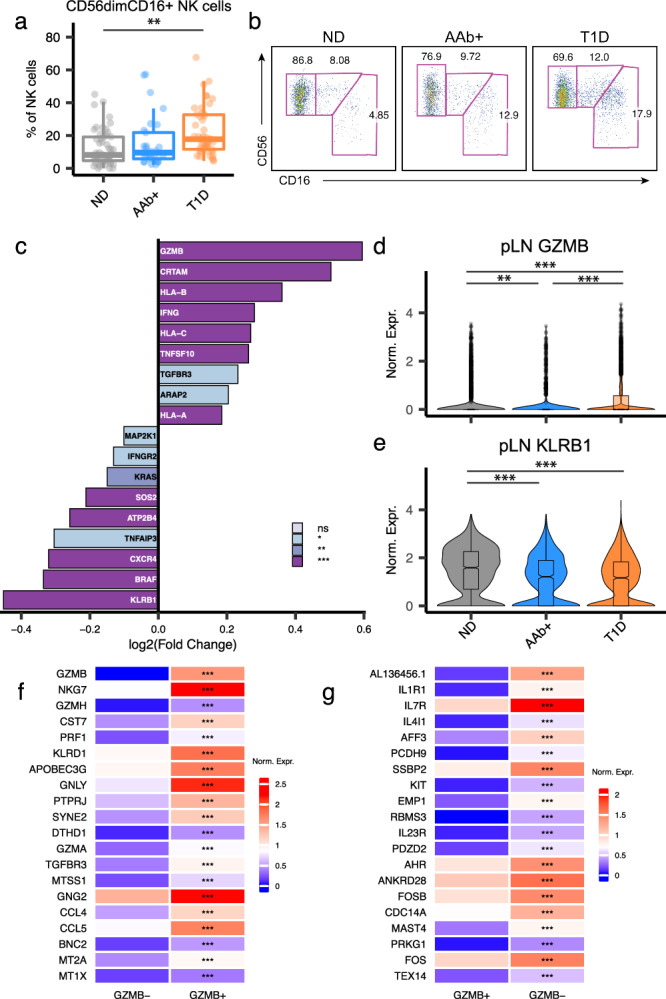
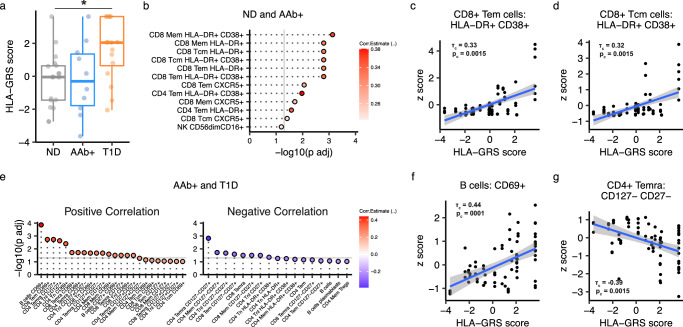
Autoimmune destruction of pancreatic β cells results in type 1 diabetes (T1D), with pancreatic immune infiltrate representing a key feature in this process. However, characterization of the immunological processes occurring in human pancreatic lymphatic tissues is lacking. Here, we conduct a comprehensive study of immune cells from pancreatic, mesenteric, and splenic lymphatic tissues of non-diabetic control (ND), β cell autoantibody-positive non-diabetic (AAb+), and T1D donors using flow cytometry and CITEseq. Compared to ND pancreas-draining lymph nodes (pLN), AAb+ and T1D donor pLNs display decreased CD4+ Treg and increased stem-like CD8+ T cell signatures, while only T1D donor pLNs exhibit naive T cell and NK cell differentiation. Mesenteric LNs have modulations only in CD4+ Tregs and naive cells, while splenocytes lack these perturbations. Further, T cell expression of activation markers and IL7 receptor correlate with T1D genetic risk. These results demonstrate tissue-restricted immune changes occur before and after T1D onset.


Conflict of interest statement

Competing interests: The authors declare no competing interests.

Figures

Fig. 1
Fig. 1. Immune profiling of pancreatic, mesenteric, and splenic lymphatic tissues.
a UMAP representation of pLN-Tail lymphocytes from and splenocytes from donor HPAP-099, highlighting tissue-specific differences in immune lineage populations detected with flow cytometry. UMAPs created in OMIQ on live CD45+ cells with default settings, with individual cells colored by their immune population identity as determined by gating on lineage surface markers. b Hierarchical clustering of all samples within the flow cytometry dataset using major immune lineage populations. Coloring of the heatmap represents an individual sample’s Z-score within the respective immune population. Immune lineage population clustering patterns were labeled and partitioned at k-means clustering level 3. c PCA and d biplot of all flow cytometry samples using frequencies of major immune lineage populations. e UMAP representation of the RNA component of the CITEseq dataset colored by tissue origin, f disease status, and g cluster annotation of each cell. h Number of cells within each cluster, further subsetted by tissue type and disease state. Source data are provided as a Source Data file.
Fig. 2
Fig. 2. AAb+ and T1D associated shifts in immune phenotypes.
a Heatmap of immune populations, detected by flow cytometry, from each tissue type that are significantly different in frequency in at least one comparison between disease states. Coloring of the heatmap represents the mean of Z-scores for a specific immune population within the specified tissue type. Statistical significance was calculated with robust one-way ANOVA, with post hoc testing using Hochberg’s multiple comparison adjustment. Only immune populations with a differential p-value < 0.01 in at least one disease comparison were plotted. b Modules of interest generated using WGCNA analysis on scRNAseq data from pLN lymphocytes in ND and T1D disease states. c Correlations of modules of interest between ND and T1D disease states, across all immune cell clusters. Correlation values and p values derived from the Pearson correlation with a false discovery rate threshold. For all panels, * is p < 0.05, ** is p < 0.01, *** is p < 0.001. Source data are provided as a Source Data file.
Fig. 3
Fig. 3. Loss and dysfunction of CD4+ Tregs in the pLNs.
a Frequency of pLN CD25+ cells or b CD25+CD127− CD4+ Treg cells within CD4+ T cell subsets, as determined by flow cytometry. Statistical significance determined by robust ANOVA with post hoc testing using Hochberg’s multiple comparison adjustment. Boxplot represents the median and interquartile range, with whiskers reaching the minima and maxima. Each data point is one pLN sample, with 52 ND, 29 AAb+, and 46 T1D samples. c Representative two-parameter density plots of CD4+ Treg cells within the pLNs, as measured by flow cytometry. d Expression of CD4+ Treg-associated genes within the CD4+ Treg/Tcm cluster from pLNs. Expression scaled within each gene. Statistical significance determined by Wilcoxon Rank Sum Test and p-value adjustment using the Bonferroni method. e Top 20 differentially expressed genes (adjusted p value < 0.05, excluding common genes (see STAR Methods)) between disease states in FOXP3+ cells within the CD4 Treg/Tcm cluster in the pLN only. Statistical significance determined by Wilcoxon Rank Sum with genes with a log fold change threshold >0.1 and p-value adjustment with the Bonferroni method across all combinatorial comparisons. For all panels in this figure, * is p < 0.05, ** is p < 0.01, *** is p < 0.001. Source data are provided as a Source Data file.
Fig. 4
Fig. 4. Decreased naive T cell signatures in T1D pLNs.
a Frequency of pLN CD4+ Tn within total CD4+ T cells or b pLN CD8+ Tn within total CD8+ T cells, as determined by flow cytometry. Statistical significance determined by two-sided robust ANOVA with post hoc testing using Hochberg’s multiple comparison adjustment. Boxplot represents median and interquartile range, with whiskers reaching the minima and maxima. Each data point is one pLN sample, with 52 ND, 29 AAb+, and 46 T1D samples. c Mean normalized expression of the top 10 most inter-connected genes in WGCNA Module 14, plotted across the naive T cell clusters in the pLNs and disease state. d Frequency of the two naive CD4+ T cell clusters and e the two naive CD8+ T cell clusters in the pLNs, across disease states. Boxplot represents median and interquartile range. P value determined by two-sided Wilcoxon ranked sum test with Benjamini-Hochberg multiple test correction. Boxplot represents median and interquartile range, with whiskers reaching the minima and maxima. Each data point is one pLN sample, with 6 ND, 5 AAb+, and 7 T1D samples. f Normalized expression of genes of interest from WGCNA Module 14, from the pLNs only. Statistical significance determined by two-sided Wilcoxon Rank Sum Test with a log fold change threshold of 0.1 and p-value adjustment using the Bonferroni method. Boxplot represents median and interquartile range, with whiskers reaching the minima and maxima. g Differentially expressed WGCNA Module 14 genes CD4 Naive #1 and CD4 Naive #2 clusters and h CD8 Naive #1 and CD8 Naive #2 clusters from the pLNs, between ND and T1D donors. Statistical significance tested using two-sided Wilcoxon Rank Sum Test with p-value adjustment using the Bonferroni method. For all panels in this figure, * is p < 0.05, ** is p < 0.01, *** is p < 0.001. Source data are provided as a Source Data file.
Fig. 5
Fig. 5. Memory CD8+ T cells display a stem-like phenotype in AAb+ and T1D pLNs.
a Frequency of CD25+ or b CD38+ cells within pLN CD8+ T cell subsets, as determined by flow cytometry. Statistical significance determined by two-sided robust ANOVA with post hoc testing using Hochberg’s multiple comparison adjustment. Boxplot represents median and interquartile range, with minima and maxima whiskers. Each data point is one pLN sample, with 52 ND, 29 AAb+, and 46 T1D samples. c Mean normalized expression of WGCNA Module 6 and effector CD8+ T cell genes of interest in pLNs. d Normalized expression of CXCR3 and TOX in pLN CD8 Tcm/Tem/Temra cells. Statistical significance determined by two-sided Wilcoxon Rank Sum test with Bonferroni correction. Dashed red line indicates the exclusive threshold (>0.5) for demarcating positive gene expression. Each point represents one cell. Boxplot information follows (a). e Frequency of pLN CD8 Tcm/Tem/Temra cells expressing permutations of CXCR3 and TOX, across disease state. P value determined by two-sided Wilcoxon rank sum test with Benjamini-Hochberg multiple test correction. Boxplot information follows (a). Each data point is one pLN sample, with 6 ND, 5 AAb+, and 7 T1D samples. f Differential surface proteins enriched in CXCR3-TOX+ cells and g CXCR3+TOX- cells compared to all other permutations of CXCR3 and TOX expression within pLN CD8 Tcm/Tem/Temra cells. Other clusters in the plot are comparators. Surface markers ranked in descending order of fold change. Statistical significance determined by Wilcoxon rank sum test on ADTs with log fold change threshold >0.1 followed by Bonferroni multiple test adjustment (adjusted p value < 0.05 denotes significance). Populations of interest highlighted by black outline. h Genes differentially expressed in CXCR3-TOX+ cells and i CXCR3 + TOX- cells, compared to the CXCR3 and TOX expression permutations, within the pLN CD8 Tcm/Tem/Temra cluster. Plot parameters are the same as in (f), but with log fold change threshold >0.25 and only genes with a p < 0.0001 are plotted. For all panels, * is p < 0.05, ** is p < 0.01, *** is p < 0.001. Source data are provided as a Source Data file.
Fig. 6
Fig. 6. Cytotoxic NK cells more prominent in T1D pLNs.
a Frequency of CD56dimCD16+ NK cells within the pLNs, as measured by flow cytometry. Statistical significance determined by two-sided robust ANOVA with post hoc testing using Hochberg’s multiple comparison adjustment. Boxplot represents median and interquartile range, with whiskers reaching the minima and maxima. Each data point is one pLN sample, with 52 ND, 29 AAb+, and 46 T1D samples. b Representative two-parameter density plots images of NK cell subsets within the pLNs. c List of differentially expressed genes, ranked by descending log2 fold change, of genes that are significantly more expressed in T1D pLNs. Cells are from a combination of the NK and NK/ILC clusters, from the pLNs only. Gene sets to test came from the Module 6 of the WGCNA analysis, which was significantly increased in NK cell clusters in T1D, and from the “Natural killer cell mediated cytotoxicity” gene set from Kyoto Encyclopedia of Genes and Genomes (KEGG). Statistical significance tested using Wilcoxon Rank Sum Test with p-value adjustment for multiple comparisons using the Bonferroni method. d Normalized expression of GZMB and e KLRB1 within the combined NK and NK/ILC clusters in the pLNs. Statistical significance tested using two-sided Wilcoxon Rank Sum Test with p-value adjustment using the Bonferroni method. Boxplot represents median and interquartile range, with whiskers reaching the minima and maxima. f Mean normalized expression of genes significantly increased in GZMB+ and g GZMB- cells from the combined NK and NK/ILC clusters in the pLNs. P value determined by two-sided Wilcoxon Rank Sum Test with p-value adjustment using the Bonferroni method. For all panels in this figure, * is p < 0.05, ** is p < 0.01, *** is p < 0.001. Source data are provided as a Source Data file.
Fig. 7
Fig. 7. Immune populations correlate with HLA genetic risk.
a HLA-GRS score of donors in the cohort. Boxplot represents median and interquartile range. P value generated with Dunn’s test with multiple hypothesis correction adjustment using Holm’s method. * is p < 0.05. Boxplot represents median and interquartile range, with whiskers reaching the minima and maxima. Each data point is one donor, with 18 ND, 10 AAb+, and 16 T1D samples. b Immune populations that significantly correlate with HLA-GRS in ND and AAb+ donors. p values generated using the Kendall tau correlation value corrected with the Benjamini-Hochberg multiplicity adjustment. Grey line represents an adjusted p value ≥ 0.05. Dot fill represents a Kendall tau correlation value corrected for disease state effects. c, d Representative plots of HLA-GRS versus immune population frequency in ND and AAb+ donors. τc is the Kendall tau correlation value corrected for disease state effects, represented by the blue linear regression line with standard error in grey. pc is the p value adjusted for disease state effects and corrected with Benjamini-Hochberg multiplicity adjustment. The greyed area represents the 95% confidence level interval for predictions from the linear model. e Immune populations that significantly correlate with HLA-GRS in AAb+ and T1D donors. All plot parameters follow (b), (f) and (g) Representative plots of HLA-GRS versus immune population frequency in AAb+ and T1D donors. All plot parameters follow (c) and (d). Source data are provided as a Source Data file.

Update of

Similar articles

Cited by

References

    1. Atkinson, M. A., Eisenbarth, G. S. & Michels, A. W. Type 1 diabetes. Lancet383, 69–82 (2014). - PMC - PubMed
    1. Insel, R. A. et al. Staging presymptomatic type 1 diabetes: a scientific statement of JDRF, the Endocrine Society, and the American Diabetes Association. Diab. Care38, 1964–1974 (2015). - PMC - PubMed
    1. Oram, R. A. et al. Most people with long-duration type 1 diabetes in a large population-based study are insulin microsecretors. Diab. Care38, 323–328 (2015). - PMC - PubMed
    1. Williams, G. M. et al. Beta cell function and ongoing autoimmunity in long-standing, childhood onset type 1 diabetes. Diabetologia59, 2722–2726 (2016). - PMC - PubMed
    1. Gubitosi-Klug, R. A. et al. Residual β cell function in long-term type 1 diabetes associates with reduced incidence of hypoglycemia. J. Clin. Invest. 131, e143011 (2021). - PMC - PubMed

MeSH terms