. 2025 May 18;16(1):4618.
doi: 10.1038/s41467-025-59648-8.

Single-cell transcriptomic characterization of microscopic colitis

Affiliations

Single-cell transcriptomic characterization of microscopic colitis

Stefan Halvorsen et al. Nat Commun. .

Abstract

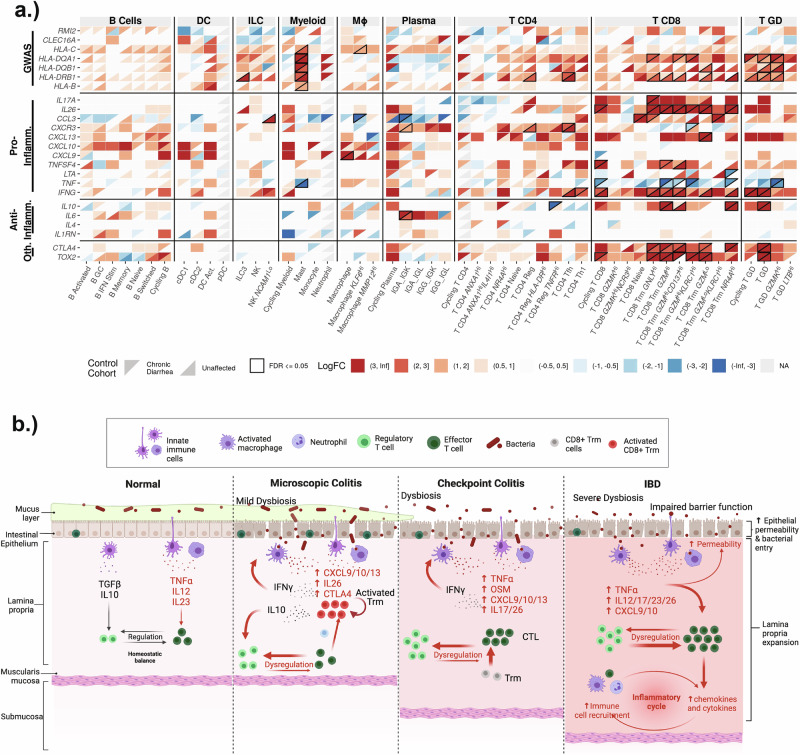
Microscopic colitis (MC) is a chronic inflammatory disease of the large intestine and a common cause of chronic diarrhea in older adults. Here, we use single-cell RNA sequencing analysis of colonic mucosal tissue to build a cellular and molecular model for MC. Our results show that in MC, there is a substantial expansion of tissue CD8+ T cells, likely arising from local expansion following T cell receptor engagement. Within the T cell compartment, MC is characterized by a shift in CD8 tissue-resident memory T cells towards a highly cytotoxic and inflammatory phenotype and expansion of CD4+ T regulatory cells. These results provide insight into inflammatory cytokines shaping MC pathogenesis and highlight notable similarities and differences with other immune-mediated intestinal diseases, including a common upregulation of IL26 and an MC-specific upregulation of IL10. These data help identify targets against enteric T cell subsets as an effective strategy for treatment of MC.


Conflict of interest statement

Competing interests: Hamed Khalili has received consulting fees from Aditium Bio and currently serves on the clinical advisory board of Cylinder Health. A.C.V. has a financial interest in 10X Genomics. 10X Genomics designs and manufactures gene sequencing technology for use in research, and such technology is being used in this research; these interests were reviewed by The Massachusetts General Hospital and Mass General Brigham in accordance with their institutional policies. The remaining authors declare no competing interests.

Figures

Fig. 1
Fig. 1. Study overview.
Overview of the study design, sample collection, and sequencing. Patients were classified into three cohorts based on a combination of microscopic examination of colon biopsies and clinical symptoms (n = 16 for active microscopic colitis, n = 13 for chronic diarrhea, and n = 16 for unaffected controls). Biopsies were enzymatically digested, and single cells were encapsulated using either 10X Genomics or inDrops technologies. Library construction was finished, and libraries were sequenced on Illumina instruments. Created in BioRender. Halvorsen, S. (2025) https://BioRender.com/d85k894.
Fig. 2
Fig. 2. Overview of immune cells.
a UMAP plot illustrating all immune cells and corresponding cluster assignments. b Dot plots showing the distribution of representative markers for the cell types. c Stacked bar plot demonstrating the relative enrichment of each cell type by cohort designation. d Boxplots showing the per-patient proportional differences from selected cell types. The proportions shown are the proportions of all immune cells for each patient. e Violin plots showing the distribution of representative markers for the different types of cycling cells. f Boxplots showing the per-patient proportional differences from the different types of cycling cells. The proportions shown are relative to the number of all cycling cells for each patient. For (D) and (F) significance was calculated using scCODA—n.s. indicates the MC proportions are not significantly different from controls, and an asterisk (*) indicates significance at an FDR level of 0.05. Number of patients in each cohort in each panel: MC (n = 16); chronic diarrhea (n = 13); unaffected (n = 15). Patients with no cells in a given identity class were not plotted. Boxplot center line represents the median; the box bounds span from the first to the third quartile; whiskers extend from the box to the largest value no further than 1.5 * inter-quartile-range from the box. Source data are provided as a Source Data file.
Fig. 3
Fig. 3. Subclustering of CD8 T Cells.
a UMAP plot showing the subclustering of CD8 T cells, and corresponding cluster designations. b Violin plots showing the distribution of representative markers for the identified cell types. c Stacked bar plot demonstrating the relative enrichment of each CD8 T cell subset by cohort designation. d Boxplots showing the per-patient proportional differences from each of the subtypes. The proportions shown are relative to the number of all CD8 T cells for each patient. Significance was calculated using scCODA—n.s. indicates the MC proportions are not significantly different from controls, and an asterisk (*) indicates significance at an FDR level of 0.05. Number of patients in each cohort: MC (n = 16); chronic diarrhea (n = 13); unaffected controls (n = 15). Patients with no cells in a given identity class were not plotted. Boxplot center line represents the median; the box bounds span from the first to the third quartile; whiskers extend from the box to the largest value no further than 1.5 * inter-quartile-range from the box. e RNAscope images of a representative patient from each cohort. Number of slides examined for each cohort: n = 8 for active MC, n = 8 for CD, n = 9 for unaffected controls. The fluorescent images are colored as follows: DAPI: blue; CD8: white; BATF: green; GZMB: magenta. Quantitation of all patient slides and individual channels is shown separately in Supplementary Fig. S11. Source data are provided as a Source Data file.
Fig. 4
Fig. 4. TCR Clonotype analysis identifies increased TCR diversity and points to local replication of CD8 T cells driving the enrichment of GzmHi Trm cells.
a TCR clonotypes were merged and a clonotype frequency table was constructed for each patient. The composition was plotted as a stacked bar plot. Each bar represents a unique clonotype, and the height of the bar is scaled based on the proportion. b Shannon diversity of the clonotypes was calculated for each patient, and plotted as a boxplot. Number of patients in each cohort: MC (n = 8); chronic diarrhea (n = 6); unaffected controls (n = 5). Boxplot center line represents the median; the box bounds span from the first to the third quartile; whiskers extend from the box to the largest value no further than 1.5 * inter-quartile-range from the box. c Clonotypes were classified as expanded if they are present in at least two cells. UMAP plot for CD8 T cells is shown, separated by cohort. Cells with an expanded clonotype are marked in red. d Cross-cluster clonotype sharing is visualized as a heatmap. Each cell in the plot illustrates the number of clonotypes shared between the cluster on the x-axis and the cluster on the y-axis. The cells on the diagonal represent the total number of unique clonotypes in the corresponding cluster. Clusters labeled in red were identified in the scRNAseq compositional analysis as potentially consequential for disease pathogenesis, and clusters demarcated with * exhibit significantly different clonotype sharing between MC and controls when analyzed using a two-sided Fisher’s Exact Test. Number of patients in each cohort: MC (n = 8); chronic diarrhea (n = 6); unaffected controls (n = 5). Source data are provided as a Source Data file.
Fig. 5
Fig. 5. Subclustering of CD4 T Cells.
a UMAP plot showing the subclustering of CD4 T cells, and corresponding cluster designations. b Dot plots showing the distribution of representative markers for the identified cell types. c Stacked bar plot demonstrating the relative enrichment of each CD4 T cell subset by cohort designation. d Boxplots showing the per-patient proportional differences from each of the subtypes. The proportions shown are relative to the total number of CD4 T cells for each patient. Significance was calculated using scCODA—n.s. indicates the MC proportions are not significantly different from controls, and an asterisk (*) indicates significance at an FDR level of 0.05. Number of patients in each cohort: MC (n = 16); chronic diarrhea (n = 13); unaffected controls(n = 15). Patients with no cells in a given identity class were not plotted. Boxplot center line represents the median; the box bounds span from the first to the third quartile; whiskers extend from the box to the largest value no further than 1.5 * inter-quartile-range from the box. e RNAscope images of a representative patient from each cohort. Number of slides examined for each cohort: n = 8 for active MC, n = 8 for CD, n = 9 for unaffected controls. The fluorescent images are colored as follows: DAPI: blue; CD4: white; FOXP3: green; HLA-DRB1: magenta. Quantitation of all patient slides and individual channels is shown separately in Supplementary Fig. S12. Source data are provided as a Source Data file.
Fig. 6
Fig. 6. A comprehensive pathologic model of colitides.
a Pseudobulk analysis was used to compare MC expression profiles to both chronic diarrhea and unaffected control cohorts. A selection of informative genes is shown here, with more shown in the supplement (Supplementary Fig. S16). Expression comparisons are plotted as a heatmap, with rows representing genes, and columns representing cell types. Color indicates level of fold-change; the top-left of each box represents MC vs. chronic diarrhea fold-change, while the bottom-right of each box represents MC vs. unaffected controls fold-change. Comparisons that reached statistical significance (FDR < 0.05) are bounded by a black border. Genes are grouped based on their classification: GWAS (genes previously implicated in GWAS studies); Pro-Inflamm. (a selection of pro-inflammatory genes); Anti-Inflamm. (a selection of anti-inflammatory genes); Oth. (other genes that are indicative of TCR engagement). b A model summarizing our findings, in the context of existing literature for IBD and checkpoint inhibitor-induced colitis (irColitis), is shown. Microscopic Colitis, characterized by a relatively mild dysbiosis and no loss of mucosal integrity, is contrasted with irColitis and IBD, where dysbiosis, epithelial damage, and loss of mucosal integrity are common. Elevated CXCL9/10 and IL26 are a common theme among colitides. Elevated INFG, produced by CD8 T cells, is also common to all colitides. MC has an over-expression of anti-inflammatory IL10, and downregulation of TNF. Dysregulation of the CD4 Treg compartment is a common theme among colitides, presenting in MC as an expansion of CD4 regulatory cells. MC patients are further characterized by a shift in the CD8 Trm T cell compartment towards cells with an activated phenotype. Created in BioRender. Halvorsen, S. (2025) https://BioRender.com/b13b957.

References

    1. Khalili, H. et al. Mortality of patients with microscopic colitis in Sweden. Clin. Gastroenterol. Hepatol.18, 2491–2499.e3 (2020). - PubMed
    1. Kane, J. S., Irvine, A. J., Derwa, Y. & Ford, A. C. Fatigue and its associated factors in microscopic colitis. Ther. Adv. Gastroenterol.11, 1756284818799599 (2018). - PMC - PubMed
    1. Nyhlin, N., Wickbom, A., Montgomery, S. M., Tysk, C. & Bohr, J. Long-term prognosis of clinical symptoms and health-related quality of life in microscopic colitis: a case-control study. Aliment Pharm. Ther.39, 963–972 (2014). - PubMed
    1. Guagnozzi, D., Lucendo, A. J., Angueira-Lapeña, T., González-Castillo, S. & Tenias Burillo, J. M. Prevalence and incidence of microscopic colitis in patients with diarrhoea of unknown aetiology in a region in central Spain. Dig. Liver Dis.44, 384–388 (2012). - PubMed
    1. Olesen, M., Eriksson, S., Bohr, J., Järnerot, G. & Tysk, C. Microscopic colitis: a common diarrhoeal disease. An epidemiological study in Orebro, Sweden, 1993-1998. Gut53, 346–350 (2004). - PMC - PubMed

MeSH terms