. 2025 May 18;16(1):806.
doi: 10.1007/s12672-025-02652-7.

An energy metabolism-related signature relevant to the tumor immune microenvironment in HNSCC

Affiliations

An energy metabolism-related signature relevant to the tumor immune microenvironment in HNSCC

Kaiyu Zhu et al. Discov Oncol. .

Abstract

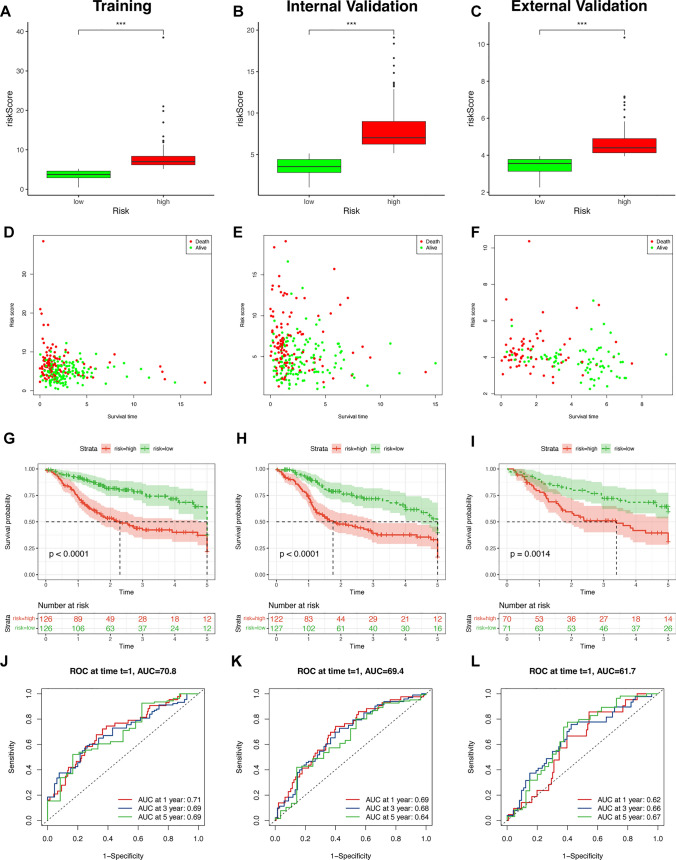
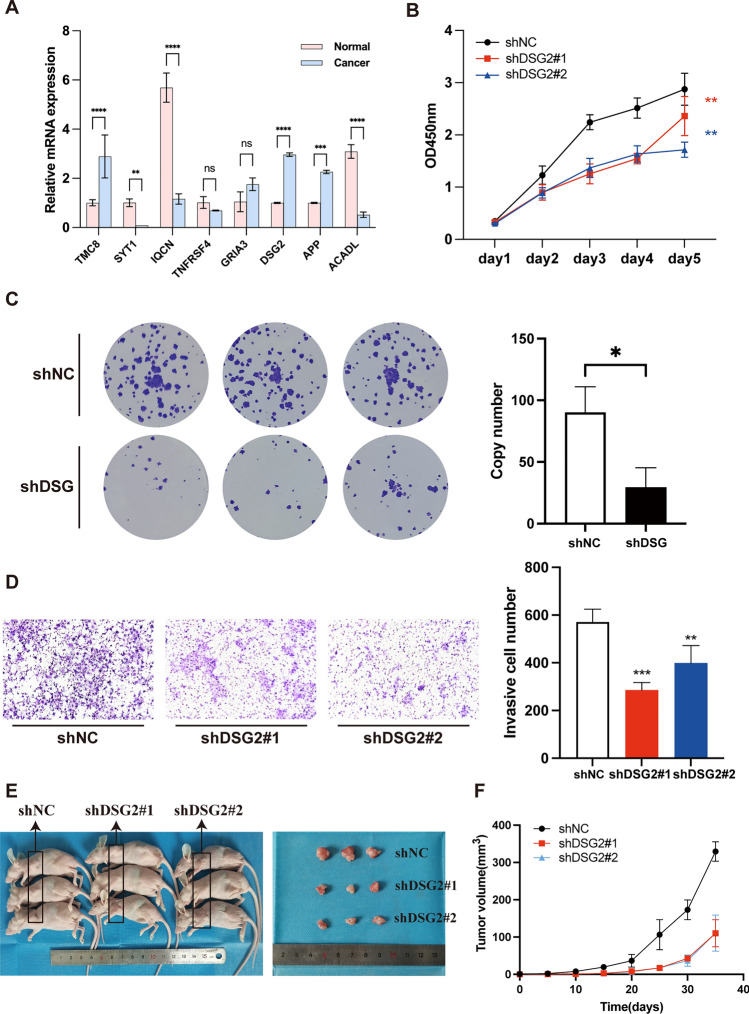
The importance of energy metabolism in cancer was explored by accumulating studies. Energy metabolism can affect the cellular activities of tumors. However, there is few research exploring the role of energy metabolism in tumor immune microenvironment. In this context, we constructed a novel energy metabolism-related prognostic signature containing 8 genes. The risk score calculated by the signature was analyzed to be an independent value of head and neck squamous cell carcinoma (HNSCC). We further validated the effectiveness and accuracy of our signature in The Cancer Genome Atlas Program (TCGA) cohort and Gene Expression Omnibus (GEO) cohort. Moreover, we also revealed a negative correlation between the risk score and the activity of the immune processes. Finally, we validated the function of Desmoglein 2 protein (DSG2), a risk gene in the signature, in tumor progression and found that knockdown of DSG2 remarkably suppressed the proliferation and migration of HNSCC cells, which further validated our analysis. In conclusion, the energy metabolism-related gene signature we built is a prospective biomarker of HNSCC, which can offer valuable clues for the research and development of immunotherapeutic drugs in HNSCC.

Keywords: DSG2; Energy metabolism; Head and neck squamous cell carcinoma; Prognostic signature; Tumor immune microenvironment.


Conflict of interest statement

Declarations. Ethics approval: All procedures in our study involving human tissues and animals adhered to the ethical standards set by the Institutional Ethics Committee of The Fourth Hospital of Changsha, as well as the 1964 Helsinki Declaration and its subsequent amendments. The code for the animal study protocol was CSSDSYY-YXLL-SC-2023-03-03, while the code for the human study protocol was CSSDSYY-YXLL-SC-2023-03-163. Written informed consent was obtained from all patients. Conflicts of interest: The authors declare no competing interests. Competing interests: The authors declare no competing interests.

Figures

Fig. 1
Fig. 1
Study flowchart. A total of 19,938 mRNAs and the integration of energy metabolism (110 genes) were obtained. Spearman correlation analysis was used to define 877 EMRDEGs. Then, forty-six prognostic EMRGs were identified by using uni-Cox regression analysis. A prognostic model with 8 prognostic EMRGs was constructed. Subsequently, GSEA analyses, immune-related analyses, somatic mutation, and drug sensitivity analysis were applied to identify the potential function of this signature. Finally, we performed qRT-PCR, CCK-8 assay, cell invasion assay, plate colony formation assay, and animal experiment to further validate our signature in vitro and in vivo
Fig. 2
Fig. 2
Identification of DEGs and prognostic analysis of EMRDEGs: A the volcano plot of mRNAs. Green point indicates |log2 FC|> 1, blue point indicates FDR < 0.05, red point indicates |log2 FC|> 1 and FDR < 0.05. B Venn diagram to identify the common genes of DEGs and EMRGs. C Forest plot showed the results of the univariate Cox regression analysis of approximately 46 prognostic EMRDEGs. D The correlation between 46 prognostic EMRDEGs and 110 genes from the integration of energy metabolism
Fig. 3
Fig. 3
Construction of an 8-EMRG signature and the analysis of independent prognostic potential: A, B The cvfit and lambda curves showing LASSO regression were performed with the minimum criteria. C, D The results of the univariate Cox analysis and multivariate Cox analysis of clinical factors and risk score with OS. *p < 0.05, **p < 0.01, ***p < 0.001. ns, No significance. E The nomogram to predict the 1-year, 3-year, and 5-year overall survival rates of TCGA-HNSCC patients. F The calibration plot for evaluating the accuracy of the nomogram model. The dashed diagonal line in gray represents the ideal nomogram
Fig. 4
Fig. 4
Verification of the 8-EMRG signature model in the training, internal validation, and external validation groups: The distributions of the risk scores and overall survival status in the training (A, D), internal validation (B, E), and external validation (C, F) groups, *p < 0.05, **p < 0.01, and ***p < 0.001. Kaplan–Meier curves for survival status and survival time in the training (G), internal validation (H), and external validation (I) groups. The 1-year, 3-year, and 5-year ROC curves of the training (J), internal validation (K), and external validation (L) groups, respectively
Fig. 5
Fig. 5
The prognostic ability of the 8-EMRG signature for OS in multiple HNSCC subtypes. Kaplan–Meier curves for OS prediction in HNSCC subtypes of A age > 65 years, B age ≤ 65 years, C male, D female, E stages I–II, F stages III–IV, G T1–2, H T3–4, I N0, J N123
Fig. 6
Fig. 6
Biological functional and pathway enrichment analysis of two risk groups based on the 8-EMRG signature. A GESA showing significant enrichment of cancer proliferation pathways in high-risk HNSCC patients. B GSEA showing significant enrichment of immune-related pathways in low-risk HNSCC patients. C GO analysis showing many immune-related biological processes were enriched. D KEGG analysis showing many immune-related pathways were enriched
Fig. 7
Fig. 7
Immune cell infiltration analyses between the high- and low-risk groups: the stromal, immune, and ESTIMATE scores between the high-risk and low-risk groups in TCGA patients (A) and GEO patients (B). The overall view of the relative proportions of 22 TIICs in TCGA patients (C) and GEO patients (D). The boxplots for the comparison of the 22 tumor-infiltrating immune cells between the high-risk (red) and low-risk groups (blue) in TCGA patients (E) and GEO patients (F)
Fig. 8
Fig. 8
Association of TIICs infiltration level with the 8 selected EMRGs: comparison of infiltration levels of 12 types of tumor-infiltrating immune cells according to ACADL (A), APP (B), DSG2 (C), GRIA3 (D), IQCN (E), SYT1 (F), TMC8 (G), and TNFRSF4 (H) expression levels. *p < 0.05, **p < 0.01, and ***p < 0.001
Fig. 9
Fig. 9
Association of 6 immune cell infiltration levels with the 8 selected EMRGs: Comparison of infiltration levels of six immune cells according to the expression levels of ACADL (A), APP (B), DSG2 (C), GRIA3 (D), IQCN (E), SYT1 (F), TMC8 (G), and TNFRSF4 (H). *p < 0.05, **p < 0.01, and ***p < 0.001. I The correlation between risk score and the infiltration levels of B cells, T cells CD4+, T cells CD8+, neutrophil, macrophage, and myeloid dendritic cells. Red presents negative correlation, blue presents positive correlation. *p < 0.05, **p < 0.01, ***p < 0.001. ns, No significance
Fig. 10
Fig. 10
Comparing the effects of immunotherapy and chemotherapy in the high- and low-risk groups. (A) The boxplots for the comparison of the immune checkpoint genes between the high-risk and low-risk groups in HNSCC patients. (B) The violin plot of the TIDE score in the high-risk and low-risk group. (C-L) Boxplot showing the differences in estimated IC50 values of 10 representative drugs (Axitinib, cisplatin, cyclopamine, docetaxel, gefitinib, imatinib, metformin, methotrexate, pazopanib, vinorelbine) between high-risk and low-risk groups. *p < 0.05, **p < 0.01, and ***p < 0.001
Fig. 11
Fig. 11
Somatic mutation landscape in HNSCC patients. AD The MAF-summary plots show the variant classification, variant types, SNV class, variants per sample, variant classification summary, and the top 10 mutated genes in the high-risk (A) and low-risk group (C). The oncoplots display the mutation profile of the top 10 frequently mutated types in the high-risk (B) and low-risk groups (D). Each column represents individual patients and mutated genes arranged by mutation rates. The right panel shows the mutation percentage, and color coding indicates the mutation type
Fig. 12
Fig. 12
DSG2 promotes the tumorigenicity of HNSCC cells in vitro and in vivo. A The mRNA expression analysis by qRT‒PCR. B Knockdown of DSG2 significantly reduced cell proliferation by CCK8 assay in FADU. C Representative image of the plate colony formation assay implying that knockdown of DSG2 reduced growth of FADU cell. D Representative images of the Transwell invasion assay implying that knockdown of DSG2 reduce FADU cell invasion. E Imaging of mice (left) and xenograft tumors (right) showed that DSG2 silencing led to smaller tumors. F Tumor formation growth curves. *p < 0.05, **p < 0.01, ***p < 0.001, ****p < 0.0001. ns, No significance

Similar articles

References

    1. Jung K, et al. Squamous cell carcinoma of head and neck: what internists should know. Korean J Intern Med. 2020;35(5):1031–44. - PMC - PubMed
    1. Weiss J, Hayes DN. Classifying squamous cell carcinoma of the head and neck: prognosis, prediction and implications for therapy. Expert Rev Anticancer Ther. 2014;14(2):229–36. - PubMed
    1. Van den Bossche V, et al. Microenvironment-driven intratumoral heterogeneity in head and neck cancers: clinical challenges and opportunities for precision medicine. Drug Resist Updates. 2022;60: 100806. - PubMed
    1. Li Z, Zhang H. Reprogramming of glucose, fatty acid and amino acid metabolism for cancer progression. Cell Mol Life Sci. 2016;73(2):377–92. - PMC - PubMed
    1. Gillespie M, et al. The reactome pathway knowledgebase 2022. Nucleic Acids Res. 2022;50(D1):D687-d692. - PMC - PubMed

LinkOut - more resources