. 2025 May 22:1-24.
doi: 10.1080/15548627.2025.2508064. Online ahead of print.

TRIM16 mediates secretory autophagy in head and neck cancer-associated fibroblasts

Affiliations

TRIM16 mediates secretory autophagy in head and neck cancer-associated fibroblasts

Thuc Ly et al. Autophagy. .

Abstract

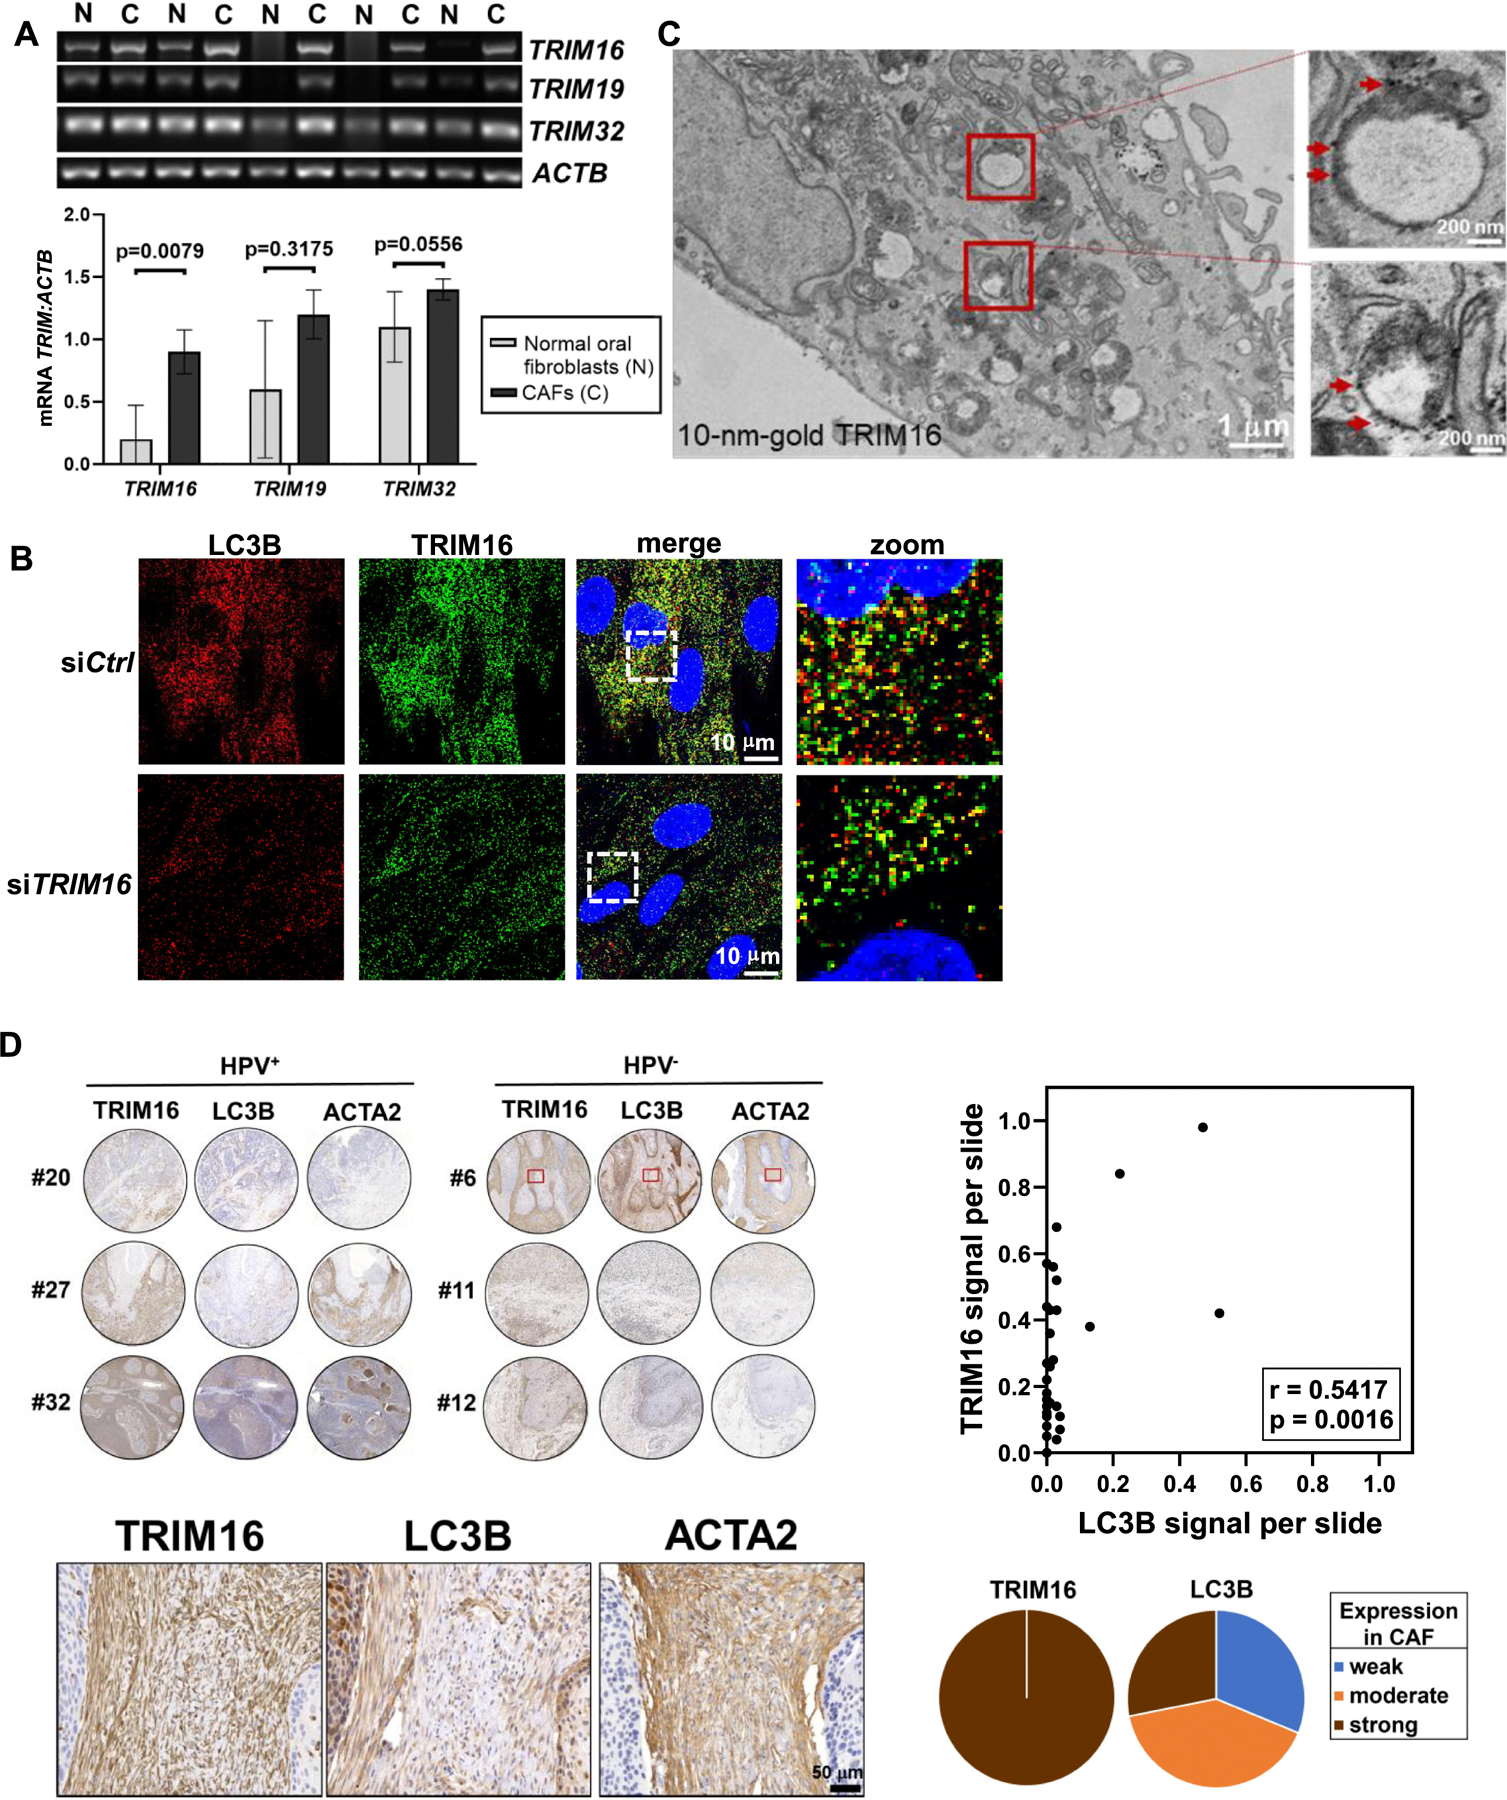
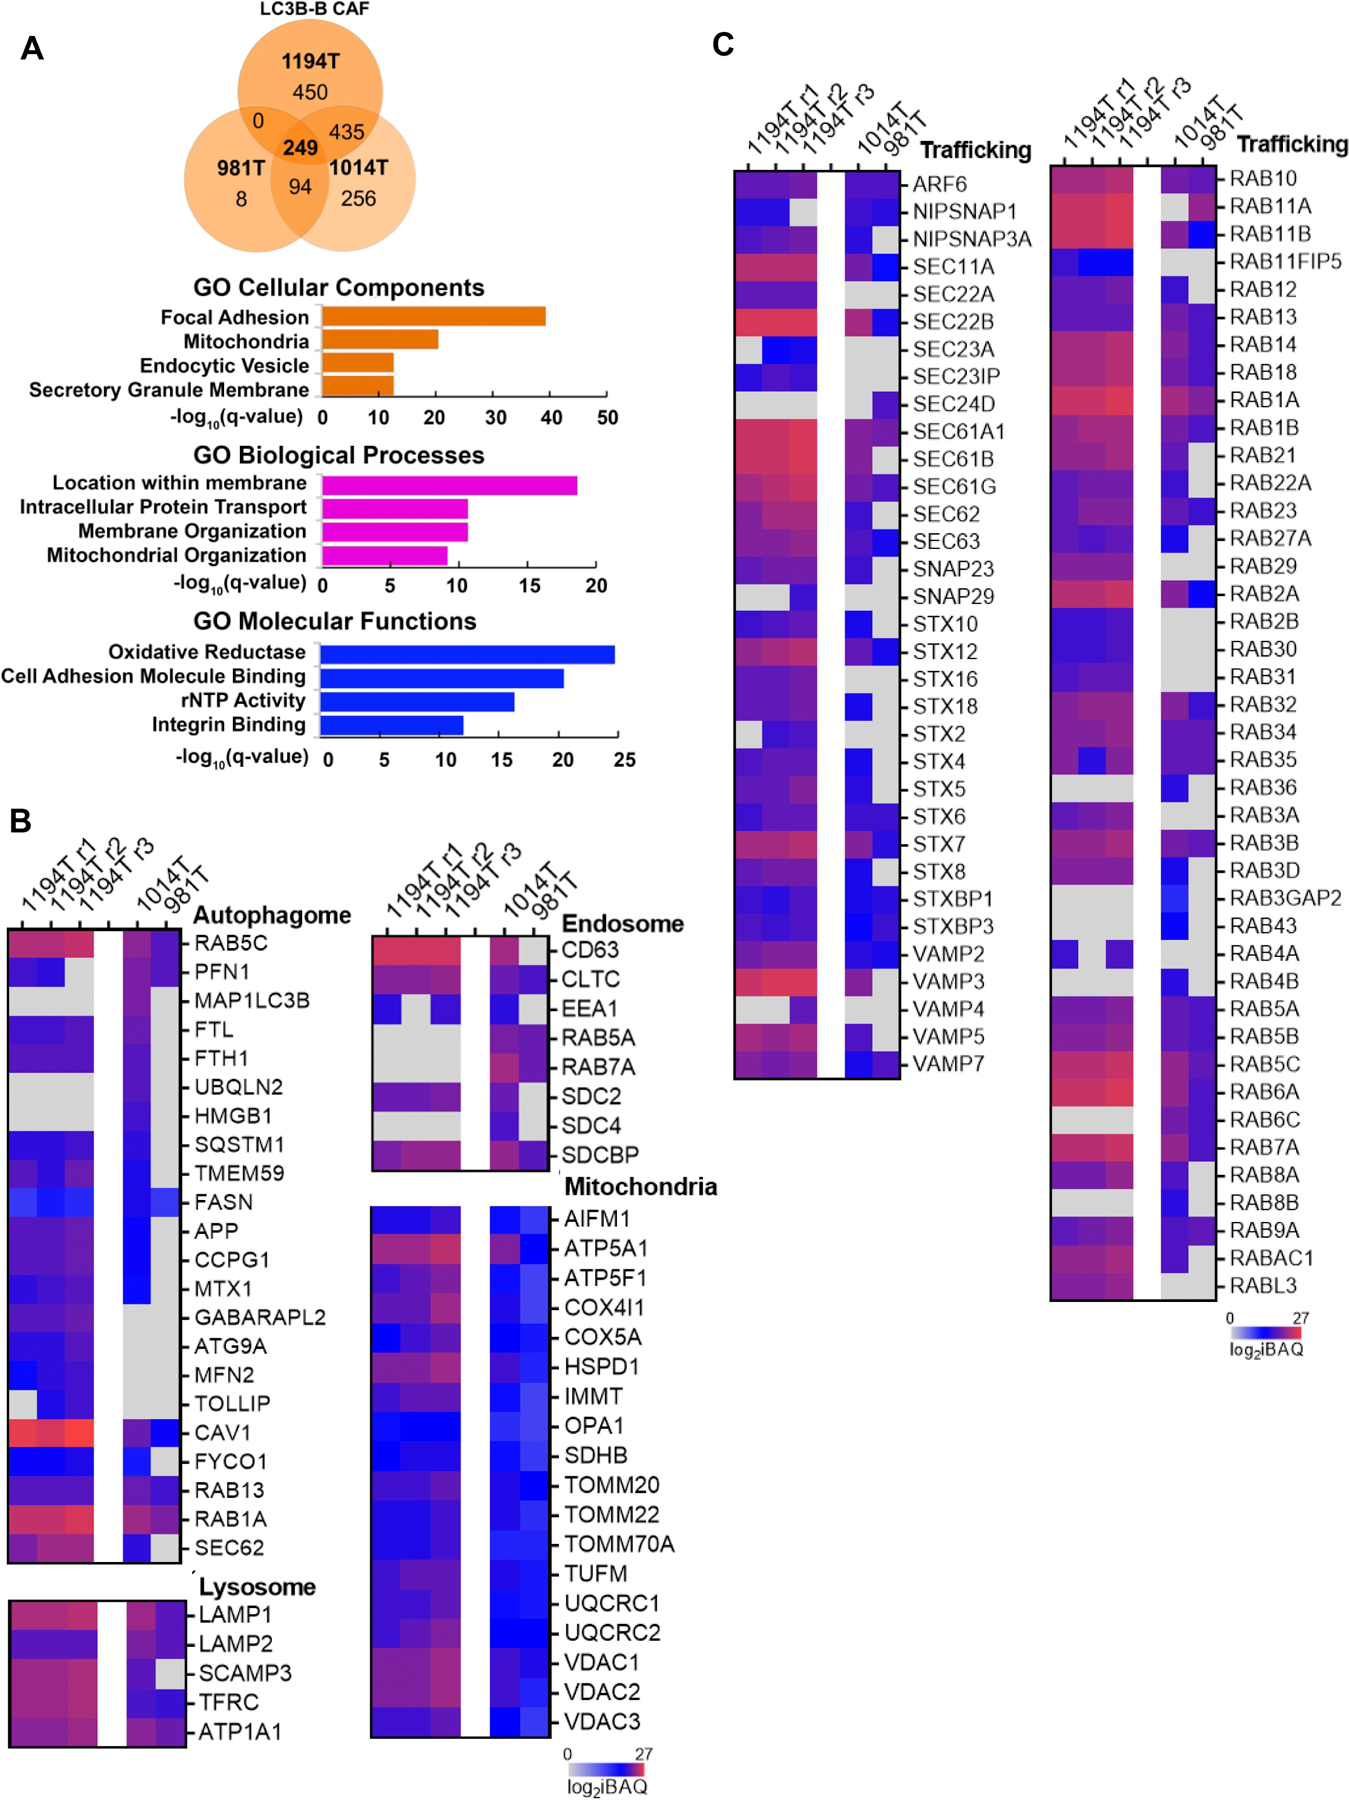
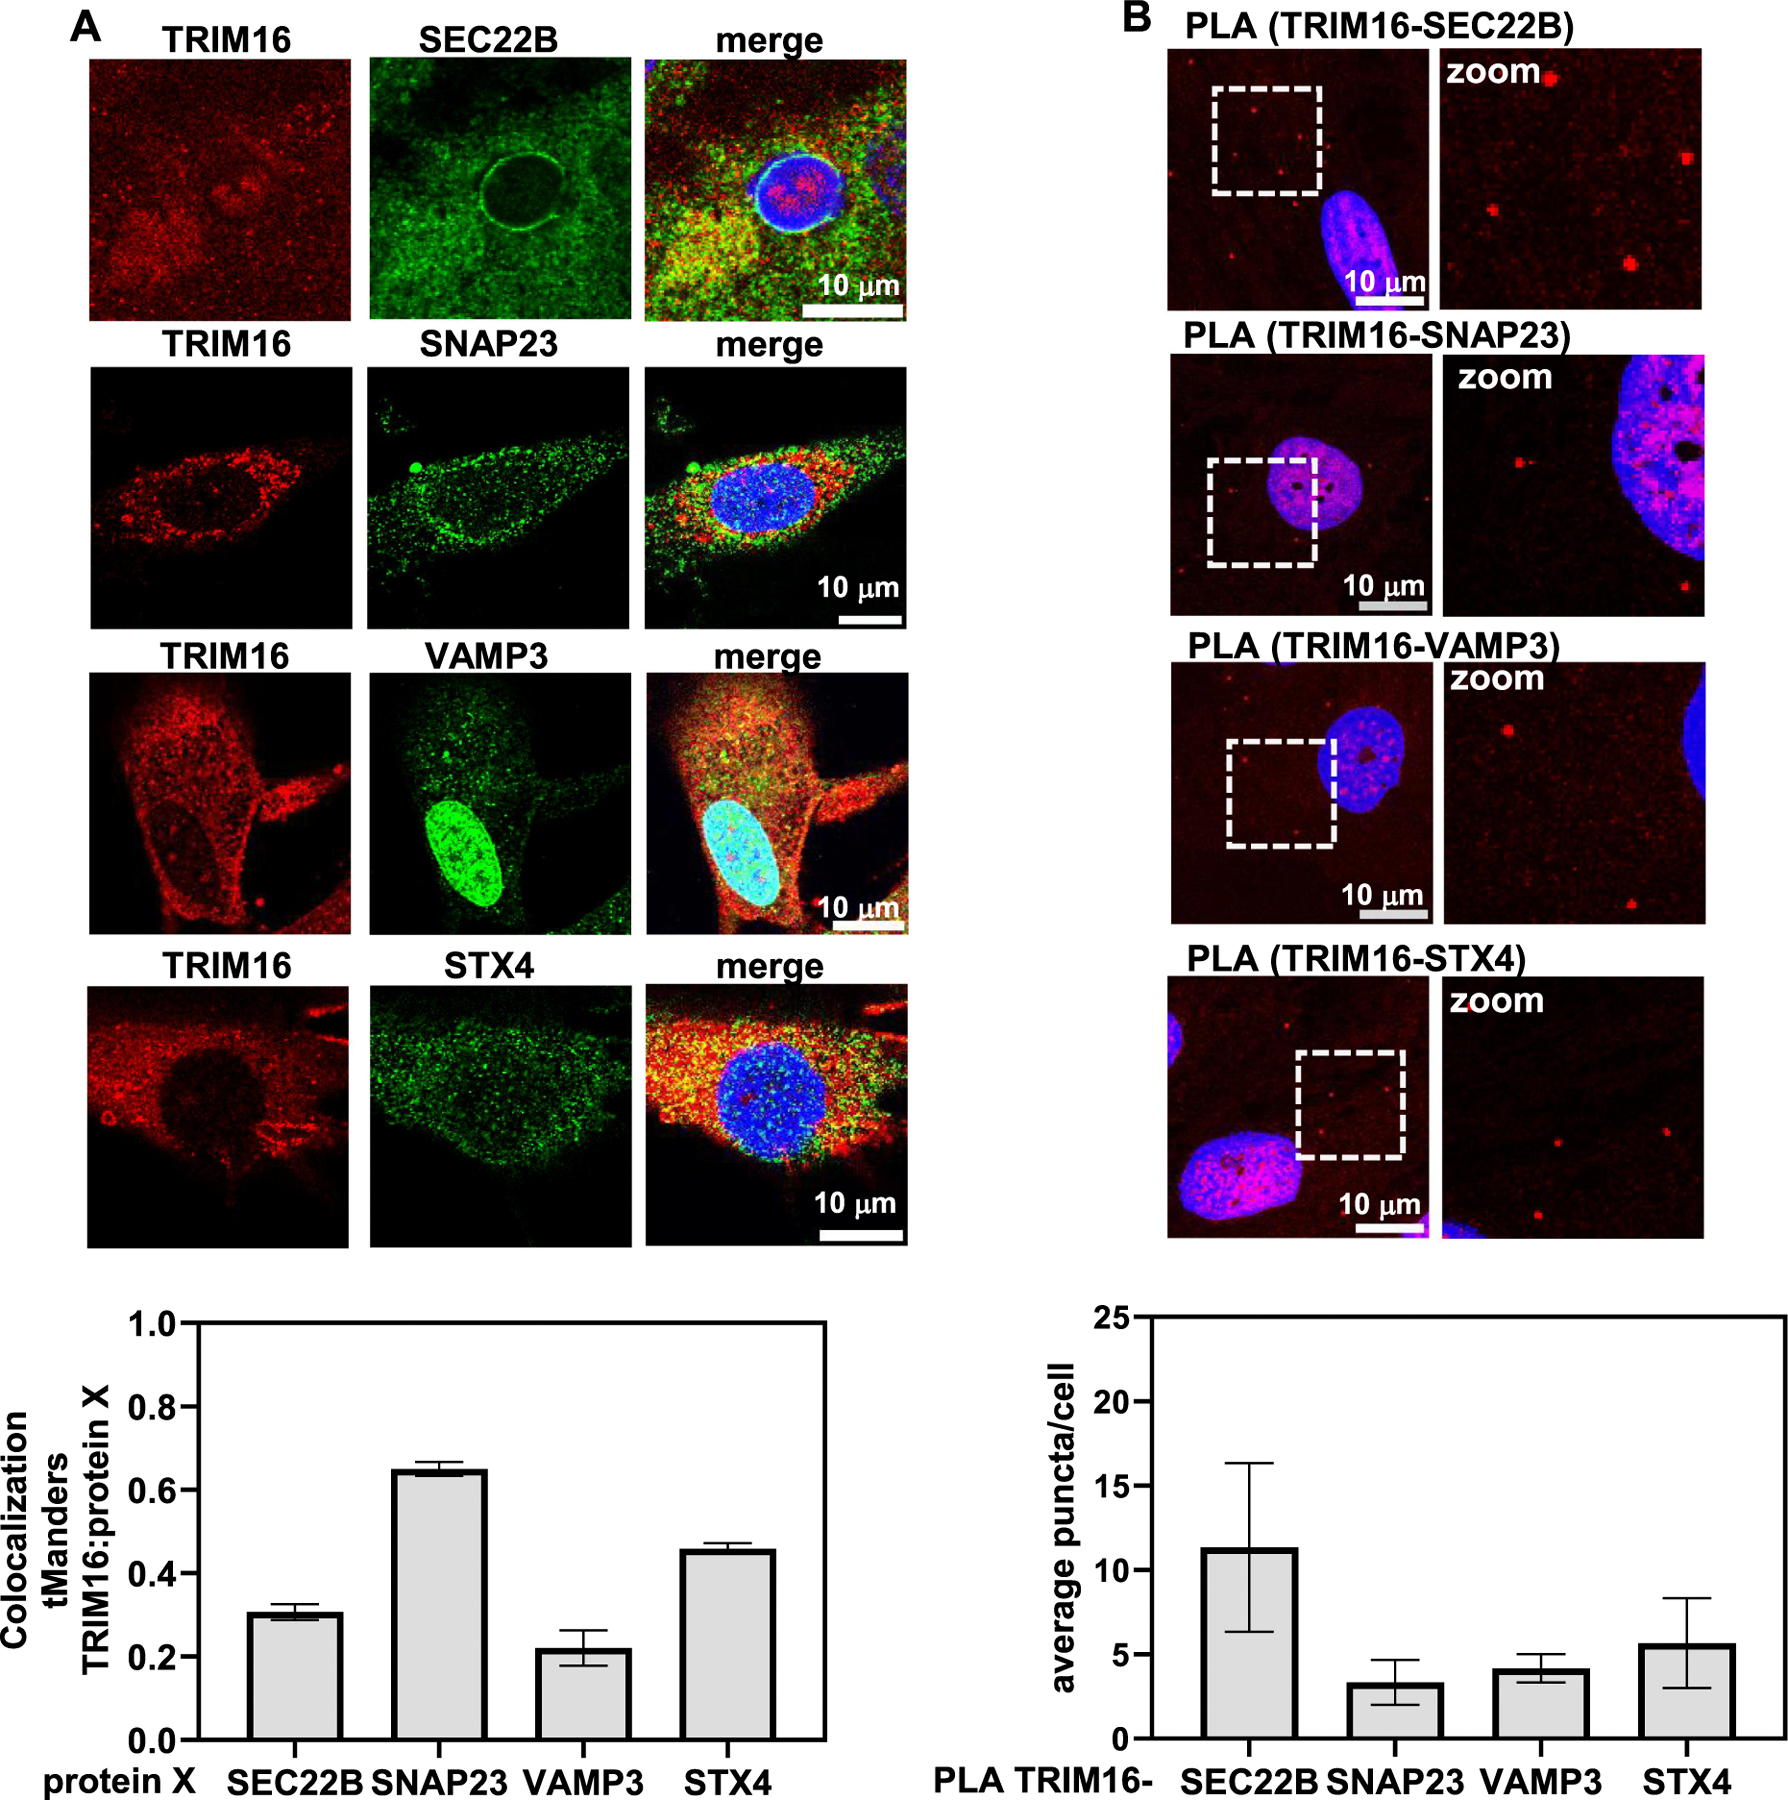
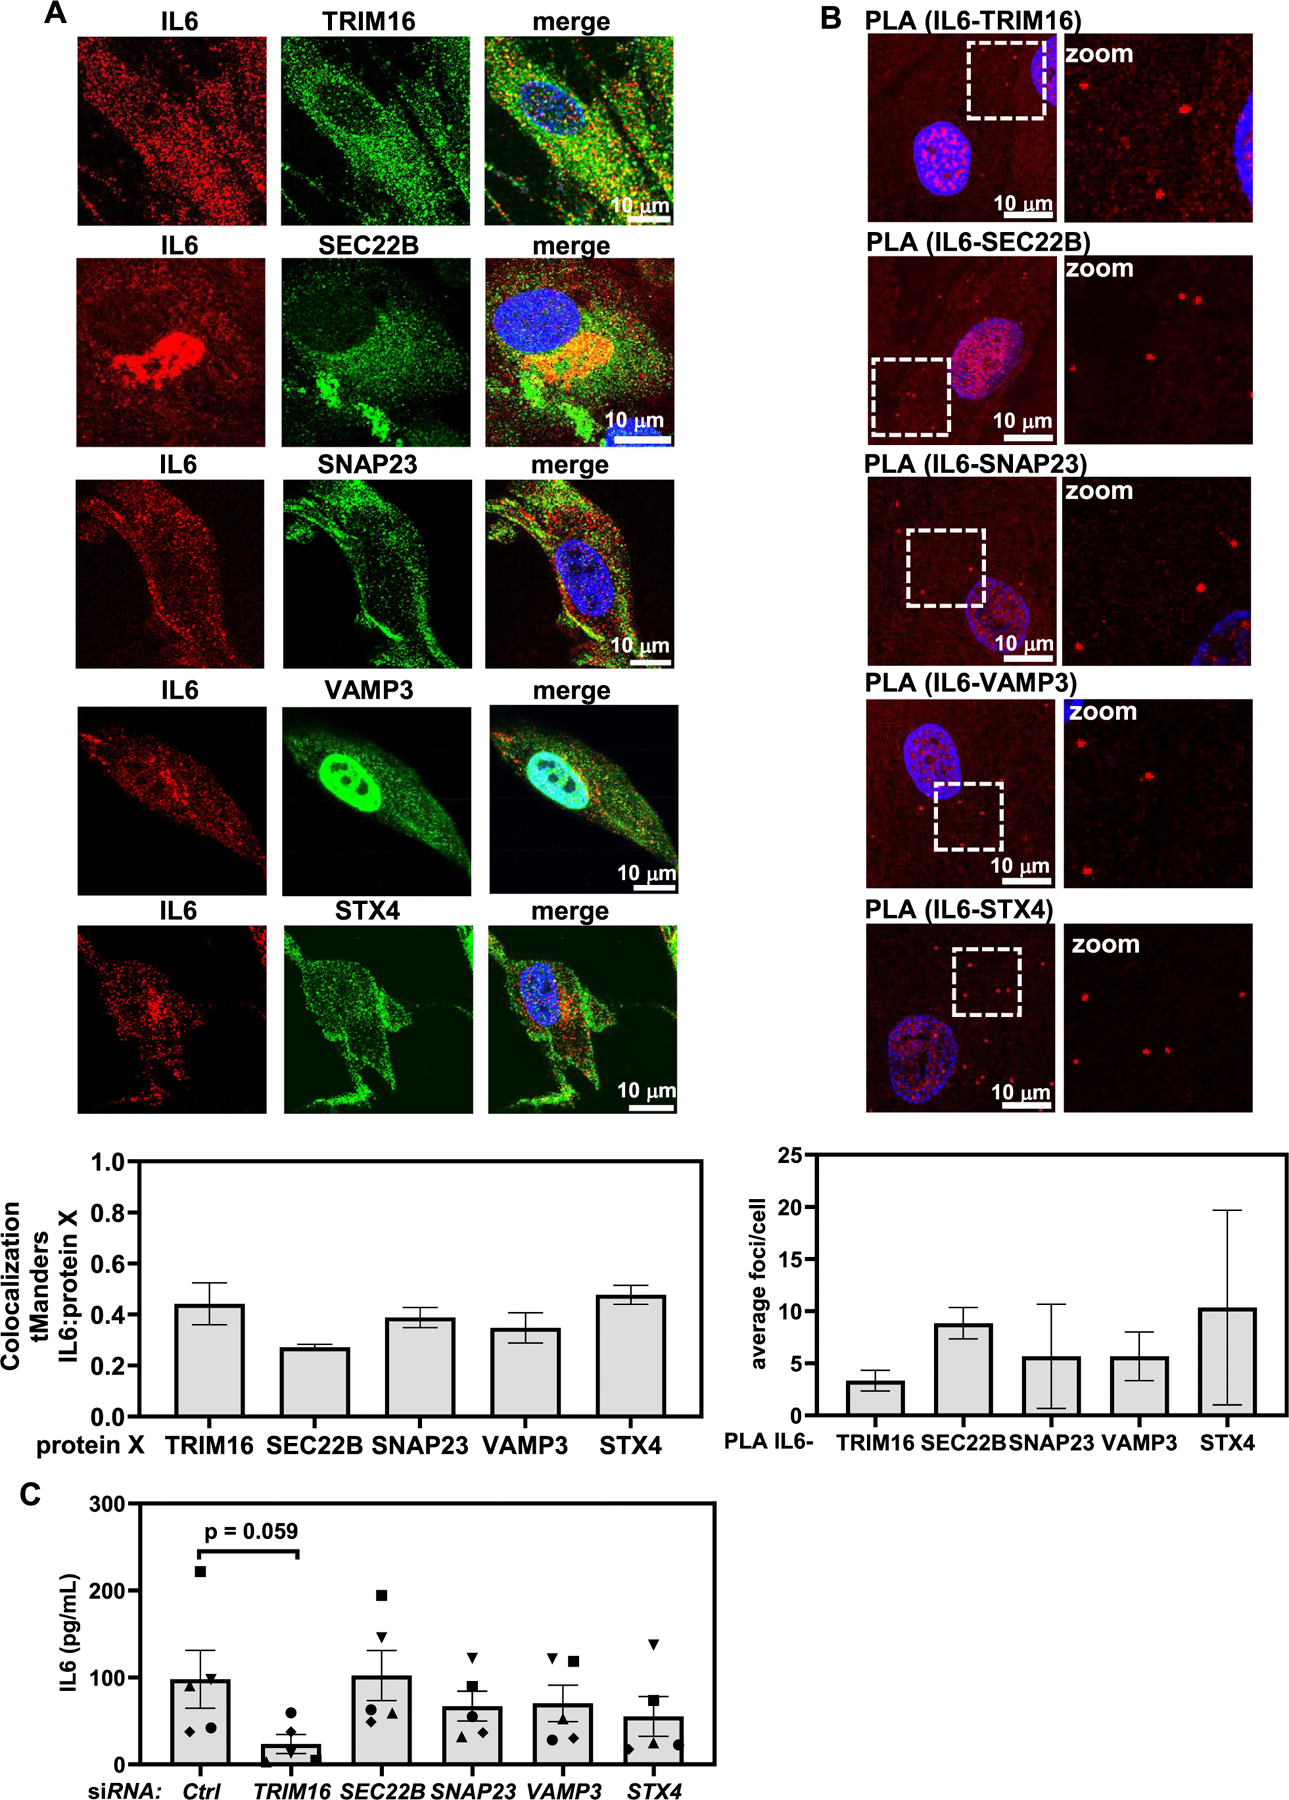
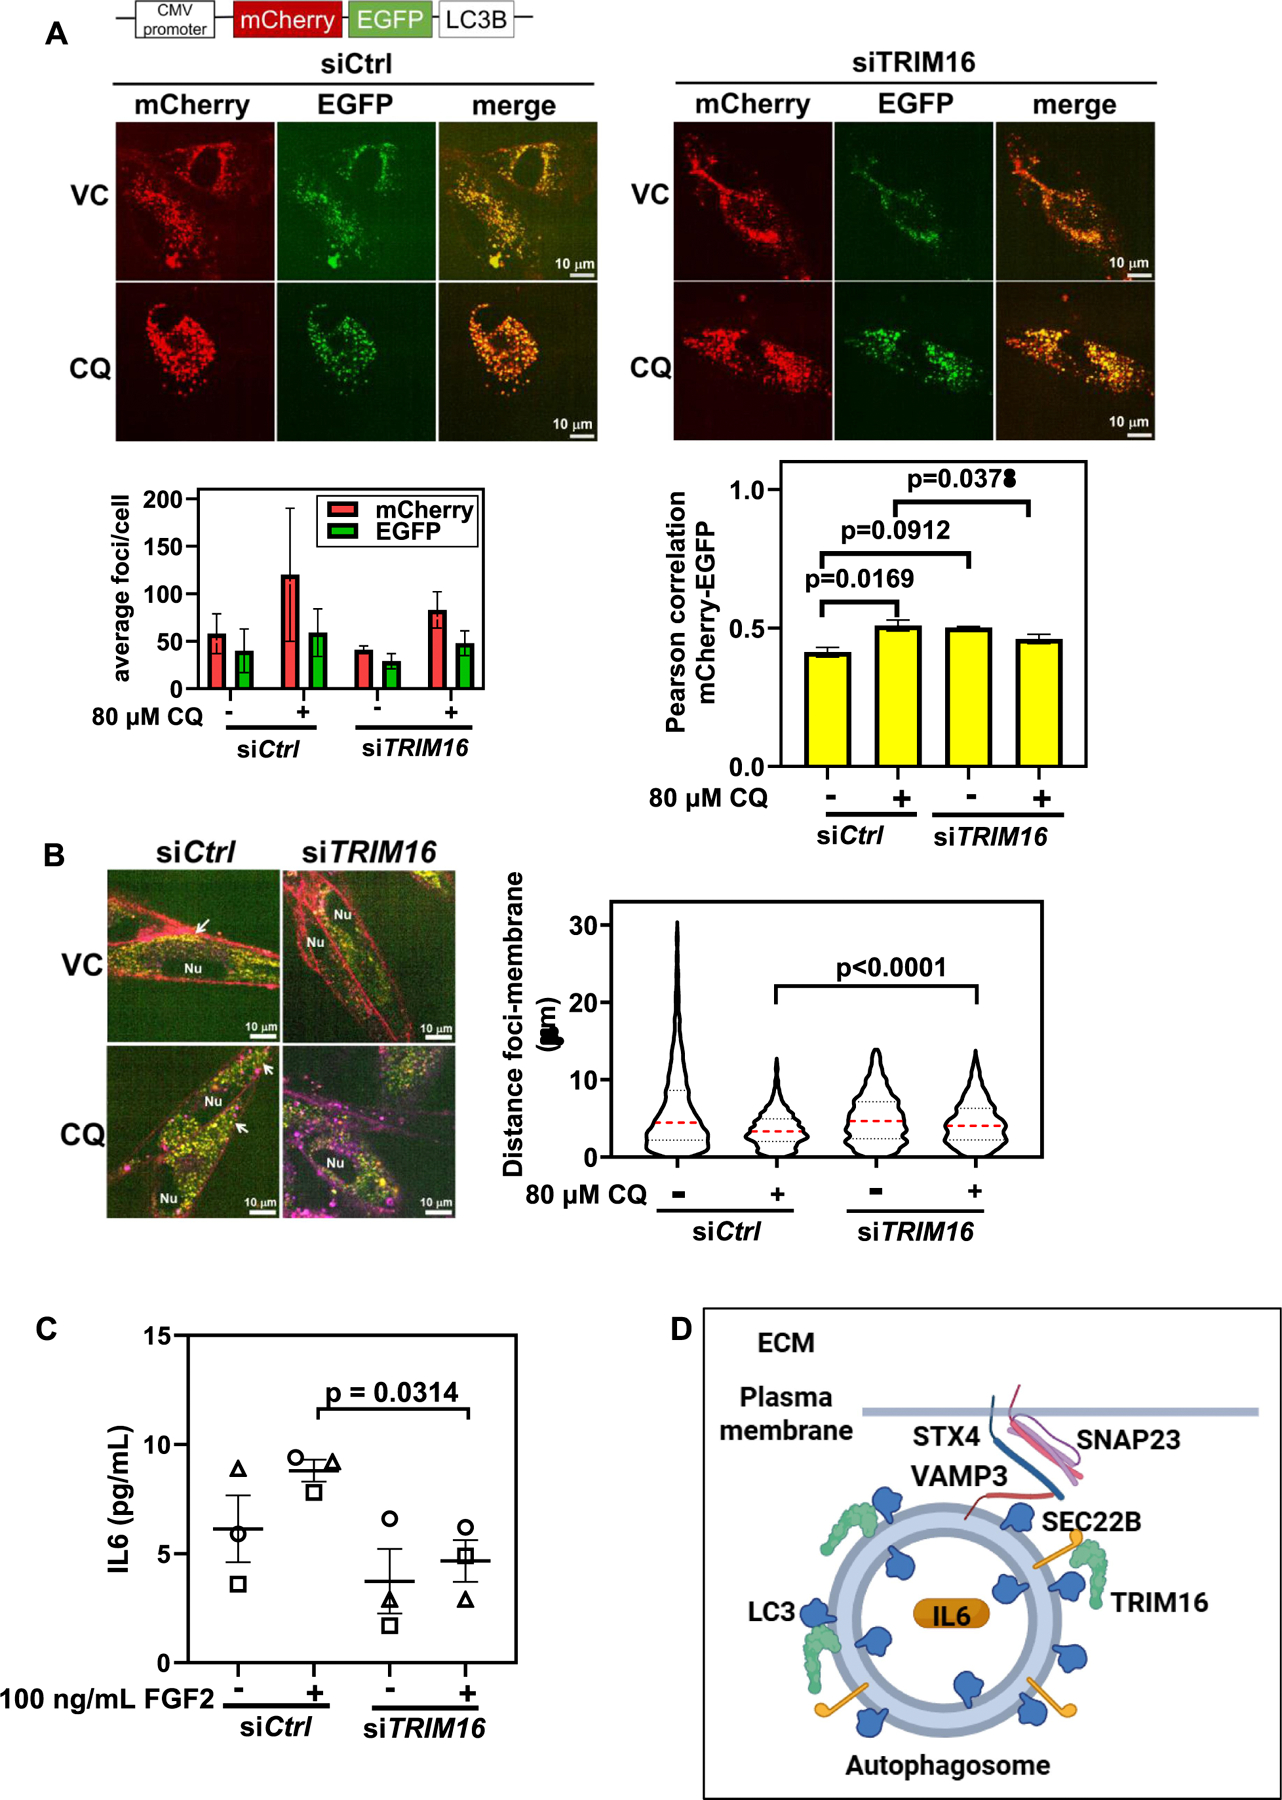
Improving treatment options for head and neck squamous cell carcinoma (HNSCC) requires a deeper understanding of the tumor microenvironment, particularly cancer-associated fibroblasts (CAFs). We previously reported that HNSCC-derived FGF2/bFGF (fibroblast growth factor 2) triggers cytokine release from CAFs via secretory autophagy. Here, using transmission electron microscopy, live-cell imaging, and immunofluorescence, we show that CAF autophagosomes transport cargo, including IL6, to the plasma membrane for secretion. Autophagy in CAFs is constitutive and independent of STAT3, MAPK1/ERK2-MAPK3/ERK1 and phosphoinositide 3-kinase (PI3K) signaling. Despite the significant role of secretory autophagy in CAFs, its molecular machinery has remained elusive. Using both a literature based, and an unbiased approach, we studied the molecular machinery involved in autophagosome trafficking in CAFs. We identified TRIM16, a protein previously reported to traffic to autophagosomes, upregulated in CAFs compared to normal oral fibroblasts. Immunohistochemistry of patient HNSCC stroma revealed co-expression of TRIM16 and LC3B, linking TRIM16 to autophagosome function. An unbiased proteomics profiling of immunoprecipitated LC3B+ vesicles in primary HNSCC CAFs revealed enrichment in trafficking proteins, focal adhesion, and mitochondrial proteins. We demonstrate that SEC22B, SNAP23, VAMP3, and STX4 colocalize with LC3B, IL6, and TRIM16 in CAFs. TRIM16 knockdown reduced autophagosomes at the plasma membrane and decreased IL6 secretion from CAFs. These findings uncover key molecular components involved in autophagy-mediated IL6 secretion in CAFs and suggest potential therapeutic targets for HNSCC.Abbreviations: ACTA2/αSMA: actin alpha 2, smooth muscle; CAF: cancer-associated fibroblasts; CM: conditioned media; CQ: chloroquine; DAPI: 4',6-diamidino-2-phenylindole; DMSO: dimethylsulfoxide; EGFP: enhanced green fluorescent protein; ELISA: enzyme-linked immunosorbent assay; ER: endoplasmic reticulum; FGF2/bFGF: fibroblast growth factor 2; FGFR: fibroblast growth factor receptor; GO: gene ontology; GORASP2/GRASP55: golgi reassembly stacking protein 2; HMGB1: high mobility group box 1; HNSCC: head and neck squamous cell carcinoma; HPV: human papillomavirus; IL6: interleukin 6; IP: immunoprecipitation; LC-MS/MS: liquid chromatography-mass spectrometry/mass spectrometry; LIR: LC3-interacting region; MAP1LC3B/LC3B: microtubule associated protein 1 light chain 3 beta; MAPK1/ERK2: mitogen-activated protein kinase 1; MAPK3/ERK1: mitogen-activated protein kinase 3; NFs: normal oral fibroblasts; NSCLC: non-small cell lung cancer; PLA: proximity ligation assay; SQSTM1/p62: sequestosome 1; STAT3: signal transducer and activator of transcription 3; SNAP23: synaptosome associated protein 23; SNARE: soluble N-ethyl-maleimide-sensitive factor attachment protein receptor; STX4: syntaxin 4; TEM: transmission electron microscopy; TGFB1: transforming growth factor beta 1; TMA: tissue microarray; TRIM: tri-partite motif; VAMP: vesicle associated membrane protein; VC: vehicle control.

Keywords: Autophagosome protein profiling; CAF; HNSCC; IL6; secretion; vesicular trafficking.


Conflict of interest statement

Disclosure statement

No potential conflict of interest was reported by the author(s).

Figures

Figure 1.
Figure 1.
Autophagosomes localize to the plasma membrane in CAFs. (A) TEM image of CAF line 1303T treated with the vehicle control (VC) or 80 μM chloroquine (CQ) for 2 h. The images show autophagic vesicles (*) relative to the plasma membrane and nucleus (nu). (B-D) Three biological replicates of primary CAF lines were transfected with tandem mCherry-EGFP-LC3B (construct schematic). Representative confocal fluorescence images of CAFs treated with VC or 80 μM CQ for 2 h show LC3B foci (yellow) relative to the plasma membrane (magenta). Scale bar: 10 μm. The violin plot depicts the distance between LC3B foci and the plasma membrane under each condition. (C) Kymographs from cells treated with VC and CQ, demonstrating the dissipation of LC3B foci (white arrow) at the plasma membrane (magenta) over 5 min (top panel). The bottom panel shows a magnified image of the inset (white box) at the indicated time points. (d) Representative confocal fluorescence images demonstrating prevalence of red (mCherry) or yellow (mCherry-EGFP) signal in transfected CAFs. The centered bar graph depicts the foci number per cell. The bar graph on the right depicts pearson correlation of mCherry and EGFP signals in VC or CQ treated CAFs. Error bars represent ± SEM.
Figure 2.
Figure 2.
IL6 is an autophagic cargo in CAFs. (A) bar graph depicting ELISA results for IL6 levels (pg/mL) in conditioned media from three biological replicates of primary CAF lines. CAFs were transfected with siRNA for 4 h and recovered overnight in growth media. Growth media was washed off 24 h after transfection and replaced with serum-free media for another 24 h, which was then collected for ELISA measuring IL6. (B) bar graph depicting ELISA results for IL6 levels (pg/mL) in conditioned media from five biological replicates of primary CAF lines. CAFs were treated with VC (HO)/10 μM CQ or VC (DMSO)/5 μM pepstatin a for 24 h in serum-free media, which was then collected for ELISA measuring IL6. (C) confocal fluorescence images of primary CAF line treated with VC or CQ showing IL6 (red), LC3B (green), and DAPI (blue). Scale bar: 10 μm. Bar graph depicting the colocalization of IL6 and LC3B via pearson correlation and threshold Manders (tManders) correlation coefficient in the two biological CAF lines. (D) proximity ligation assay in CAF line, 1151T, treated with VC or 80-μM CQ for 2 h showing PLA of IL6 and LC3B (green puncta). Nuclei are stained with DAPI (blue). Scale bar: 10 μm. Bar graph depicting number of IL6-LC3B puncta per cell, measured in two biological replicates of primary CAF lines. (E) TEM image of the CAF line 1630T in basal condition showing IL6 labeled with 10-nm gold (white arrow). Scale bar: 200 nm. (F) confocal fluorescence images of CAF at basal level showing LAMP1 (red), IL6 (green), and DAPI (blue). Scale bar: 10 μm. (G) confocal fluorescence images of CAF at basal level showing IL6 (red), CD63 (green), and DAPI (blue). Scale bar: 10 μm. (H) bar graph contrasting the colocalization between IL6 and LC3B, CD63, or LAMP1 at basal levels, using pearson correlation and threshold Manders (tManders) correlation coefficient. (I) confocal fluorescence images of CAF at basal level showing combination of PLA for (LC3B – IL6) puncta (red), CD63 (green), and DAPI (blue). Scale bar: 10 μm.
Figure 3.
Figure 3.
TRIM16 is localized to autophagosomes in primary CAFs and patient HSNCC tissue. (A) gels demonstrating RT-PCR transcripts for TRIM16, TRIM19, TRIM32 and ACTB/β-actin in five primary NFs (N) and five CAF lines (C). Bar graph quantifies densitometry of agarose gel bands. Error bars represent ±SEM. (B) confocal fluorescence images CAFs transfected with siRNA control (siCtrl) or TRIM16 (siTRIM16) showing LC3B (red), TRIM16 (green), and DAPI (blue). Scale bar: 10 μm. (C) TEM image of CAF line 981T treated with CQ showing TRIM16 labeled with 10-nm gold (red arrow). Scale bar: 1 μm or 200 nm (inset). (D) IHC staining of TRIM16, LC3B, and ACTA2/αSMA on sequential sections of HNSCC patient TMA (#sampleID). Red square boxes are magnified in the bottom panel. Scale bar: 50 μm. The scatter plot depicts staining for TRIM16 and LC3B of 36 tissues scored with the Aperio image scope module and analyzed for Pearson correlation. Pie charts represent expression levels of TRIM16 and LC3B in fibroblasts of 36 tissues, scored by a board-certified pathologist.
Figure 4.
Figure 4.
Isolation and validation of LC3B+ vesicles from CAFs. (A) workflow for proteomic profiling of autophagosomes immunoprecipitated from primary CAF lines. (B) TEM image of small vesicles (IP input) from primary CAF line 981T, showing autophagic vesicles (av) among other organelles. Scale bar: 500 nm. (C) TEM image of LC3B-bead fraction from IP in primary CAF line 981T, showing autophagic vesicles (av) bound to LC3B-bead. Scale bar: 100 nm. (D) table depicting the sample types for each of the two CAF lines tested. Venn diagram illustrating the number of common proteins among the IP fractions: input, supernatant (S), bead (B) from primary CAF lines 981T and 1014T. (E) table depicting the sample identifiers and indicating three technical replicates per sample. Venn diagram illustrating protein overlap among IP fractions from technical replicates of primary CAF line 1194T. (F) volcano plot depicting differentially expressed proteins in LC3B-bead (LC3B-B) compared to LC3B-supernatant (LC3B-S) in line 1194T.
Figure 5.
Figure 5.
Unbiased profiling of LC3B+ vesicles from CAFs reveal mitochondrial, endosomal, lysosomal, and trafficking proteins. (A) gene ontology (GO) analysis for 249 common proteins in LC3B+ vesicles in three primary CAF lines. (B) heat map of log2iBAQ for curated proteins associated with the autophagosome, lysosome, endosome, and mitochondria in the LC3B-bead fractions from three technical replicates (r1, r2, r3) in primary CAF line 1194T, as well as biological replicates primary CAF line 1014T and 981T. (C) heat map of log2iBAQ for trafficking proteins (“SEC”, “STX”, “SNAP”, “VAMP”, “RAB”) in the LC3B-bead fractions from three technical replicates (r1, r2, r3) in primary CAF line 1194T, as well as biological replicates primary CAF line 1014T and 981T.
Figure 6.
Figure 6.
Trafficking proteins SEC22B, SNAP23, VAMP3, and STX4 colocalize with LC3B in CAFs. (A) confocal fluorescence images of CAF at basal level showing LC3B (red) and trafficking proteins (green) SEC22B, SNAP23, VAMP3, and STX4, and DAPI (blue). Scale bar: 10 μm. Bar graph depicting the colocalization of LC3B and these trafficking proteins via threshold Manders (tManders) correlation coefficient in the two biological CAF lines. (B) proximity ligation assay in CAFs at basal level showing proximity of LC3B and the trafficking proteins (red puncta). Nuclei are stained with DAPI (blue). Scale bar: 10 μm. Bar graph depicting number of LC3B-trafficking proteins puncta per cell, measured in two biological replicates of primary CAF lines.
Figure 7.
Figure 7.
Trafficking proteins SEC22B, SNAP23, VAMP3, and STX4 colocalize with TRIM16 in CAFs. (A) confocal fluorescence images of CAF at basal level showing TRIM16 (red) and the trafficking proteins (green), and DAPI (blue). Scale bar: 10 μm. Bar graph depicting the colocalization of TRIM16 and these trafficking proteins via threshold Manders (tManders) correlation coefficient in the two biological CAF lines. (B) proximity ligation assay in CAFs at basal level showing proximity of TRIM16 and the trafficking proteins (red puncta). Nuclei are stained with DAPI (blue). Scale bar: 10 μm. Bar graph depicting number of TRIM16-trafficking proteins puncta per cell, measured in two biological replicates of primary CAF lines.
Figure 8.
Figure 8.
IL6 colocalizes with TRIM16 and trafficking proteins SEC22B, SNAP23, VAMP3, and STX4 in CAFs. (A) confocal fluorescence images of CAF at basal level showing IL6 (red) and TRIM16, as well as the trafficking proteins (green) SEC22B, SNAP23, VAMP3, and STX4, and DAPI (blue). Scale bar: 10 μm. Bar graph depicting the colocalization of IL6 and TRIM16 or these trafficking proteins via threshold Manders (tManders) correlation coefficient in the two biological CAF lines. (B) proximity ligation assay in CAFs at basal level showing proximity of IL6 and the trafficking proteins (red puncta). Nuclei are stained with DAPI (blue). Scale bar: 10 μm. Bar graph depicting number of IL6-TRIM16 or the trafficking proteins puncta per cell, measured in two biological replicates of primary CAF lines. (C) bar graph depicting ELISA results for IL6 levels (pg/mL) in conditioned media from five biological replicates of primary CAF lines. CAFs were transfected with siRNA for 4 h, recovered overnight. Serum-free media was added for another 18–24 h, which was then collected for ELISA measuring IL6.
Figure 9.
Figure 9.
TRIM16 regulates autophagosome trafficking and IL6 secretion in CAFs. (A) CAF line 1532T transfected with mCherry-EGFP-LC3B (construct schematic). Representative confocal fluorescence images showing the prevalence of autophagosome (red, mCherry) or autolysosome (yellow, mCherry+ EGFP+) signals in transfected CAFs. The bar graph on the left depicts the number of foci per cell. The bar graph on the right shows pearson correlation of mCherry and EGFP signals in VC- or CQ-treated CAFs. Error bars represent ±SEM. (B) confocal fluorescence images of CAF 1532T line treated with VC or 80 μM CQ for 2 h, showing LC3B foci (yellow) relative to the plasma membrane (magenta). Arrows indicate autophagosomes (yellow) relative to the plasma membrane and nuclei (nu). Scale bar: 10 μm. The violin plot depicts the distance between LC3B foci and the plasma membrane under each condition. (C) ELISA results for IL6 levels (pg/mL) in conditioned media from three biological CAF lines, transfected with siRNA control (siCtrl) or TRIM16 (siTRIM16), followed by 24-hour treatment with 100 ng/mL FGF2. (D) diagram illustrating the proposed model of autophagy-mediated IL6 secretion in primary CAFs via secretory autophagic receptor TRIM16. Created with BioRender.com.

References

    1. Cramer JD, Burtness B, Le QT, et al. The changing therapeutic landscape of head and neck cancer. Nat Rev Clin Oncol 2019. Nov;16(11):669–683. doi: 10.1038/s41571-019-0227-z - DOI - PubMed
    1. Johnson DE, Burtness B, Leemans CR, et al. Head and neck squamous cell carcinoma. Nat Rev Dis Primers. 2020. Nov 26;6 (1):92. doi: 10.1038/s41572-020-00224-3 - DOI - PMC - PubMed
    1. New J, Arnold L, Ananth M, et al. Secretory autophagy in cancer-associated fibroblasts promotes head and neck cancer progression and offers a novel Therapeutic target. Cancer Res 2017. Dec 1;77(23):6679–6691. doi: 10.1158/0008-5472.CAN-17-1077 - DOI - PMC - PubMed
    1. Kumar D, New J, Vishwakarma V, et al. Cancer-associated Fibroblasts drive glycolysis in a targetable signaling loop implicated in head and neck squamous cell carcinoma progression. Cancer Res 2018. Jul 15;78(14):3769–3782. doi: 10.1158/0008-5472.CAN-17-1076 - DOI - PMC - PubMed
    1. Wheeler SE, Shi H, Lin F, et al. Enhancement of head and neck squamous cell carcinoma proliferation, invasion, and metastasis by tumor-associated fibroblasts in preclinical models. Head Neck. 2014. Mar;36(3):385–392. doi: 10.1002/hed.23312 - DOI - PMC - PubMed