

Surface and Subsurface Mass Spectrometric Analysis of Dexamethasone in Solid Pharmaceutical Dosage Forms
- PMID: 40383988
- PMCID: PMC12086350
- DOI: 10.1002/jms.5147
Surface and Subsurface Mass Spectrometric Analysis of Dexamethasone in Solid Pharmaceutical Dosage Forms
Abstract
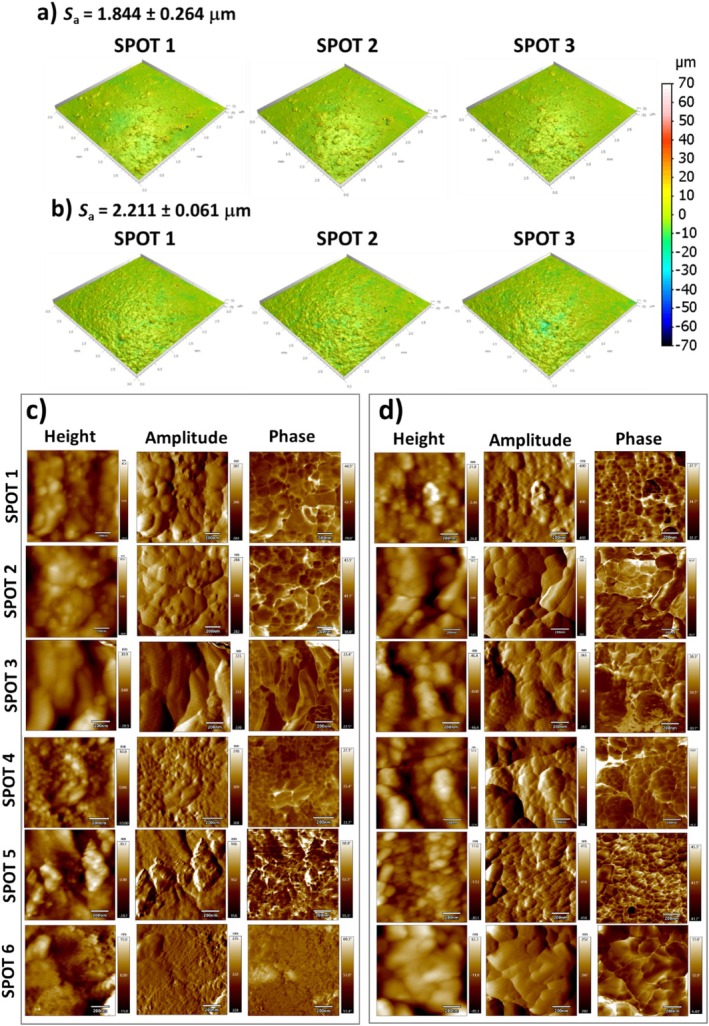
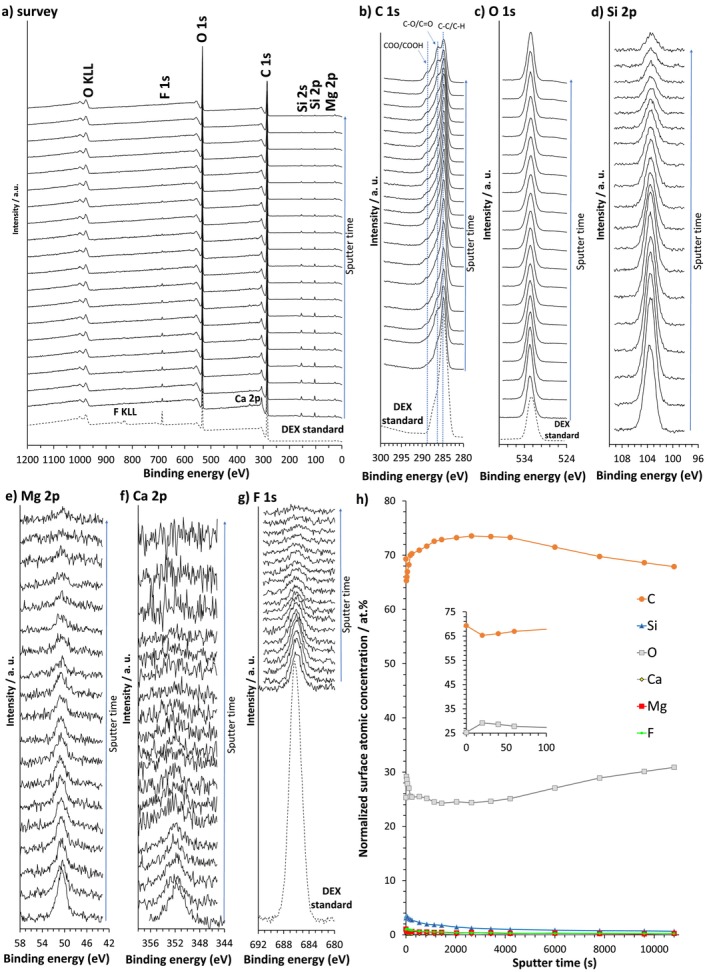
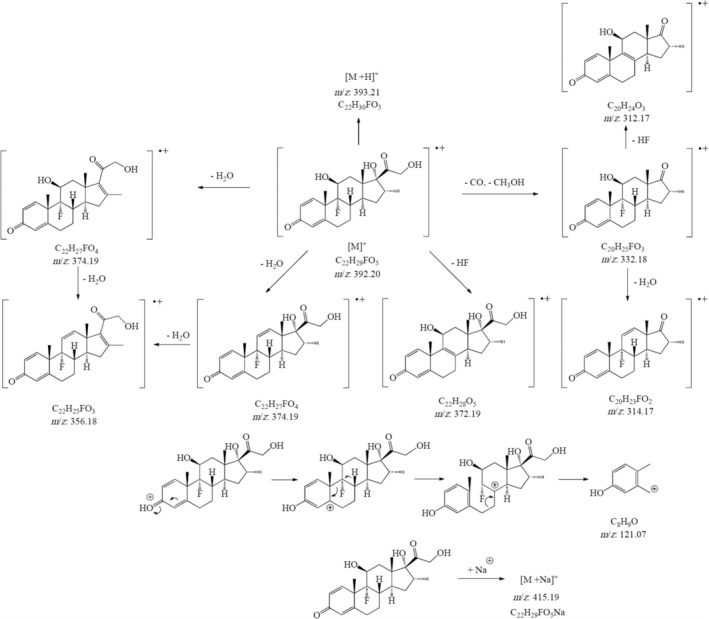
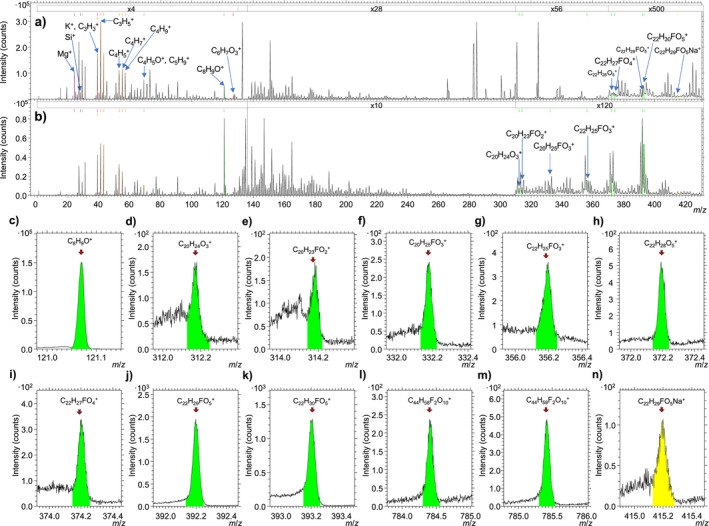
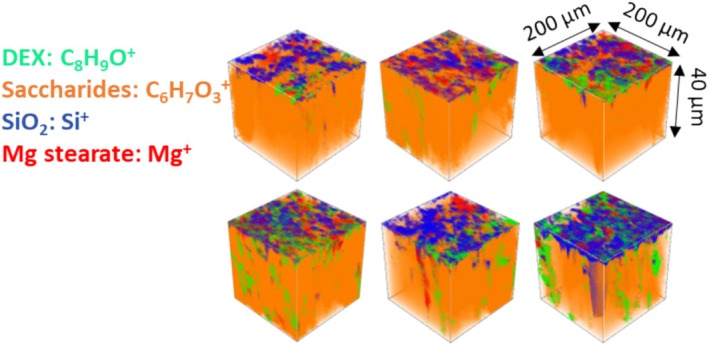
This study presents an in-depth mass spectrometric investigation of dexamethasone (DEX) distribution within pharmaceutical tablets using time-of-flight secondary ion mass spectrometry (ToF-SIMS) combined with gas cluster ion beam (GCIB) sputtering. Fragmentation mechanism of DEX was identified, which enabled the determination of three-dimensional chemical imaging of the active ingredient in both surface and subsurface regions. The data reveal that a 4-mg DEX formulation exhibits a continuous and extended distribution of the drug into the tablet matrix, while a 0.5-mg formulation shows DEX localized in distinct, isolated domains. Topographical features and the overall composition of the surface were confirmed by complementary analyses employing atomic force microscopy (AFM) and x-ray photoelectron spectroscopy (XPS). These results demonstrate how molecule distribution patterns can be linked to formulation heterogeneity using advanced mass spectrometric techniques, opening new possibilities for pharmaceutical manufacturing quality control and optimization.
Keywords: AFM; ToF‐SIMS; XPS; active ingredient; dexamethasone; tablet analysis.
© 2025 The Author(s). Journal of Mass Spectrometry published by John Wiley & Sons Ltd.
Conflict of interest statement
The author declares no conflicts of interest.
Figures
Similar articles
-
Enhanced surface sensitivity in secondary ion mass spectrometric analysis of organic thin films using size-selected Ar gas-cluster ion projectiles.Rapid Commun Mass Spectrom. 2010 May 30;24(10):1405-10. doi: 10.1002/rcm.4529. Rapid Commun Mass Spectrom. 2010. PMID: 20411579
-
Three-dimensional time-of-flight secondary ion mass spectrometry imaging of a pharmaceutical in a coronary stent coating as a function of elution time.Anal Chem. 2009 Dec 15;81(24):9930-40. doi: 10.1021/ac901587k. Anal Chem. 2009. PMID: 19919043
-
Application of surface chemical analysis tools for characterization of nanoparticles.Anal Bioanal Chem. 2010 Feb;396(3):983-1002. doi: 10.1007/s00216-009-3360-1. Epub 2010 Jan 6. Anal Bioanal Chem. 2010. PMID: 20052578 Free PMC article. Review.
-
Surface analysis and interface properties of 2-aminobenzimidazole corrosion inhibitor for brass in chloride solution.Anal Bioanal Chem. 2020 Dec;412(30):8431-8442. doi: 10.1007/s00216-020-02981-2. Epub 2020 Nov 2. Anal Bioanal Chem. 2020. PMID: 33135086
-
Surface analysis for compositional, chemical and structural imaging in pharmaceutics with mass spectrometry: a ToF-SIMS perspective.Int J Pharm. 2011 Sep 30;417(1-2):61-9. doi: 10.1016/j.ijpharm.2011.01.043. Epub 2011 Jan 26. Int J Pharm. 2011. PMID: 21277966 Review.
References
-
- Jansen C. S., Pagadala M. S., Cardenas M. A., et al., “Pre‐Operative Stereotactic Radiosurgery and Peri‐Operative Dexamethasone for Resectable Brain Metastases: A Two‐Arm Pilot Study Evaluating Clinical Outcomes and Immunological Correlates,” Nature Communications 15, no. 1 (2024): 8854. - PMC - PubMed
MeSH terms
Substances
Grants and funding
LinkOut - more resources
Full Text Sources
Miscellaneous
